Business data graph PowerPoint Presentation Templates and Google Slides
-
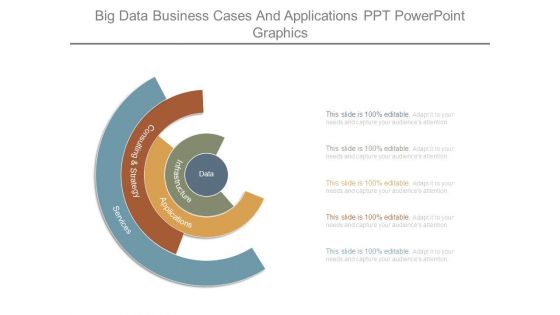
Big Data Business Cases And Applications Ppt Powerpoint Graphics
This is a big data business cases and applications ppt powerpoint graphics. This is a five stage process. The stages in this process are services, consulting and strategy, applications, infrastructure, data.
-
Business Data Backup Ppt PowerPoint Presentation Infographic Template Graphics Tutorials Cpb
This is a business data backup ppt powerpoint presentation infographic template graphics tutorials cpb. This is a five stage process. The stages in this process are business data backup.
-
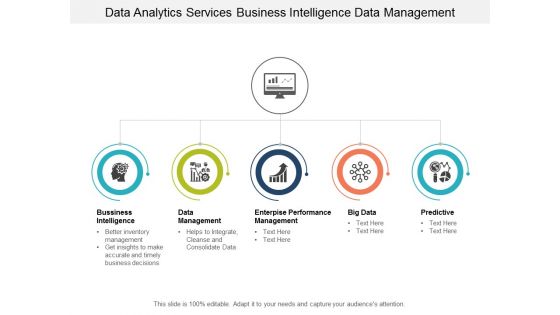
Data Analytics Services Business Intelligence Data Management Ppt PowerPoint Presentation Pictures Graphics
This is a data analytics services business intelligence data management ppt powerpoint presentation pictures graphics. This is a five stage process. The stages in this process are problem, management, business solution.
-
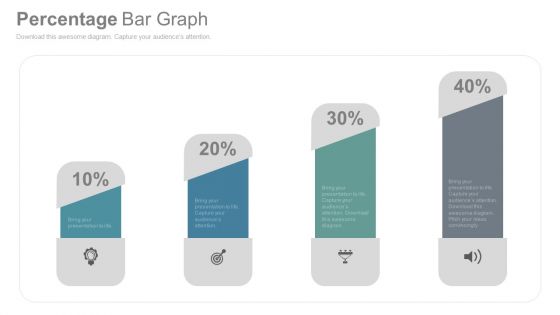
Bar Graph To Compare Business Data PowerPoint Slides
This is the slide which can solve many purposes of yours. Be it growth in your company, need to show your company?s status in the market as compared to others, or how your business has improved so far. An ideal PowerPoint template to display all of these. You can easily use this graph to show the growth of your company using the percentage icons. You can use this visual to show the status of your company in the market in comparison with others. You can edit the icons and replace them with the logo of your company and the others. You can also show it to your colleagues how your company has built its image in the market or how it has improved over the time. A perfect bar graph image which needs to be included in your business PPT presentations.
-
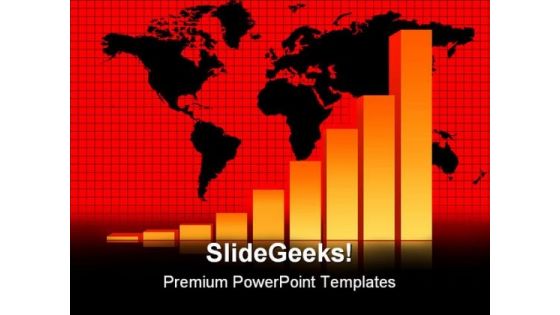
Business Data Graph Finance PowerPoint Templates And PowerPoint Backgrounds 0511
Microsoft PowerPoint Template and Background with increasing bar chart business data graph with world map
-
Business Data Graph Finance PowerPoint Themes And PowerPoint Slides 0511
Microsoft PowerPoint Slide and Theme with increasing bar chart business data graph with world map
-
Business Education PowerPoint Templates Business Bar Graph Data Driven Ppt Slides
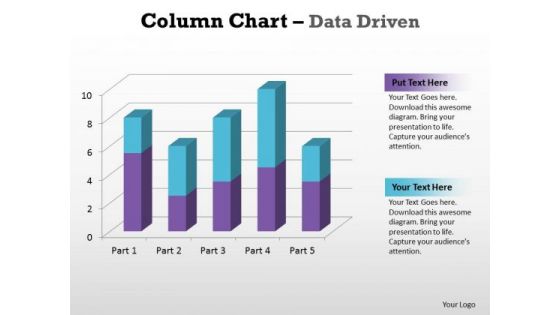
Business Education PowerPoint Templates Business bar graph data driven PPT Slides-This PowerPoint slide is a data driven Columns Chart. The number of columns depend on the data.-Business Editable PowerPoint Templates Business beveled column chart PPT Slides-This ppt can be used for concepts relating to-chart,, graph, growth, investment, , market, percentage, , presentation report, results, statistics, stock, success and business.
-
Business Graphic PowerPoint Templates Business Column Chart Data Driven Ppt Slides
Business Graphic PowerPoint Templates Business column chart data driven PPT Slides-With help of visual aids like this template you can capture the attention of the audience and make the presentation very interactive and lively.-Business Graphic PowerPoint Templates Business column chart data driven PPT Slides-This ppt can be used for concepts relating to-chart,, graph, growth, investment, , market, percentage, , presentation report, results, statistics, stock, success and business.
-
Business Graphic PowerPoint Templates Business Waterfall Chart Data Driven Ppt Slides
Business Graphic PowerPoint Templates Business waterfall chart data driven PPT Slides- This Water Fall chart can display continuous data over time, set against a common scale, and are therefore ideal for showing trends in data at equal intervals-This ppt can be used for concepts relating to-chart,, graph, growth, investment, , market, percentage, , presentation report, results, statistics, stock, success and business.
-
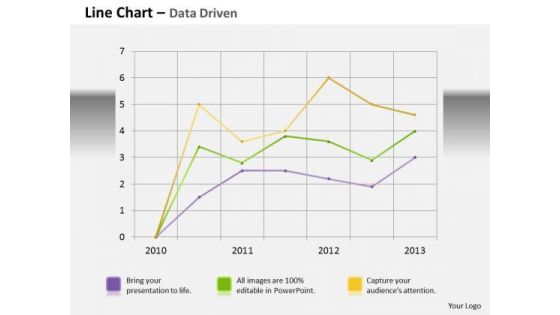
Data Analysis Template Driven Line Chart Business Graph PowerPoint Slides Templates
Bottle Your Thoughts In Our data analysis template driven line chart business graph powerpoint slides Templates . Pass It Around For Your Audience To Sip.
-
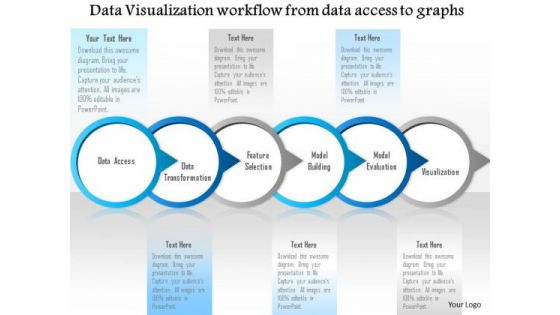
Business Diagram Data Visualization Workflow From Data Access To Graphs Ppt Slide
Graphic of workflow has been used to design this diagram. This diagram slide depicts the concept of data visualization from data access. This diagrams suitable for technology and internet related presentations.
-
Business Diagram 3d Graph Of Crossing Chasm And Data Presentation Template
This business diagram has been designed with graphic of 3d graph. This slide contains the concept of chasm and data calculation. Use this slide to display chasm crossing condition. This business diagram adds value to your ideas.
-
Stock Photo 3d Pie Graph For Business Data Representation PowerPoint Slide
3D business graph has been used to design this PowerPoint template. This Image slide is suitable to make business reports and charts. This slide can be used for business and marketing presentations.
-
Business Diagram 3d Bulb Graphic For Data Driven And Idea Generation PowerPoint Slide
This Power Point template has been designed with 3d bulb graphic. Use this slide to represent technology idea and strategy concepts. Download this diagram for your business presentations and get exclusive comments on your efforts.
-
Business Diagram 3d Colorful Pie Graph With Magnifier Data Search PowerPoint Slide
This business slide displays 3d colorful pie graph with magnifier. This diagram is a data visualization tool that gives you a simple way to present statistical information. This slide helps your audience examine and interpret the data you present.
-
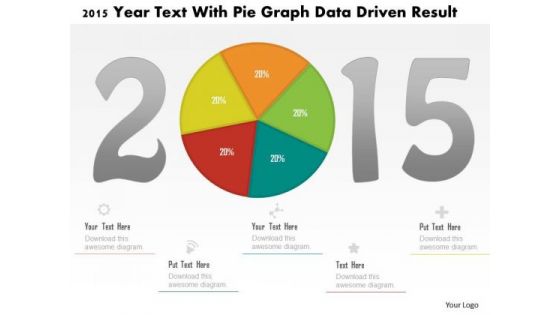
Business Diagram 2015 Year Text With Pie Graph Data Driven Result PowerPoint Slide
This business diagram displays 2015 year numbers with pie chart. This diagram is suitable to display business strategy for year 2015. Download this professional slide to present information in an attractive manner
-
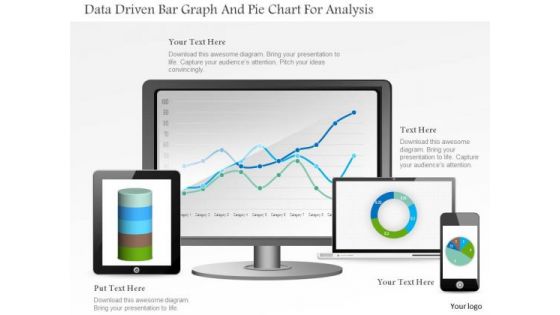
Business Diagram Data Driven Bar Graph And Pie Chart For Analysis PowerPoint Slide
This PowerPoint template displays technology gadgets with various business charts. Use this diagram slide, in your presentations to make business reports for statistical analysis. You may use this diagram to impart professional appearance to your presentations.
-
Business Diagram Human Face With Colored Graph For Data Analysis PowerPoint Slide
This diagram displays human face graphic with colored graph. This diagram can be used to represent strategy, planning, thinking of business plan. Display business options in your presentations by using this creative diagram.
-
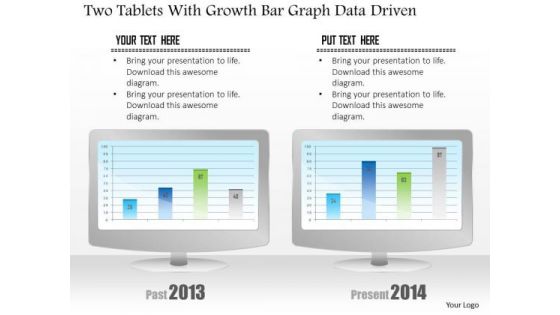
Business Diagram Two Tablets With Growth Bar Graph Data Driven PowerPoint Slide
This business diagram has been designed with comparative charts on tablets. This slide suitable for data representation. You can also use this slide to present business reports and information. Use this diagram to present your views in a wonderful manner.
-
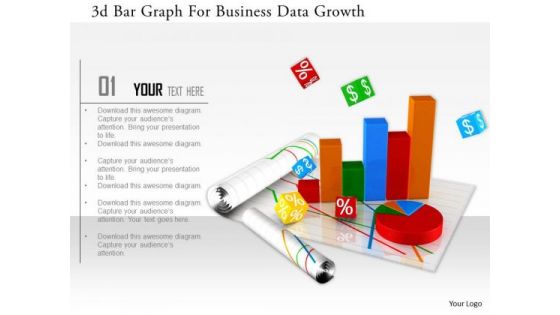
Stock Photo 3d Bar Graph For Business Data Growth Image Graphics For PowerPoint Slide
This image slide has graphics of financial charts and reports. This contains bar graph and pie chart to present business reports. Build an innovative presentations using this professional image slide.
-
Business Diagram Bar Graph With Text Boxes For Data Display Presentation Template
Our above business diagram displays bar graph. It contains four steps on bar graph with icons. Use this diagram to display four stages of business growth. Download this Power Point slide to build quality presentation for your viewers.
-
Business Diagram Business Bar Graph For Data Analysis Presentation Template
This business slide displays pie charts with percentage ratios. This diagram is a data visualization tool that gives you a simple way to present statistical information. This slide helps your audience examines and interprets the data you present.
-
Business Diagram Colored Graph For Business And Finance Data Analysis Presentation Template
This Power Point template has been designed with graphic of colored bar graph. Use this slide to represent five steps of any business process. Use this diagram for your business presentations and get exclusive comments on your efforts.
-
Business Diagram Data Driven Puzzle Pieces Info Graphic Presentation Template
Our above diagram provides data driven puzzle info graphic. This slide contains diagram of puzzle pieces depicting concepts like innovation strategy, research, solution, management and teamwork. Download this diagram to make professional presentations.
-
Man Presenting Data With Business Graph Powerpoint Templates
Our above business slide contains graphic of man showing business graph. This slide may be used for market research study. Capture the attention of your audience with this slide.
-
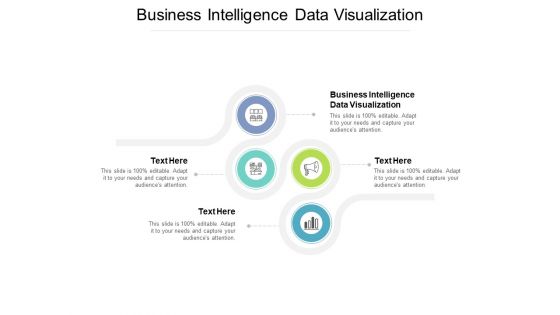
Business Intelligence Data Visualization Ppt PowerPoint Presentation Infographics Graphics Tutorials Cpb
Presenting this set of slides with name business intelligence data visualization ppt powerpoint presentation infographics graphics tutorials cpb. This is an editable Powerpoint four stages graphic that deals with topics like business intelligence data visualization to help convey your message better graphically. This product is a premium product available for immediate download and is 100 percent editable in Powerpoint. Download this now and use it in your presentations to impress your audience.
-
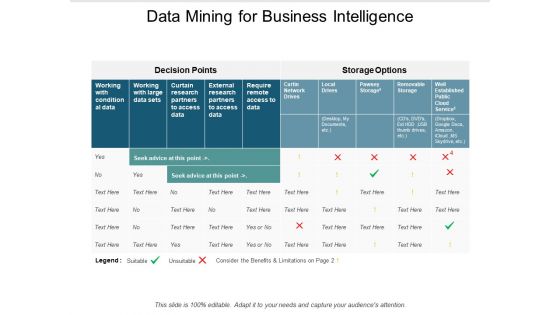
Data Mining For Business Intelligenece Ppt Powerpoint Presentation Ideas Graphic Tips
Presenting this set of slides with name data mining for business intelligenece ppt powerpoint presentation ideas graphic tips. The topics discussed in these slides are data storage, service providers, computer information. This is a completely editable PowerPoint presentation and is available for immediate download. Download now and impress your audience.
-
Major Tactics For Business Data Governance Ppt PowerPoint Presentation File Graphics Download PDF
Presenting major tactics for business data governance ppt powerpoint presentation file graphics download pdf to dispense important information. This template comprises six stages. It also presents valuable insights into the topics including processing, communicated, effective. This is a completely customizable PowerPoint theme that can be put to use immediately. So, download it and address the topic impactfully.
-
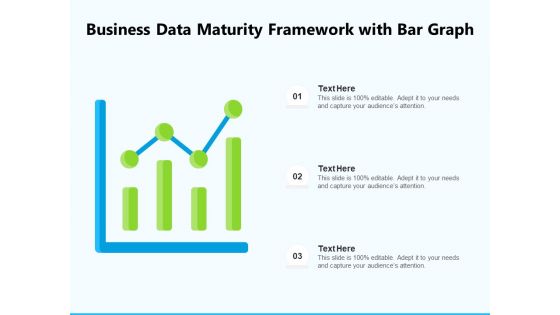
Business Data Maturity Framework With Bar Graph Ppt PowerPoint Presentation File Slides PDF
Presenting business data maturity framework with bar graph ppt powerpoint presentation file slides pdf to dispense important information. This template comprises three stages. It also presents valuable insights into the topics including business data maturity framework with bar graph. This is a completely customizable PowerPoint theme that can be put to use immediately. So, download it and address the topic impactfully.
-
Business Data Analysis Roadmap Graphics PDF
This is a business data analysis roadmap graphics pdf template with various stages. Focus and dispense information on four stages using this creative set, that comes with editable features. It contains large content boxes to add your information on topics like roadmap. You can also showcase facts, figures, and other relevant content using this PPT layout. Grab it now.
-
Data Assimilation Business Intelligence KPI Dashboard Score Ppt Graphics PDF
Deliver and pitch your topic in the best possible manner with this data assimilation business intelligence kpi dashboard score ppt graphics pdf. Use them to share invaluable insights on revenue, projections, locations, growth, sales and impress your audience. This template can be altered and modified as per your expectations. So, grab it now.
-
Data Assimilation Business Intelligence KPI Metrics Unit Ppt Pictures Graphics Download PDF
This is a data assimilation business intelligence kpi metrics unit ppt pictures graphics download pdf template with various stages. Focus and dispense information on four stages using this creative set, that comes with editable features. It contains large content boxes to add your information on topics like average purchase value, average lifetime value, average unit price. You can also showcase facts, figures, and other relevant content using this PPT layout. Grab it now.
-
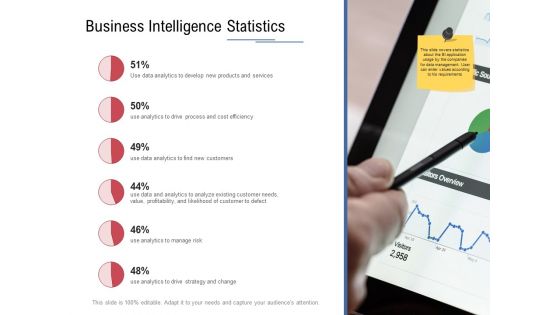
Data Assimilation Business Intelligence Statistics Ppt Slides Graphics Design PDF
This is a data assimilation business intelligence statistics ppt slides graphics design pdf template with various stages. Focus and dispense information on six stages using this creative set, that comes with editable features. It contains large content boxes to add your information on topics like data analytics, develop, services, efficiency, cost. You can also showcase facts, figures, and other relevant content using this PPT layout. Grab it now.
-
Research And Data Expert Assessing Business Data Vector Icon Ppt PowerPoint Presentation File Graphics PDF
Persuade your audience using this research and data expert assessing business data vector icon ppt powerpoint presentation file graphics pdf. This PPT design covers three stages, thus making it a great tool to use. It also caters to a variety of topics including research and data expert assessing business data vector icon. Download this PPT design now to present a convincing pitch that not only emphasizes the topic but also showcases your presentation skills.
-
Three Elements Of Business Analytics With Data Mining Ppt PowerPoint Presentation Portfolio Graphics PDF
Presenting three elements of business analytics with data mining ppt powerpoint presentation portfolio graphics pdf to dispense important information. This template comprises three stages. It also presents valuable insights into the topics including three elements of business analytics with data mining. This is a completely customizable PowerPoint theme that can be put to use immediately. So, download it and address the topic impactfully.
-
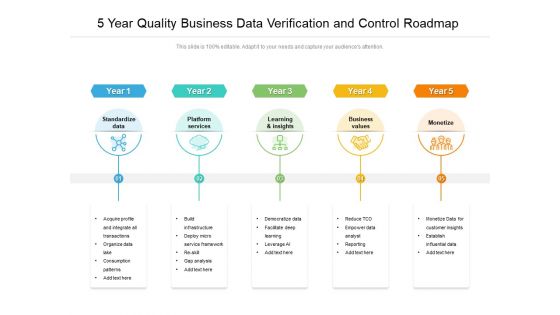
5 Year Quality Business Data Verification And Control Roadmap Graphics
We present our 5 year quality business data verification and control roadmap graphics. This PowerPoint layout is easy-to-edit so you can change the font size, font type, color, and shape conveniently. In addition to this, the PowerPoint layout is Google Slides compatible, so you can share it with your audience and give them access to edit it. Therefore, download and save this well-researched 5 year quality business data verification and control roadmap graphics in different formats like PDF, PNG, and JPG to smoothly execute your business plan.
-
Stages To Implement Data Quality Measurement Process In Business Ppt PowerPoint Presentation Layouts Graphics Design PDF
Presenting stages to implement data quality measurement process in business ppt powerpoint presentation layouts graphics design pdf to dispense important information. This template comprises eight stages. It also presents valuable insights into the topics including create and define a uniform understanding of the core process, determine sensible measuring points on the process chain, set up data quality criteria, evaluate prototypes and measurement results, build a first sensible dq improvement measure. This is a completely customizable PowerPoint theme that can be put to use immediately. So, download it and address the topic impactfully.
-
Nine Steps Timeline For Business Big Data Evaluation Ppt PowerPoint Presentation Gallery Graphics PDF
Persuade your audience using this nine steps timeline for business big data evaluation ppt powerpoint presentation gallery graphics pdf. This PPT design covers nine stages, thus making it a great tool to use. It also caters to a variety of topics including decide data source, manage unstructured data, eliminating useless data. Download this PPT design now to present a convincing pitch that not only emphasizes the topic but also showcases your presentation skills.
-
Business Data Statistical Dashboard Vector Icon Ppt PowerPoint Presentation Icon Graphics Template PDF
Persuade your audience using this business data statistical dashboard vector icon ppt powerpoint presentation icon graphics template pdf. This PPT design covers three stages, thus making it a great tool to use. It also caters to a variety of topics including business data statistical dashboard vector icon. Download this PPT design now to present a convincing pitch that not only emphasizes the topic but also showcases your presentation skills.
-
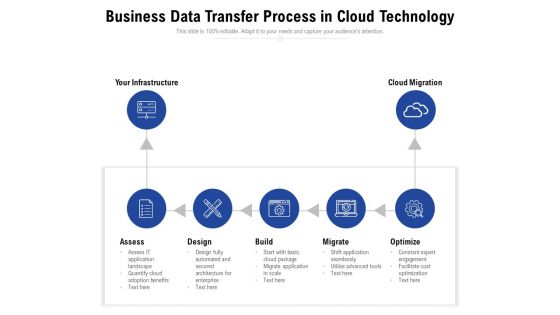
Business Data Transfer Process In Cloud Technology Ppt PowerPoint Presentation Styles Graphics Design PDF
Presenting this set of slides with name business data transfer process in cloud technology ppt powerpoint presentation styles graphics design pdf. This is a seven stage process. The stages in this process are your infrastructure, cloud migration, assess, design, build, migrate, optimize. This is a completely editable PowerPoint presentation and is available for immediate download. Download now and impress your audience.
-
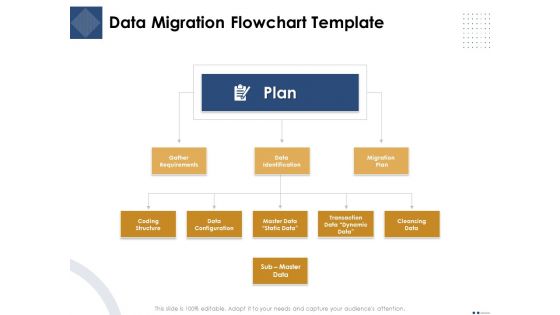
Introducing And Implementing Approaches Within The Business Data Migration Flowchart Template Graphics PDF
Presenting this set of slides with name introducing and implementing approaches within the business data migration flowchart template graphics pdf. This is a three stage process. The stages in this process are plan, gather requirements, data identification, migration, plan, coding structure, data configuration, master data static data, transaction data dynamic data, cleansing data, sub master data. This is a completely editable PowerPoint presentation and is available for immediate download. Download now and impress your audience.
-
Introducing And Implementing Data Migration Approaches Within The Business Icons Slide Graphics PDF
Presenting this set of slides containing editable icons for topic introducing and implementing data migration approaches within the business icons slide graphics pdf. All icons in this slide are 100 percent editable. You can replace icons in your deck with any of these icons. Download now and impress your audience.
-
Thank You Business Data Sources Ppt PowerPoint Presentation Model Graphics
Presenting this set of slides with name thank you business data sources ppt powerpoint presentation model graphics. The topics discussed in these slide is thank you. This is a completely editable PowerPoint presentation and is available for immediate download. Download now and impress your audience.
-
Business Intelligence For Digital Business With Data Modelling Ppt PowerPoint Presentation Icon Graphics
Presenting this set of slides with name business intelligence for digital business with data modelling ppt powerpoint presentation icon graphics. This is a five stage process. The stages in this process are data rich online portals, data extraction, data pattern matching and filtering, data modeling and maintenance, data monitoring and analytics. This is a completely editable PowerPoint presentation and is available for immediate download. Download now and impress your audience.
-
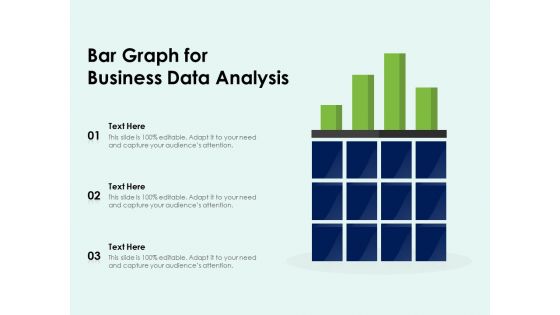
Bar Graph For Business Data Analysis Ppt PowerPoint Presentation File Graphics Template PDF
Presenting this set of slides with name bar graph for business data analysis ppt powerpoint presentation file graphics template pdf. The topics discussed in these slide is bar graph for business data analysis. This is a completely editable PowerPoint presentation and is available for immediate download. Download now and impress your audience.
-
Business Statistics Data Chart Vector Icon Ppt PowerPoint Presentation File Graphics Design PDF
Presenting this set of slides with name business statistics data chart vector icon ppt powerpoint presentation file graphics design pdf. The topics discussed in these slide is business statistics data chart vector icon. This is a completely editable PowerPoint presentation and is available for immediate download. Download now and impress your audience.
-
Bar Graph Showing Data For Business Progress Ppt PowerPoint Presentation Gallery Demonstration PDF
Presenting this set of slides with name bar graph showing data for business progress ppt powerpoint presentation gallery demonstration pdf. The topics discussed in these slide is bar graph showing data for business progress. This is a completely editable PowerPoint presentation and is available for immediate download. Download now and impress your audience.
-
Data Analysis Business Graphs Vector Icon Ppt PowerPoint Presentation Gallery Layouts PDF
Presenting this set of slides with name data analysis business graphs vector icon ppt powerpoint presentation gallery layouts pdf. This is a one stage process. The stages in this process is data analysis business graphs vector icon. This is a completely editable PowerPoint presentation and is available for immediate download. Download now and impress your audience.
-
Data Storage Icon For Promotional Business Content Ppt PowerPoint Presentation File Graphics Download PDF
Presenting data storage icon for promotional business content ppt powerpoint presentation file graphics download pdf to dispense important information. This template comprises three stages. It also presents valuable insights into the topics including data storage icon for promotional business content. This is a completely customizable PowerPoint theme that can be put to use immediately. So, download it and address the topic impactfully.
-
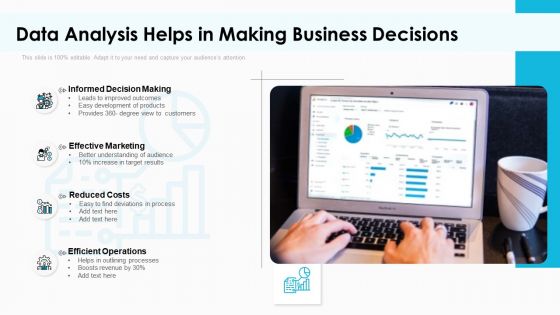
Data Analysis Helps In Making Business Decisions Graphics PDF
Presenting data analysis helps in making business decisions graphics pdf. to dispense important information. This template comprises four stages. It also presents valuable insights into the topics including informed decision making, effective marketing, reduced costs, efficient operations. This is a completely customizable PowerPoint theme that can be put to use immediately. So, download it and address the topic impactfully.
-
Business Stock Data Management Vector Icon Ppt PowerPoint Presentation Gallery Graphics Download PDF
Pitch your topic with ease and precision using this business stock data management vector icon ppt powerpoint presentation gallery graphics download pdf. This layout presents information on business stock data management vector icon. It is also available for immediate download and adjustment. So, changes can be made in the color, design, graphics or any other component to create a unique layout.
-
Complete Business Plan With Data Collection Ppt PowerPoint Presentation Portfolio Graphic Tips PDF
Pitch your topic with ease and precision using this complete business plan with data collection ppt powerpoint presentation portfolio graphic tips pdf. This layout presents information on initial stage, data collection, community planning process It is also available for immediate download and adjustment. So, changes can be made in the color, design, graphics or any other component to create a unique layout.
-
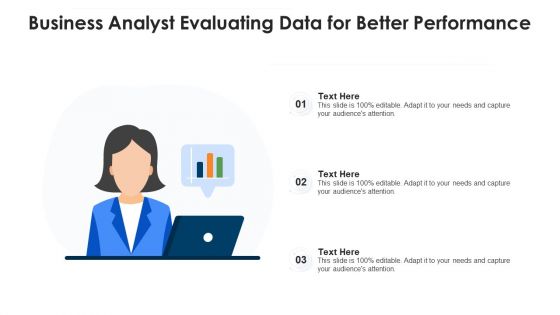
Business Analyst Evaluating Data For Better Performance Ppt PowerPoint Presentation Gallery Graphics PDF
Presenting business analyst evaluating data for better performance ppt powerpoint presentation gallery graphics pdf to dispense important information. This template comprises three stages. It also presents valuable insights into the topics including business analyst evaluating data for better performance. This is a completely customizable PowerPoint theme that can be put to use immediately. So, download it and address the topic impactfully.
-
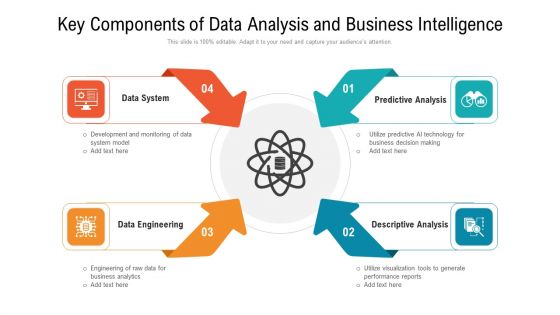
Key Components Of Data Analysis And Business Intelligence Ppt PowerPoint Presentation Pictures Graphics PDF
Persuade your audience using this key components of data analysis and business intelligence ppt powerpoint presentation pictures graphics pdf. This PPT design covers four stages, thus making it a great tool to use. It also caters to a variety of topics including data system, data engineering, predictive analysis. Download this PPT design now to present a convincing pitch that not only emphasizes the topic but also showcases your presentation skills.
-
Business Intelligence And Big Business Case And Key Data Analytics Task Roadmap Graphics PDF
This slide covers the business case of data analytics project that defines the major steps, key tasks and project owners with multiple strategic layer of business. Deliver and pitch your topic in the best possible manner with this business intelligence and big business case and key data analytics task roadmap graphics pdf. Use them to share invaluable insights on business layer, analytics layer, technique layer, technology layer and impress your audience. This template can be altered and modified as per your expectations. So, grab it now.
-
Business Intelligence And Big Priority Checklist For Data Analytics Program Graphics PDF
The slide displays the to do list that allows to set the high priority task at first and Least priority at last to ensure consistency and completeness while performing the process. This is a business intelligence and big priority checklist for data analytics program graphics pdf template with various stages. Focus and dispense information on four stages using this creative set, that comes with editable features. It contains large content boxes to add your information on topics like high priority tasks, medium priority tasks, low priority tasks. You can also showcase facts, figures, and other relevant content using this PPT layout. Grab it now.
-
Key Checklist For Data Analytics Program Business Intelligence And Big Graphics PDF
This diagram illustrates the stream Analytics pipeline, showing how data is ingested, analyzed, and then sent for presentation or action. This is a key checklist for data analytics program business intelligence and big graphics pdf template with various stages. Focus and dispense information on eight stages using this creative set, that comes with editable features. It contains large content boxes to add your information on topics like applications, devices and gateways, stream analytics, presentation and action. You can also showcase facts, figures, and other relevant content using this PPT layout. Grab it now.
-
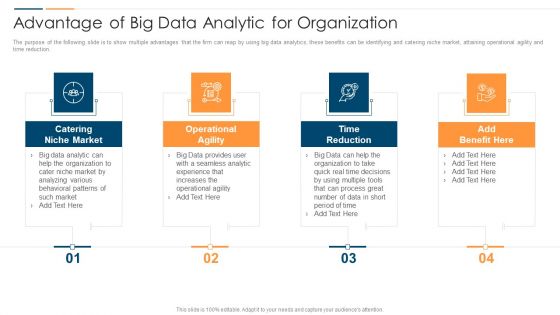
Revolution In Online Business Advantage Of Big Data Analytic For Organization Graphics PDF
The purpose of the following slide is to show multiple advantages that the firm can reap by using big data analytics, these benefits can be identifying and catering niche market, attaining operational agility and time reduction. This is a Revolution In Online Business Advantage Of Big Data Analytic For Organization Graphics PDF template with various stages. Focus and dispense information on four stages using this creative set, that comes with editable features. It contains large content boxes to add your information on topics like Catering Niche Market, Operational Agility Provides, Time Reduction Benefit. You can also showcase facts, figures, and other relevant content using this PPT layout. Grab it now.
-
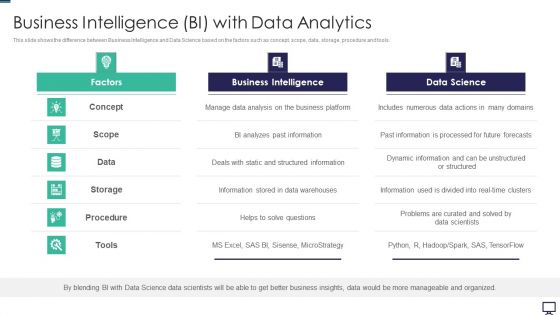
Business Intelligence BI With Data Analytics Ppt Infographic Template Graphics PDF
Deliver an awe inspiring pitch with this creative business intelligence bi with data analytics ppt infographic template graphics pdf bundle. Topics like information, analyzes, business, microstrategy can be discussed with this completely editable template. It is available for immediate download depending on the needs and requirements of the user.
-
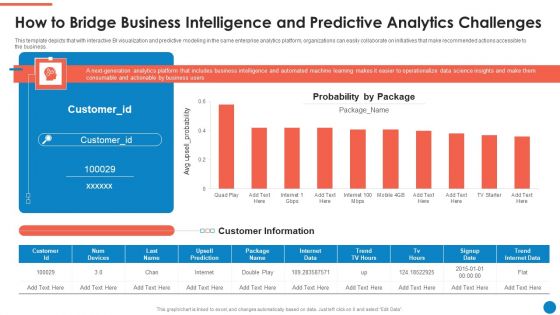
Data And Analytics Playbook How To Bridge Business Intelligence And Predictive Graphics PDF
This template depicts that with interactive BI visualization and predictive modeling in the same enterprise analytics platform, organizations can easily collaborate on initiatives that make recommended actions accessible to the business. Deliver and pitch your topic in the best possible manner with this Data And Analytics Playbook How To Bridge Business Intelligence And Predictive Graphics PDF. Use them to share invaluable insights on Probability By Package, Customer Information, Internet Data and impress your audience. This template can be altered and modified as per your expectations. So, grab it now.


