Average rating PowerPoint Presentation Templates and Google Slides
-
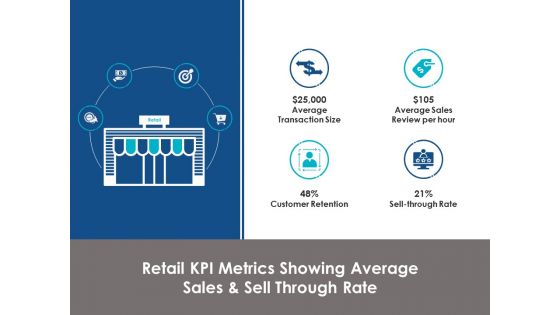
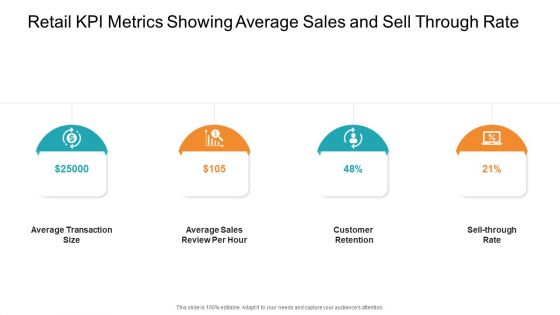
Retail Kpi Metrics Showing Average Sales And Sell Through Rate Average Transaction Size Ppt PowerPoint Presentation Icon Brochure
This is a retail kpi metrics showing average sales and sell through rate average transaction size ppt powerpoint presentation icon brochure. This is a four stage process. The stages in this process are icons, planning, strategy, analysis, marketing.
-
Average Response Rate Ppt PowerPoint Presentation Pictures Format
This is a average response rate ppt powerpoint presentation pictures format. This is a two stage process. The stages in this process are answered, unanswered, finance, business.
-
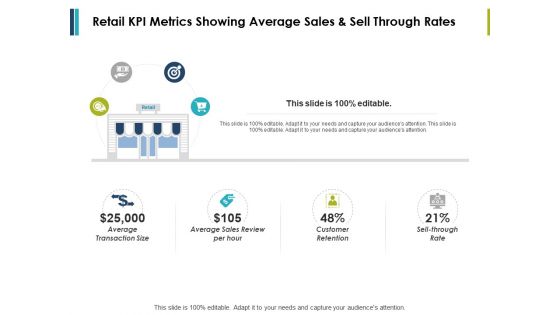
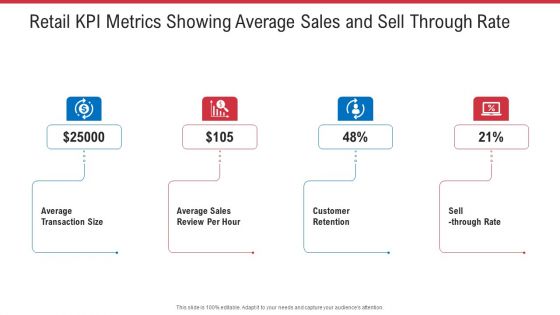
Retail Kpi Metrics Showing Average Sales And Sell Through Rate Ppt Powerpoint Presentation Styles Designs
This is a retail kpi metrics showing average sales and sell through rate ppt powerpoint presentation styles designs. This is a four stage process. The stages in this process are marketing, business, management, planning, strategy.
-
Retail Kpi Metrics Showing Average Sales And Sell Through Rates Ppt PowerPoint Presentation Ideas Influencers
This is a retail kpi metrics showing average sales and sell through rates ppt powerpoint presentation ideas influencers. This is a four stage process. The stages in this process are marketing, business, management, planning, strategy.
-
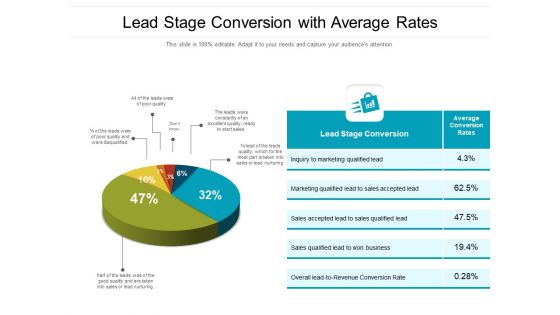
Lead Stage Conversion With Average Rates Ppt PowerPoint Presentation Gallery Diagrams PDF
Showcasing this set of slides titled lead stage conversion with average rates ppt powerpoint presentation gallery diagrams pdf. The topics addressed in these templates are marketing, business, revenue. All the content presented in this PPT design is completely editable. Download it and make adjustments in color, background, font etc. as per your unique business setting.
-
Average Small Business Growth Rate New Market Ppt PowerPoint Presentation Styles Show Cpb Pdf
Presenting this set of slides with name average small business growth rate new market ppt powerpoint presentation styles show cpb pdf. This is an editable Powerpoint five stages graphic that deals with topics like average small business growth rate new market to help convey your message better graphically. This product is a premium product available for immediate download and is 100 percent editable in Powerpoint. Download this now and use it in your presentations to impress your audience.
-
Monthly Average Fill Rate Analysis Chart Ppt PowerPoint Presentation Gallery Styles PDF
Presenting this set of slides with name monthly average fill rate analysis chart ppt powerpoint presentation gallery styles pdf. The topics discussed in these slides are actual, goal, team, customer order trend, plan, analysis team. This is a completely editable PowerPoint presentation and is available for immediate download. Download now and impress your audience.
-
Net Promoter Score Assessment With Average Response Rating Ppt PowerPoint Presentation Gallery Example PDF
Presenting this set of slides with name net promoter score assessment with average response rating ppt powerpoint presentation gallery example pdf. The topics discussed in these slide is net promoter score assessment with average response rating. This is a completely editable PowerPoint presentation and is available for immediate download. Download now and impress your audience.
-
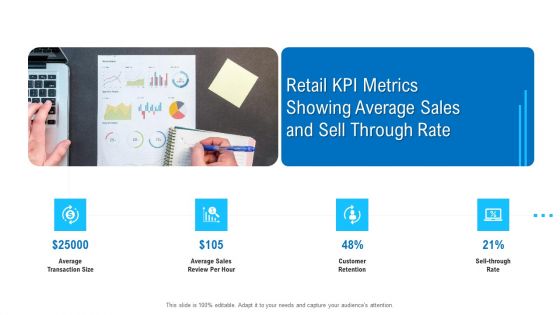
Retail KPI Metrics Showing Average Sales And Sell Through Rate Sample PDF
Presenting retail kpi metrics showing average sales and sell through rate sample pdf. to provide visual cues and insights. Share and navigate important information on four stages that need your due attention. This template can be used to pitch topics like average transaction size, average sales, review per hour, customer retention. In addtion, this PPT design contains high resolution images, graphics, etc, that are easily editable and available for immediate download.
-
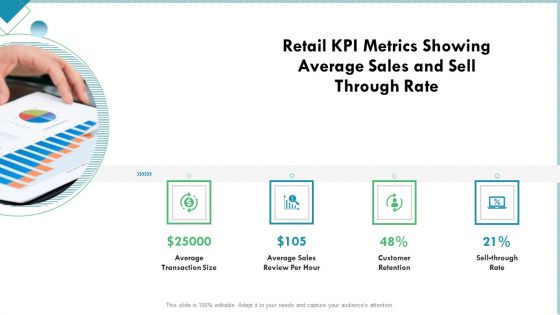
Retail KPI Metrics Showing Average Sales And Sell Through Rate Portrait PDF
This is a retail KPI metrics showing average sales and sell through rate portrait pdf. template with various stages. Focus and dispense information on four stages using this creative set, that comes with editable features. It contains large content boxes to add your information on topics like average transaction size, average sales review per hour, customer retention. You can also showcase facts, figures, and other relevant content using this PPT layout. Grab it now.
-
Retail KPI Metrics Showing Average Sales And Sell Through Rate Ppt Model Files PDF
This is a retail KPI metrics showing average sales and sell through rate ppt model files pdf. template with various stages. Focus and dispense information on four stages using this creative set, that comes with editable features. It contains large content boxes to add your information on topics like average transaction size, average sales review per hour, customer retention. You can also showcase facts, figures, and other relevant content using this PPT layout. Grab it now.
-
Retail KPI Metrics Showing Average Sales And Sell Through Rate Ppt Portfolio Skills PDF
This is a retail kpi metrics showing average sales and sell through rate ppt portfolio skills pdf. template with various stages. Focus and dispense information on four stages using this creative set, that comes with editable features. It contains large content boxes to add your information on topics like average transaction size, average sales review per hour. You can also showcase facts, figures, and other relevant content using this PPT layout. Grab it now.
-
Merchandising Industry Analysis Retail KPI Metrics Showing Average Sales And Sell Through Rate Clipart PDF
Presenting merchandising industry analysis retail kpi metrics showing average sales and sell through rate clipart pdf to provide visual cues and insights. Share and navigate important information on four stages that need your due attention. This template can be used to pitch topics like average transaction size, average sales review per hour, customer retention. In addtion, this PPT design contains high resolution images, graphics, etc, that are easily editable and available for immediate download.
-
Market Analysis Of Retail Sector Retail KPI Metrics Showing Average Sales And Sell Through Rate Clipart PDF
This is a market analysis of retail sector retail kpi metrics showing average sales and sell through rate clipart pdf template with various stages. Focus and dispense information on four stages using this creative set, that comes with editable features. It contains large content boxes to add your information on topics like average transaction size, average sales review per hour, customer retention, sell through rate. You can also showcase facts, figures, and other relevant content using this PPT layout. Grab it now.
-
Security Monitoring Dashboard With Malicious Requests And Average Latency Rate Introduction PDF
Deliver an awe inspiring pitch with this creative security monitoring dashboard with malicious requests and average latency rate introduction pdf bundle. Topics like security monitoring dashboard with malicious requests and average latency rate can be discussed with this completely editable template. It is available for immediate download depending on the needs and requirements of the user.
-
Security Monitoring Dashboard With Malicious Requests And Average Latency Rate Topics PDF
This graph or chart is linked to excel, and changes automatically based on data. Just left click on it and select Edit Data. Deliver an awe inspiring pitch with this creative security monitoring dashboard with malicious requests and average latency rate topics pdf bundle. Topics like slowest api endpoints, malicious requests, coffeehouse slo can be discussed with this completely editable template. It is available for immediate download depending on the needs and requirements of the user.
-
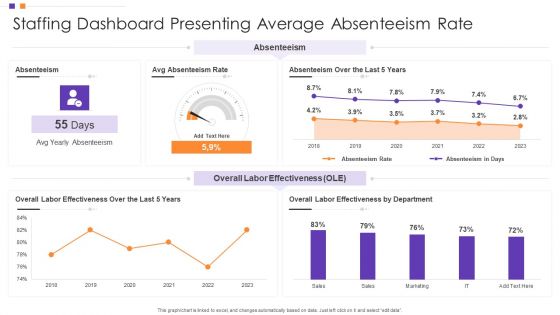
Staffing Dashboard Presenting Average Absenteeism Rate Inspiration PDF
Showcasing this set of slides titled Staffing Dashboard Presenting Average Absenteeism Rate Inspiration PDF The topics addressed in these templates are Absenteeism, Overall Labor Effectiveness, Department All the content presented in this PPT design is completely editable. Download it and make adjustments in color, background, font etc. as per your unique business setting.
-
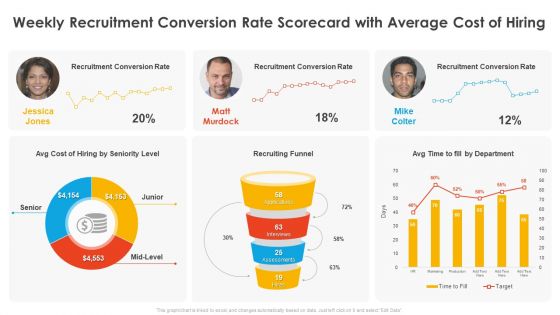
Weekly Recruitment Conversion Rate Scorecard With Average Cost Of Hiring Candidate Hiring Weekly Scorecard Introduction PDF
Deliver and pitch your topic in the best possible manner with this weekly recruitment conversion rate scorecard with average cost of hiring candidate hiring weekly scorecard introduction pdf. Use them to share invaluable insights on recruitment conversion rate, recruiting funnel, cost of hiring and impress your audience. This template can be altered and modified as per your expectations. So, grab it now.
-
Staff Turnover Ratio BSC Average Employee Turnover Rate Balanced Scorecard Based On Workforce Age Microsoft PDF
Deliver an awe inspiring pitch with this creative staff turnover ratio bsc average employee turnover rate balanced scorecard based on workforce age microsoft pdf bundle. Topics like average employee turnover rate balanced scorecard based on workforce age can be discussed with this completely editable template. It is available for immediate download depending on the needs and requirements of the user.
-
Employee Production Scorecard With Average Earning Wage Rate Diagrams PDF
Deliver an awe inspiring pitch with this creative Employee Production Scorecard With Average Earning Wage Rate Diagrams PDF bundle. Topics like Employee Production Scorecard, Average Earning, Wage Rate can be discussed with this completely editable template. It is available for immediate download depending on the needs and requirements of the user.
-
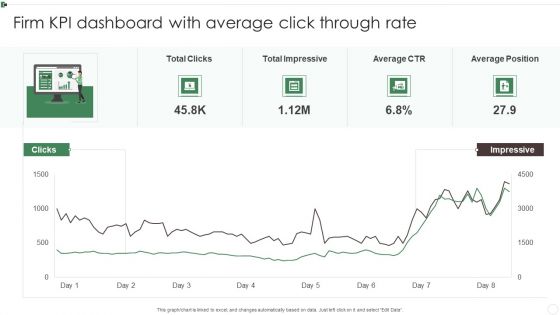
Firm KPI Dashboard With Average Click Through Rate Ppt Inspiration Sample PDF
This graph or chart is linked to excel, and changes automatically based on data. Just left click on it and select Edit Data. Pitch your topic with ease and precision using this Firm KPI Dashboard With Average Click Through Rate Ppt Inspiration Sample PDF. This layout presents information on Total Clicks, Total Impressive, Average CTR, Average Position. It is also available for immediate download and adjustment. So, changes can be made in the color, design, graphics or any other component to create a unique layout.
-
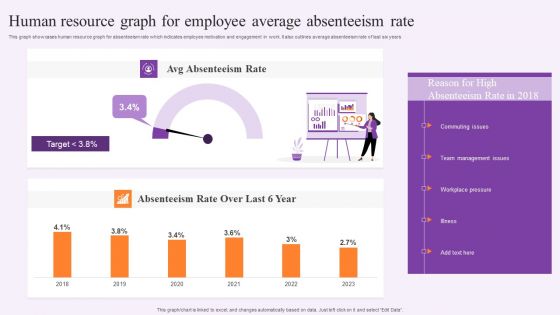
Human Resource Graph For Employee Average Absenteeism Rate Information PDF
This graph showcases human resource graph for absenteeism rate which indicates employee motivation and engagement in work. It also outlines average absenteeism rate of last six years. Showcasing this set of slides titled Human Resource Graph For Employee Average Absenteeism Rate Information PDF. The topics addressed in these templates are Team Management Issues, Workplace Pressure, Absenteeism Rate. All the content presented in this PPT design is completely editable. Download it and make adjustments in color, background, font etc. as per your unique business setting.
-
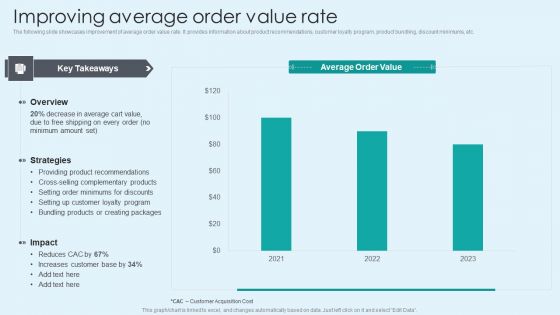
How Electronic Commerce Financial Procedure Can Be Enhanced Improving Average Order Value Rate Brochure PDF
The following slide showcases improvement of average order value rate. It provides information about product recommendations, customer loyalty program, product bundling, discount minimums, etc. From laying roadmaps to briefing everything in detail, our templates are perfect for you. You can set the stage with your presentation slides. All you have to do is download these easy-to-edit and customizable templates. How Electronic Commerce Financial Procedure Can Be Enhanced Improving Average Order Value Rate Brochure PDF will help you deliver an outstanding performance that everyone would remember and praise you for. Do download this presentation today.
-
Managing E Commerce Business Accounting Improving Average Order Value Rate Graphics PDF
The following slide showcases improvement of average order value rate. It provides information about product recommendations, customer loyalty program, product bundling, discount minimums, etc. If you are looking for a format to display your unique thoughts, then the professionally designed Managing E Commerce Business Accounting Improving Average Order Value Rate Graphics PDF is the one for you. You can use it as a Google Slides template or a PowerPoint template. Incorporate impressive visuals, symbols, images, and other charts. Modify or reorganize the text boxes as you desire. Experiment with shade schemes and font pairings. Alter, share or cooperate with other people on your work. Download Managing E Commerce Business Accounting Improving Average Order Value Rate Graphics PDF and find out how to give a successful presentation. Present a perfect display to your team and make your presentation unforgettable.
-
Improving Average Order Value Rate Slides PDF
The following slide showcases improvement of average order value rate. It provides information about product recommendations, customer loyalty program, product bundling, discount minimums, etc. Take your projects to the next level with our ultimate collection of Improving Average Order Value Rate Slides PDF. Slidegeeks has designed a range of layouts that are perfect for representing task or activity duration, keeping track of all your deadlines at a glance. Tailor these designs to your exact needs and give them a truly corporate look with your own brand colors they will make your projects stand out from the rest.
-
Improving Average Order Value Rate Financial Management Strategies Download PDF
The following slide showcases improvement of average order value rate. It provides information about product recommendations, customer loyalty program, product bundling, discount minimums, etc. Make sure to capture your audiences attention in your business displays with our gratis customizable Improving Average Order Value Rate Financial Management Strategies Download PDF. These are great for business strategies, office conferences, capital raising or task suggestions. If you desire to acquire more customers for your tech business and ensure they stay satisfied, create your own sales presentation with these plain slides.
-
Determining Employee Headcount Average Tenure And Turnover Rate Graphics PDF
Slidegeeks is one of the best resources for PowerPoint templates. You can download easily and regulate Determining Employee Headcount Average Tenure And Turnover Rate Graphics PDF for your personal presentations from our wonderful collection. A few clicks is all it takes to discover and get the most relevant and appropriate templates. Use our Templates to add a unique zing and appeal to your presentation and meetings. All the slides are easy to edit and you can use them even for advertisement purposes.
-
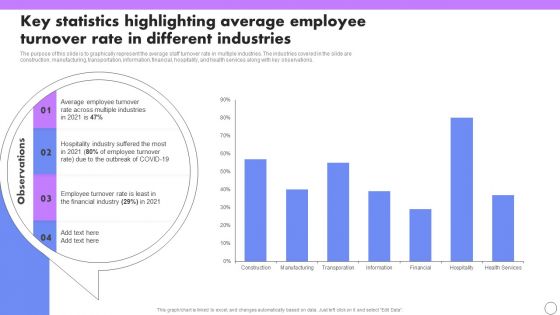
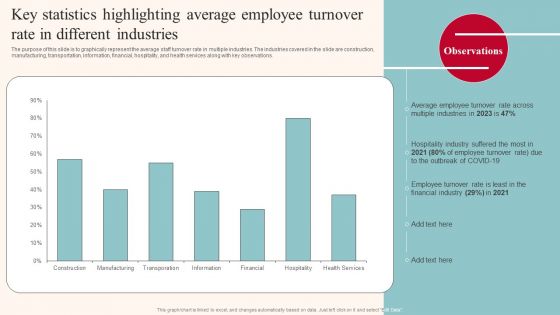
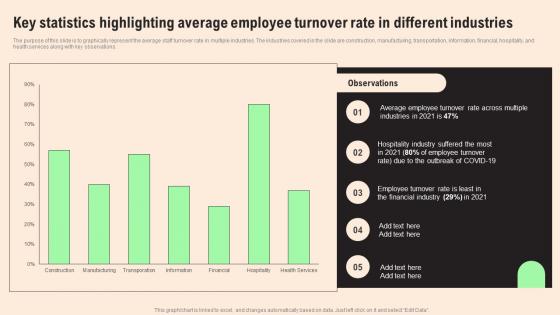
Key Statistics Highlighting Average Employee Turnover Rate In Different Industries Formats PDF
The purpose of this slide is to graphically represent the average staff turnover rate in multiple industries. The industries covered in the slide are construction, manufacturing, transportation, information, financial, hospitality, and health services along with key observations. Want to ace your presentation in front of a live audience Our Key Statistics Highlighting Average Employee Turnover Rate In Different Industries Formats PDF can help you do that by engaging all the users towards you. Slidegeeks experts have put their efforts and expertise into creating these impeccable powerpoint presentations so that you can communicate your ideas clearly. Moreover, all the templates are customizable, and easy-to-edit and downloadable. Use these for both personal and commercial use.
-
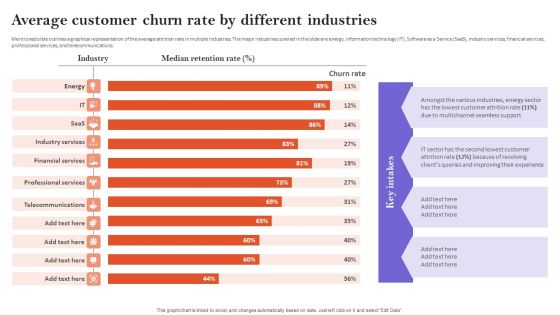
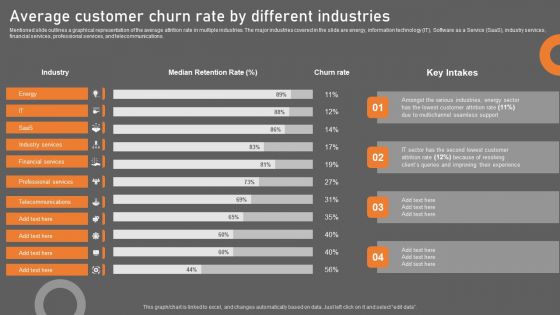
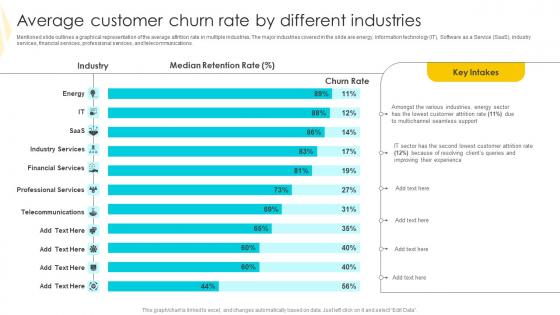
Average Customer Churn Rate By Different Industries Designs PDF
Mentioned slide outlines a graphical representation of the average attrition rate in multiple industries. The major industries covered in the slide are energy, information technology IT, Software as a Service SaaS, industry services, financial services, professional services, and telecommunications. Slidegeeks is one of the best resources for PowerPoint templates. You can download easily and regulate Average Customer Churn Rate By Different Industries Designs PDF for your personal presentations from our wonderful collection. A few clicks is all it takes to discover and get the most relevant and appropriate templates. Use our Templates to add a unique zing and appeal to your presentation and meetings. All the slides are easy to edit and you can use them even for advertisement purposes.
-
Coffee Cafe Company Profile Starbucks Product Price Comparison With Average Market Rate Introduction PDF
Mentioned slide provides insights into differences between Starbucks product pricing with average industry prices. It includes products such as cappuccino, Frappuccino, iced chai tea latte, hot chocolate, iced coffee, etc. Do you know about Slidesgeeks Coffee Cafe Company Profile Starbucks Product Price Comparison With Average Market Rate Introduction PDF. These are perfect for delivering any kind od presentation. Using it, create PowerPoint presentations that communicate your ideas and engage audiences. Save time and effort by using our pre designed presentation templates that are perfect for a wide range of topic. Our vast selection of designs covers a range of styles, from creative to business, and are all highly customizable and easy to edit. Download as a PowerPoint template or use them as Google Slides themes.
-
Effective Strategies For Retaining Healthcare Staff Key Statistics Highlighting Average Employee Turnover Rate Brochure PDF
The purpose of this slide is to graphically represent the average staff turnover rate in multiple industries. The industries covered in the slide are construction, manufacturing, transportation, information, financial, hospitality, and health services along with key observations. Want to ace your presentation in front of a live audience Our Effective Strategies For Retaining Healthcare Staff Key Statistics Highlighting Average Employee Turnover Rate Brochure PDF can help you do that by engaging all the users towards you. Slidegeeks experts have put their efforts and expertise into creating these impeccable powerpoint presentations so that you can communicate your ideas clearly. Moreover, all the templates are customizable, and easy to edit and downloadable. Use these for both personal and commercial use.
-
Key Statistics Highlighting Average Employee Turnover Rate In Different Industries Template PDF
The purpose of this slide is to graphically represent the average staff turnover rate in multiple industries. The industries covered in the slide are construction, manufacturing, transportation, information, financial, hospitality, and health services along with key observations. Here you can discover an assortment of the finest PowerPoint and Google Slides templates. With these templates, you can create presentations for a variety of purposes while simultaneously providing your audience with an eye catching visual experience. Download Key Statistics Highlighting Average Employee Turnover Rate In Different Industries Template PDF to deliver an impeccable presentation. These templates will make your job of preparing presentations much quicker, yet still, maintain a high level of quality. Slidegeeks has experienced researchers who prepare these templates and write high quality content for you. Later on, you can personalize the content by editing the Key Statistics Highlighting Average Employee Turnover Rate In Different Industries Template PDF.
-
Average Customer Churn Rate By Different Industries Ppt PowerPoint Presentation File Example PDF
Mentioned slide outlines a graphical representation of the average attrition rate in multiple industries. The major industries covered in the slide are energy, information technology IT, Software as a Service SaaS, industry services, financial services, professional services, and telecommunications. Whether you have daily or monthly meetings, a brilliant presentation is necessary. Average Customer Churn Rate By Different Industries Ppt PowerPoint Presentation File Example PDF can be your best option for delivering a presentation. Represent everything in detail using Average Customer Churn Rate By Different Industries Ppt PowerPoint Presentation File Example PDF and make yourself stand out in meetings. The template is versatile and follows a structure that will cater to your requirements. All the templates prepared by Slidegeeks are easy to download and edit. Our research experts have taken care of the corporate themes as well. So, give it a try and see the results.
-
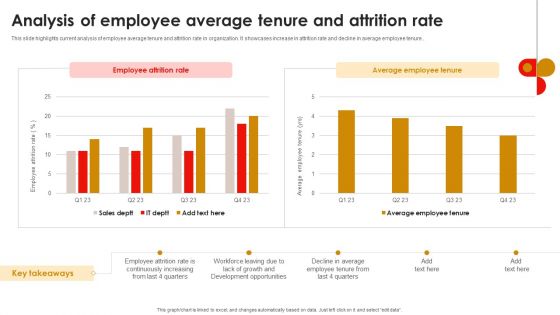
Strategic Talent Development Analysis Of Employee Average Tenure And Attrition Rate Download PDF
This slide highlights current analysis of employee average tenure and attrition rate in organization. It showcases increase in attrition rate and decline in average employee tenure. Slidegeeks is one of the best resources for PowerPoint templates. You can download easily and regulate Strategic Talent Development Analysis Of Employee Average Tenure And Attrition Rate Download PDF for your personal presentations from our wonderful collection. A few clicks is all it takes to discover and get the most relevant and appropriate templates. Use our Templates to add a unique zing and appeal to your presentation and meetings. All the slides are easy to edit and you can use them even for advertisement purposes.
-
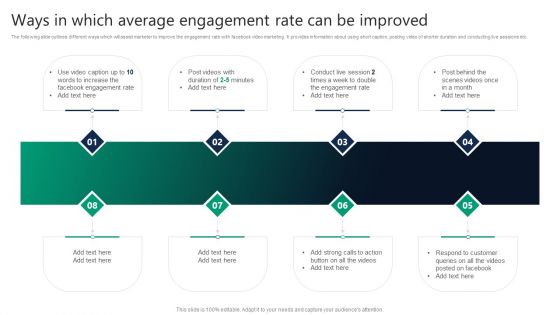
Ways In Which Average Engagement Rate Can Be Improved Background PDF
The following slide outlines different ways which will assist marketer to improve the engagement rate with Facebook video marketing. It provides information about using short caption, posting video of shorter duration and conducting live sessions etc.Presenting Ways In Which Average Engagement Rate Can Be Improved Background PDF to provide visual cues and insights. Share and navigate important information on one stage that need your due attention. This template can be used to pitch topics like Respond To Customer, Engagement Rate, Action Button. In addtion, this PPT design contains high resolution images, graphics, etc, that are easily editable and available for immediate download.
-
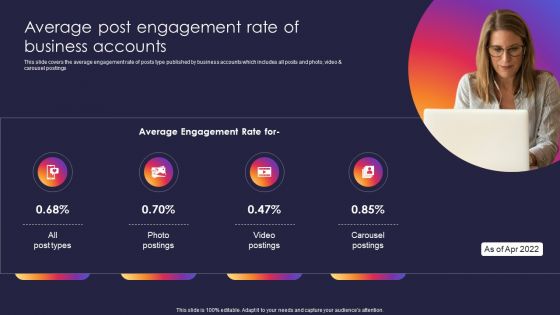
Instagram Company Details Average Post Engagement Rate Of Business Accounts Diagrams PDF
This slide covers the average engagement rate of posts type published by business accounts which includes all posts and photo, video and carousel postings. Presenting Instagram Company Details Average Post Engagement Rate Of Business Accounts Diagrams PDF to provide visual cues and insights. Share and navigate important information on four stages that need your due attention. This template can be used to pitch topics like Average Post Engagement Rate, Business Accounts. In addtion, this PPT design contains high resolution images, graphics, etc, that are easily editable and available for immediate download.
-
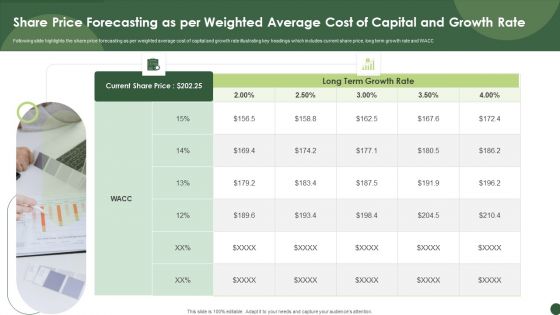
Share Price Forecasting As Per Weighted Average Cost Of Capital And Growth Rate Template PDF
Following slide highlights the share price forecasting as per weighted average cost of capital and growth rate illustrating key headings which includes current share price, long term growth rate and WACC.Showcasing this set of slides titled Share Price Forecasting As Per Weighted Average Cost Of Capital And Growth Rate Template PDF. The topics addressed in these templates are Share Price Forecasting, Per Weighted Average Cost, Capital Growth Rate. All the content presented in this PPT design is completely editable. Download it and make adjustments in color, background, font etc. as per your unique business setting.
-
Formulating Video Marketing Strategies To Enhance Sales Ways In Which Average Engagement Rate Can Be Improved Formats PDF
The following slide outlines different ways which will assist marketer to improve the engagement rate with facebook video marketing. It provides information about using short caption, posting video of shorter duration and conducting live sessions etc. Explore a selection of the finest Formulating Video Marketing Strategies To Enhance Sales Ways In Which Average Engagement Rate Can Be Improved Formats PDF here. With a plethora of professionally designed and pre made slide templates, you can quickly and easily find the right one for your upcoming presentation. You can use our Formulating Video Marketing Strategies To Enhance Sales Ways In Which Average Engagement Rate Can Be Improved Formats PDF to effectively convey your message to a wider audience. Slidegeeks has done a lot of research before preparing these presentation templates. The content can be personalized and the slides are highly editable. Grab templates today from Slidegeeks.
-
Video Promotion Techniques Ways In Which Average Engagement Rate Can Be Improved Slides PDF
The following slide outlines different ways which will assist marketer to improve the engagement rate with Facebook video marketing. It provides information about using short caption, posting video of shorter duration and conducting live sessions etc. Do you have to make sure that everyone on your team knows about any specific topic I yes, then you should give Video Promotion Techniques Ways In Which Average Engagement Rate Can Be Improved Slides PDF a try. Our experts have put a lot of knowledge and effort into creating this impeccable Video Promotion Techniques Ways In Which Average Engagement Rate Can Be Improved Slides PDF. You can use this template for your upcoming presentations, as the slides are perfect to represent even the tiniest detail. You can download these templates from the Slidegeeks website and these are easy to edit. So grab these today.
-
Executing Video Promotional Ways In Which Average Engagement Rate Can Be Improved Topics PDF
The following slide outlines different ways which will assist marketer to improve the engagement rate with Facebook video marketing. It provides information about using short caption, posting video of shorter duration and conducting live sessions etc. Want to ace your presentation in front of a live audience Our Executing Video Promotional Ways In Which Average Engagement Rate Can Be Improved Topics PDF can help you do that by engaging all the users towards you. Slidegeeks experts have put their efforts and expertise into creating these impeccable powerpoint presentations so that you can communicate your ideas clearly. Moreover, all the templates are customizable, and easy-to-edit and downloadable. Use these for both personal and commercial use.
-
Ways In Which Average Engagement Rate Can Be Improved Mockup PDF
The following slide outlines different ways which will assist marketer to improve the engagement rate with Facebook video marketing. It provides information about using short caption, posting video of shorter duration and conducting live sessions etc. If your project calls for a presentation, then Slidegeeks is your go to partner because we have professionally designed, easy to edit templates that are perfect for any presentation. After downloading, you can easily edit Ways In Which Average Engagement Rate Can Be Improved Mockup PDF and make the changes accordingly. You can rearrange slides or fill them with different images. Check out all the handy templates.
-
Ways In Which Average Engagement Rate Can Be Improved Formats PDF
The following slide outlines different ways which will assist marketer to improve the engagement rate with Facebook video marketing. It provides information about using short caption, posting video of shorter duration and conducting live sessions etc. Slidegeeks has constructed Ways In Which Average Engagement Rate Can Be Improved Formats PDF after conducting extensive research and examination. These presentation templates are constantly being generated and modified based on user preferences and critiques from editors. Here, you will find the most attractive templates for a range of purposes while taking into account ratings and remarks from users regarding the content. This is an excellent jumping off point to explore our content and will give new users an insight into our top notch PowerPoint Templates.
-
Average Post Engagement Rate Of Business Accounts Formats PDF
This slide covers the average engagement rate of posts type published by business accounts which includes all posts and photo, video and carousel postings. Find a pre designed and impeccable Average Post Engagement Rate Of Business Accounts Formats PDF. The templates can ace your presentation without additional effort. You can download these easy to edit presentation templates to make your presentation stand out from others. So, what are you waiting for Download the template from Slidegeeks today and give a unique touch to your presentation.
-
Ways In Which Average Engagement Rate Can Be Improved Graphics PDF
The following slide outlines different ways which will assist marketer to improve the engagement rate with Facebook video marketing. It provides information about using short caption, posting video of shorter duration and conducting live sessions etc. Slidegeeks is here to make your presentations a breeze with Ways In Which Average Engagement Rate Can Be Improved Graphics PDF With our easy to use and customizable templates, you can focus on delivering your ideas rather than worrying about formatting. With a variety of designs to choose from, you are sure to find one that suits your needs. And with animations and unique photos, illustrations, and fonts, you can make your presentation pop. So whether you are giving a sales pitch or presenting to the board, make sure to check out Slidegeeks first.
-
Key Statistics Highlighting Average Employee Turnover Rate In Different Industries Infographics PDF
The purpose of this slide is to graphically represent the average staff turnover rate in multiple industries. The industries covered in the slide are construction, manufacturing, transportation, information, financial, hospitality, and health services along with key observations. Want to ace your presentation in front of a live audience Our Key Statistics Highlighting Average Employee Turnover Rate In Different Industries Infographics PDF can help you do that by engaging all the users towards you. Slidegeeks experts have put their efforts and expertise into creating these impeccable powerpoint presentations so that you can communicate your ideas clearly. Moreover, all the templates are customizable, and easy to edit and downloadable. Use these for both personal and commercial use.
-
Average Customer Churn Rate By Different Industries Diagrams PDF
Mentioned slide outlines a graphical representation of the average attrition rate in multiple industries. The major industries covered in the slide are energy, information technology IT, Software as a Service SaaS, industry services, financial services, professional services, and telecommunications. Presenting this PowerPoint presentation, titled Average Customer Churn Rate By Different Industries Diagrams PDF, with topics curated by our researchers after extensive research. This editable presentation is available for immediate download and provides attractive features when used. Download now and captivate your audience. Presenting this Average Customer Churn Rate By Different Industries Diagrams PDF. Our researchers have carefully researched and created these slides with all aspects taken into consideration. This is a completely customizable Average Customer Churn Rate By Different Industries Diagrams PDF that is available for immediate downloading. Download now and make an impact on your audience. Highlight the attractive features available with our PPTs.
-
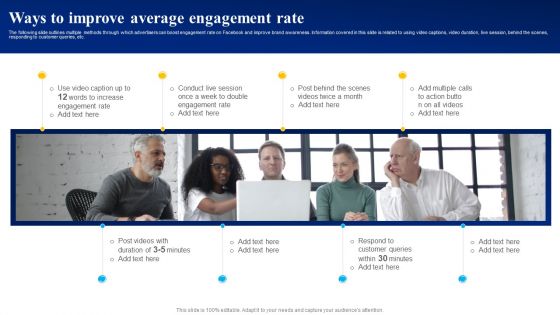
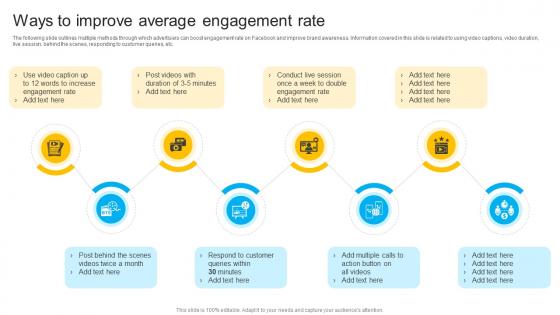
Ways To Improve Average Engagement Rate Ppt PowerPoint Presentation File Background Images PDF
The following slide outlines multiple methods through which advertisers can boost engagement rate on Facebook and improve brand awareness. Information covered in this slide is related to using video captions, video duration, live session, behind the scenes, responding to customer queries, etc. If your project calls for a presentation, then Slidegeeks is your go to partner because we have professionally designed, easy to edit templates that are perfect for any presentation. After downloading, you can easily edit Ways To Improve Average Engagement Rate Ppt PowerPoint Presentation File Background Images PDF and make the changes accordingly. You can rearrange slides or fill them with different images. Check out all the handy templates.
-
Key Statistics Highlighting Average Employee Turnover Rate In Different Industries Diagrams Pdf
The purpose of this slide is to graphically represent the average staff turnover rate in multiple industries. The industries covered in the slide are construction, manufacturing, transportation, information, financial, hospitality, and health services along with key observations. Boost your pitch with our creative Key Statistics Highlighting Average Employee Turnover Rate In Different Industries Diagrams Pdf. Deliver an awe inspiring pitch that will mesmerize everyone. Using these presentation templates you will surely catch everyones attention. You can browse the ppts collection on our website. We have researchers who are experts at creating the right content for the templates. So you do not have to invest time in any additional work. Just grab the template now and use them.
-
Implementing Strategies To Enhance Average Customer Churn Rate By Different Industries Icons PDF
Mentioned slide outlines a graphical representation of the average attrition rate in multiple industries. The major industries covered in the slide are energy, information technology IT, Software as a Service SaaS, industry services, financial services, professional services, and telecommunications. Get a simple yet stunning designed Implementing Strategies To Enhance Average Customer Churn Rate By Different Industries Icons PDF It is the best one to establish the tone in your meetings. It is an excellent way to make your presentations highly effective. So, download this PPT today from Slidegeeks and see the positive impacts. Our easy-to-edit Implementing Strategies To Enhance Average Customer Churn Rate By Different Industries Icons PDF can be your go-to option for all upcoming conferences and meetings. So, what are you waiting for Grab this template today.
-
Average Customer Churn Rate By Strategies To Mitigate Customer Churn Background Pdf
Mentioned slide outlines a graphical representation of the average attrition rate in multiple industries. The major industries covered in the slide are energy, information technology IT, Software as a Service SaaS, industry services, financial services, professional services, and telecommunications. Slidegeeks is one of the best resources for PowerPoint templates. You can download easily and regulate Average Customer Churn Rate By Strategies To Mitigate Customer Churn Background Pdf for your personal presentations from our wonderful collection. A few clicks is all it takes to discover and get the most relevant and appropriate templates. Use our Templates to add a unique zing and appeal to your presentation and meetings. All the slides are easy to edit and you can use them even for advertisement purposes.
-
Average Active Heart Rate In Powerpoint And Google Slides Cpb
Presenting our innovatively-designed set of slides titled Average Active Heart Rate In Powerpoint And Google Slides Cpb. This completely editable PowerPoint graphic exhibits Average Active Heart Rate that will help you convey the message impactfully. It can be accessed with Google Slides and is available in both standard screen and widescreen aspect ratios. Apart from this, you can download this well-structured PowerPoint template design in different formats like PDF, JPG, and PNG. So, click the download button now to gain full access to this PPT design.
-
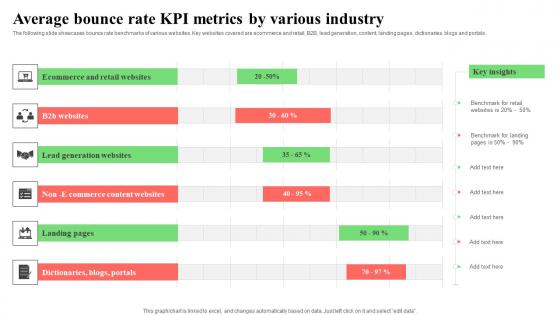
Average Bounce Rate KPI Metrics By Various Industry Information Pdf
The following slide showcases bounce rate benchmarks of various websites. Key websites covered are ecommerce and retail, B2B, lead generation, content, landing pages, dictionaries, blogs and portals. Showcasing this set of slides titled Average Bounce Rate KPI Metrics By Various Industry Information Pdf. The topics addressed in these templates are Content, Landing Pages, Dictionaries. All the content presented in this PPT design is completely editable. Download it and make adjustments in color, background, font etc. as per your unique business setting.
-
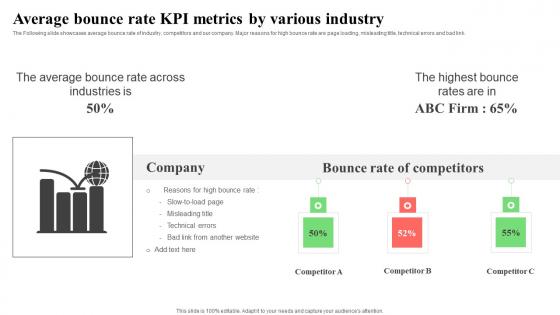
Average Bounce Rate KPI Metrics By Various Industrys Inspiration Pdf
The Following slide showcases average bounce rate of industry, competitors and our company. Major reasons for high bounce rate are page loading, misleading title, technical errors and bad link. Pitch your topic with ease and precision using this Average Bounce Rate KPI Metrics By Various Industrys Inspiration Pdf. This layout presents information on Page Loading, Misleading Title, Technical Errors. It is also available for immediate download and adjustment. So, changes can be made in the color, design, graphics or any other component to create a unique layout.
-
Average Bounce Rate Metrics By Various Industry Mockup Pdf
The following slide Showcases the average bounce rate according to industries. Major factors covered are retail sites, portals, service and content websites and lead generation. Showcasing this set of slides titled Average Bounce Rate Metrics By Various Industry Mockup Pdf. The topics addressed in these templates are Portals, Service,Content Websites. All the content presented in this PPT design is completely editable. Download it and make adjustments in color, background, font etc. as per your unique business setting.
-
Bounce Rate KPI Tracking Dashboard With Average Pages And Time Inspiration Pdf
The following slide showcases dashboard that helps to identify the average time spent on page by visitors and the bounce rate. It also includes page load time, bounce rate by browser and details on internet explorer. Pitch your topic with ease and precision using this Bounce Rate KPI Tracking Dashboard With Average Pages And Time Inspiration Pdf. This layout presents information on Page Load Time, Bounce Rate, Internet Explorer. It is also available for immediate download and adjustment. So, changes can be made in the color, design, graphics or any other component to create a unique layout.
-
Business Development Team Decline In Monthly Win Rate And Average Deal Size SA SS V
This slide highlights the monthly win rate by the number of deals closed opportunities along with the win rate by an amount that helps the business to analyze its current business strategy. Are you in need of a template that can accommodate all of your creative concepts This one is crafted professionally and can be altered to fit any style. Use it with Google Slides or PowerPoint. Include striking photographs, symbols, depictions, and other visuals. Fill, move around, or remove text boxes as desired. Test out color palettes and font mixtures. Edit and save your work, or work with colleagues. Download Business Development Team Decline In Monthly Win Rate And Average Deal Size SA SS V and observe how to make your presentation outstanding. Give an impeccable presentation to your group and make your presentation unforgettable.
-
A35 Facebook Marketing Plan Ways To Improve Average Engagement Rate Strategy SS V
The following slide outlines multiple methods through which advertisers can boost engagement rate on Facebook and improve brand awareness. Information covered in this slide is related to using video captions, video duration, live session, behind the scenes, responding to customer queries, etc. Boost your pitch with our creative A35 Facebook Marketing Plan Ways To Improve Average Engagement Rate Strategy SS V. Deliver an awe-inspiring pitch that will mesmerize everyone. Using these presentation templates you will surely catch everyones attention. You can browse the ppts collection on our website. We have researchers who are experts at creating the right content for the templates. So you do not have to invest time in any additional work. Just grab the template now and use them.
-
How To Create Cost Effective Ways To Improve Average Engagement Rate Strategy SS V
The following slide outlines multiple methods through which advertisers can boost engagement rate on Facebook and improve brand awareness. Information covered in this slide is related to using video captions, video duration, live session, behind the scenes, responding to customer queries, etc. Crafting an eye-catching presentation has never been more straightforward. Let your presentation shine with this tasteful yet straightforward How To Create Cost Effective Ways To Improve Average Engagement Rate Strategy SS V template. It offers a minimalistic and classy look that is great for making a statement. The colors have been employed intelligently to add a bit of playfulness while still remaining professional. Construct the ideal How To Create Cost Effective Ways To Improve Average Engagement Rate Strategy SS V that effortlessly grabs the attention of your audience Begin now and be certain to wow your customers
-
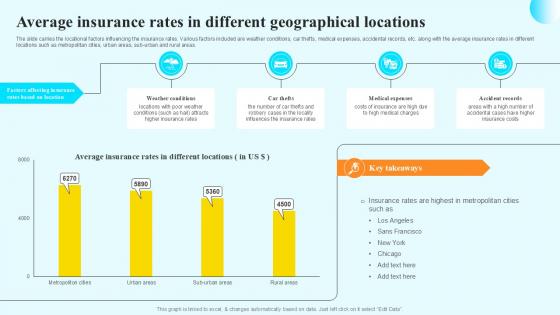
Average Insurance Rates In Different Steps By Step Guide For Claiming Car PPT Example
The slide carries the locational factors influencing the insurance rates. Various factors included are weather conditions, car thefts, medical expenses, accidental records, etc. along with the average insurance rates in different locations such as metropolitan cities, urban areas, sub-urban and rural areas. Get a simple yet stunning designed Average Insurance Rates In Different Steps By Step Guide For Claiming Car PPT Example. It is the best one to establish the tone in your meetings. It is an excellent way to make your presentations highly effective. So, download this PPT today from Slidegeeks and see the positive impacts. Our easy-to-edit Average Insurance Rates In Different Steps By Step Guide For Claiming Car PPT Example can be your go-to option for all upcoming conferences and meetings. So, what are you waiting for Grab this template today.
-
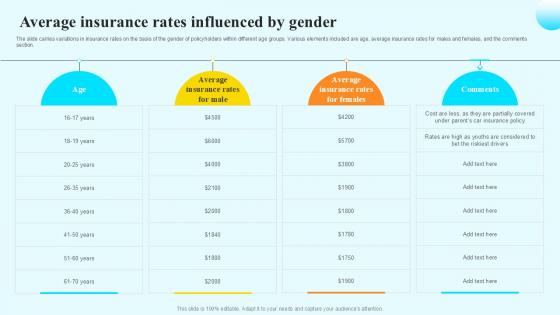
Average Insurance Rates Influenced Steps By Step Guide For Claiming Car PPT Slide
The slide carries variations in insurance rates on the basis of the gender of policyholders within different age groups. Various elements included are age, average insurance rates for males and females, and the comments section. From laying roadmaps to briefing everything in detail, our templates are perfect for you. You can set the stage with your presentation slides. All you have to do is download these easy-to-edit and customizable templates. Average Insurance Rates Influenced Steps By Step Guide For Claiming Car PPT Slide will help you deliver an outstanding performance that everyone would remember and praise you for. Do download this presentation today.


