Annual Variance PowerPoint Presentation Templates and Google Slides
-
Bar Chart With Percentage Representing Annual Variance Ppt PowerPoint Presentation Gallery Portfolio PDF
Pitch your topic with ease and precision using this bar chart with percentage representing annual variance ppt powerpoint presentation gallery portfolio pdf. This layout presents information on bar chart with percentage representing annual variance. It is also available for immediate download and adjustment. So, changes can be made in the color, design, graphics or any other component to create a unique layout.
-
Annual Timeline Roadmap Infographic In Variance Of Portfolio Ppt PowerPoint Presentation Icon Model PDF
Persuade your audience using this annual timeline roadmap infographic in variance of portfolio ppt powerpoint presentation icon model pdf. This PPT design covers twelve stages, thus making it a great tool to use. It also caters to a variety of topics including annual timeline roadmap infographic in variance of portfolio. Download this PPT design now to present a convincing pitch that not only emphasizes the topic but also showcases your presentation skills.
-
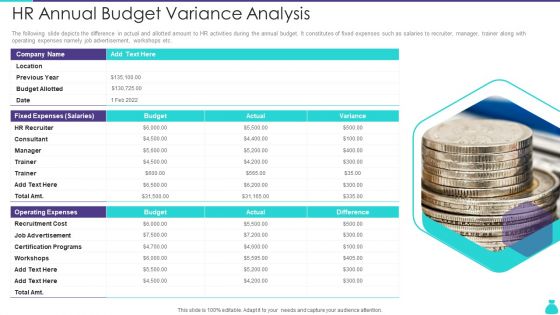
HR Annual Budget Variance Analysis Ppt PowerPoint Presentation Gallery Show PDF
The following slide depicts the difference in actual and allotted amount to HR activities during the annual budget. It constitutes of fixed expenses such as salaries to recruiter, manager, trainer along with operating expenses namely job advertisement, workshops etc. Persuade your audience using this HR Annual Budget Variance Analysis Ppt PowerPoint Presentation Gallery Show PDF. This PPT design covers one stages, thus making it a great tool to use. It also caters to a variety of topics including HR Recruiter, Operating Expenses, Recruitment Cost. Download this PPT design now to present a convincing pitch that not only emphasizes the topic but also showcases your presentation skills.
-
Business Operational Expenditure Bar Graph With Annual Variances Brochure PDF
This slide showcases operating expenditure OPEX bar graph with annual variances assisting companies in controlling the difference of allocated budgets. It also includes information about planned expenses, actual expenses, marketing costs, office costs, employee costs, training, etc. Showcasing this set of slides titled Business Operational Expenditure Bar Graph With Annual Variances Brochure PDF. The topics addressed in these templates are Employee Costs, Planned Expenses, Training Costs. All the content presented in this PPT design is completely editable. Download it and make adjustments in color, background, font etc. as per your unique business setting.
-
Construction Company Income And Expenses Annual Report With Variance Introduction PDF
This slide showcases annual report that can help construction company to identify the income generated and expenses incurred in last financial year. It also outlines variance between actual and predicted income plus expenses Pitch your topic with ease and precision using this Construction Company Income And Expenses Annual Report With Variance Introduction PDF. This layout presents information on Equipment Rental, Raw Material, Renovation Projects. It is also available for immediate download and adjustment. So, changes can be made in the color, design, graphics or any other component to create a unique layout.
-
Annual Planned And Actual Enterprise Budget Showing Variance Infographics PDF
This slide shows the annual budget of an organization representing the variance between the actual and planned budget. It includes division on the basis of sales by model, cost of goods sold and sales, general and administrative costs. Pitch your topic with ease and precision using this Annual Planned And Actual Enterprise Budget Showing Variance Infographics PDF. This layout presents information on Cost Of Goods Sold, Sales By Model, Administrative Costs. It is also available for immediate download and adjustment. So, changes can be made in the color, design, graphics or any other component to create a unique layout.


