Analytics and visualizations PowerPoint Presentation Templates and Google Slides
-
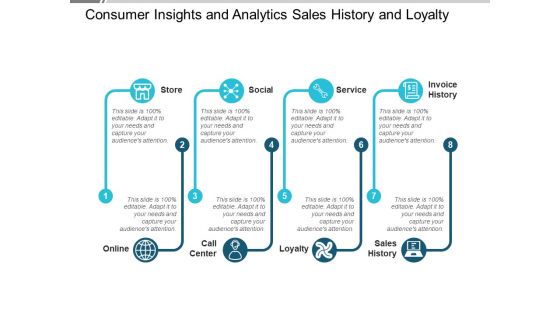
Consumer Insights And Analytics Sales History And Loyalty Ppt PowerPoint Presentation Visual Aids Ideas
This is a consumer insights and analytics sales history and loyalty ppt powerpoint presentation visual aids ideas. This is a eight stage process. The stages in this process are customer experience, customer insight, consumer insight.
-
Timeframe For Site Analytic And Audit Proposal Template Ppt Infographic Template Visuals PDF
Deliver an awe inspiring pitch with this creative timeframe for site analytic and audit proposal template ppt infographic template visuals pdf bundle. Topics like discovery or kick off meeting, research and audit, present strategy can be discussed with this completely editable template. It is available for immediate download depending on the needs and requirements of the user.
-
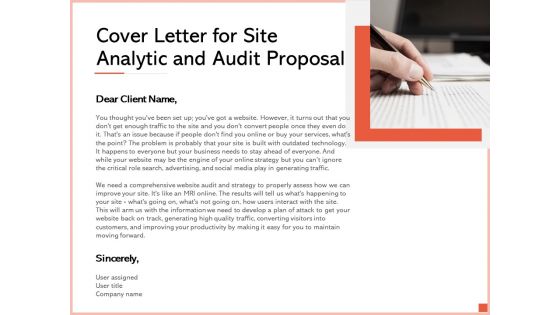
Cover Letter For Site Analytic And Audit Proposal Ppt Slides Visual Aids PDF
Presenting cover letter for site analytic and audit proposal ppt slides visual aids pdf to provide visual cues and insights. Share and navigate important information on one stages that need your due attention. This template can be used to pitch topics like cover letter. In addtion, this PPT design contains high resolution images, graphics, etc, that are easily editable and available for immediate download.
-
Data Analytics IT Tasks And Skills Of Machine Learning Engineer Ppt Gallery Visual Aids PDF
This slide represents the machine learning engineers tasks and skills, including a deep knowledge of machine learning, ML algorithms, and Python and C. This is a data analytics it tasks and skills of machine learning engineer ppt gallery visual aids pdf template with various stages. Focus and dispense information on six stages using this creative set, that comes with editable features. It contains large content boxes to add your information on topics like knowledge of machine learning, python, c plus, ml algorithms. You can also showcase facts, figures, and other relevant content using this PPT layout. Grab it now.
-
Data Analytics Tasks And Skills Of Database Administrator Ppt Visual Aids PDF
This slide depicts the tasks performed by a Database Administrator and skills that he should possess, such as backup and recovery, data modeling and design, and distributive computing. Presenting data analytics tasks and skills of database administrator ppt visual aids pdf to provide visual cues and insights. Share and navigate important information on six stages that need your due attention. This template can be used to pitch topics like data security, database systems, distributive computing, information. In addtion, this PPT design contains high resolution images, graphics, etc, that are easily editable and available for immediate download.
-
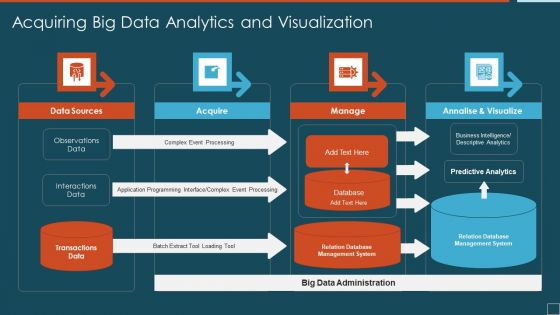
Acquiring Big Data Analytics And Visualization Ideas PDF
Presenting acquiring big data analytics and visualization ideas pdf to dispense important information. This template comprises four stages. It also presents valuable insights into the topics including data sources, acquire, manage. This is a completely customizable PowerPoint theme that can be put to use immediately. So, download it and address the topic impactfully.
-
Information Visualizations Playbook Business Intelligence And Predictive Analytics Challenges Icons PDF
This template covers the problems while implementing BI and predictive analytics in the organization. The challenges are undefined KPIs and metrics, and unable to hire right data science talent. Presenting Information Visualizations Playbook Business Intelligence And Predictive Analytics Challenges Icons PDF to provide visual cues and insights. Share and navigate important information on two stages that need your due attention. This template can be used to pitch topics like Raw Data Organized, Security Vulnerabilities, Perform Analysis. In addtion, this PPT design contains high resolution images, graphics, etc, that are easily editable and available for immediate download.
-
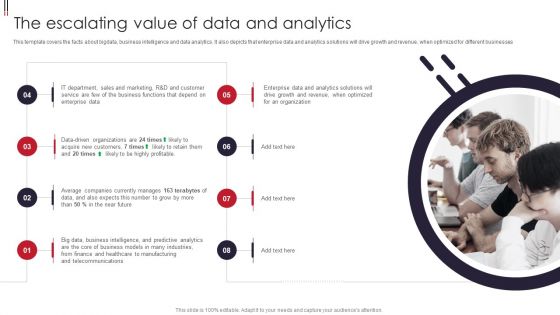
Information Visualizations Playbook The Escalating Value Of Data And Analytics Portrait PDF
This template covers the facts about bigdata, business intelligence and data analytics. It also depicts that enterprise data and analytics solutions will drive growth and revenue, when optimized for different businesses. This is a Information Visualizations Playbook The Escalating Value Of Data And Analytics Portrait PDF template with various stages. Focus and dispense information on eight stages using this creative set, that comes with editable features. It contains large content boxes to add your information on topics like Data Driven Organizations, Acquire New Customers, Profitable. You can also showcase facts, figures, and other relevant content using this PPT layout. Grab it now.
-
Data And Information Visualization Visual Analytics Branch Of Visualization Research Designs PDF
This slide shows visual analytics, the last branch of visualization research, which emerged from the advancements in the other two branches and mainly focused on analytical reasoning. Make sure to capture your audiences attention in your business displays with our gratis customizable Data And Information Visualization Visual Analytics Branch Of Visualization Research Designs PDF. These are great for business strategies, office conferences, capital raising or task suggestions. If you desire to acquire more customers for your tech business and ensure they stay satisfied, create your own sales presentation with these plain slides.
-
Branches For Visual Analytics Branch Of Visualization Research And Development Slides PDF
This slide shows visual analytics, the last branch of visualization research, which emerged from the advancements in the other two branches and mainly focused on analytical reasoning. Want to ace your presentation in front of a live audience Our Branches For Visual Analytics Branch Of Visualization Research And Development Slides PDF can help you do that by engaging all the users towards you. Slidegeeks experts have put their efforts and expertise into creating these impeccable powerpoint presentations so that you can communicate your ideas clearly. Moreover, all the templates are customizable, and easy-to-edit and downloadable. Use these for both personal and commercial use.
-
Statistical Tools For Evidence Dashboard For Data Visualization And Analytics
This slide represents the dashboard to track statistical data analysis process. The purpose of this slide is to provide a graphical representation of total sessions, bounce rate, goal completions, goal completion rate, top channels over time, etc. Are you in need of a template that can accommodate all of your creative concepts This one is crafted professionally and can be altered to fit any style. Use it with Google Slides or PowerPoint. Include striking photographs, symbols, depictions, and other visuals. Fill, move around, or remove text boxes as desired. Test out color palettes and font mixtures. Edit and save your work, or work with colleagues. Download Statistical Tools For Evidence Dashboard For Data Visualization And Analytics and observe how to make your presentation outstanding. Give an impeccable presentation to your group and make your presentation unforgettable.


