7 stage pyramid graphics for experimental design statistics PowerPoint Presentation Templates and Google Slides
-
7 Stage Pyramid Graphics For Experimental Design Statistics Ppt PowerPoint Presentation File Graphics Template PDF
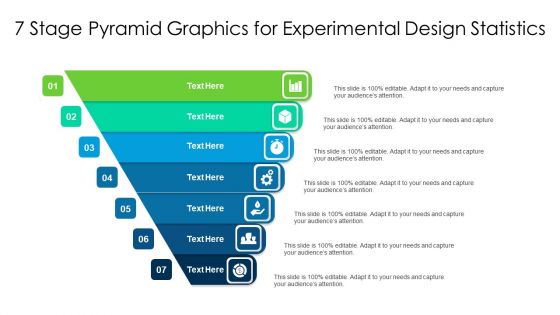
Presenting 7 stage pyramid graphics for experimental design statistics ppt powerpoint presentation file graphics template pdf to dispense important information. This template comprises seven stages. It also presents valuable insights into the topics including 7 stage pyramid graphics for experimental design statistics. This is a completely customizable PowerPoint theme that can be put to use immediately. So, download it and address the topic impactfully.


