dashboard
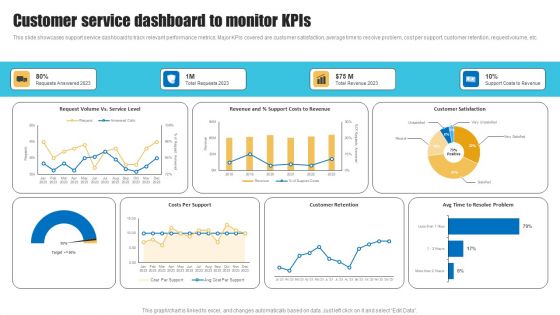
Customer Service Dashboard Strategies To Improve Customer Support Services Sample PDF
This slide showcases support service dashboard to track relevant performance metrics. Major KPIs covered are customer satisfaction, average time to resolve problem, cost per support, customer retention, request volume, etc. Presenting this PowerPoint presentation, titled Customer Service Dashboard Strategies To Improve Customer Support Services Sample PDF, with topics curated by our researchers after extensive research. This editable presentation is available for immediate download and provides attractive features when used. Download now and captivate your audience. Presenting this Customer Service Dashboard Strategies To Improve Customer Support Services Sample PDF. Our researchers have carefully researched and created these slides with all aspects taken into consideration. This is a completely customizable Customer Service Dashboard Strategies To Improve Customer Support Services Sample PDF that is available for immediate downloading. Download now and make an impact on your audience. Highlight the attractive features available with our PPTs.

Enhancing Retail Process By Effective Inventory Management KPI Dashboard For Retail Business Inspiration PDF
This slide portrays key performance dashboard for measuring retail business performance. KPIs covered in the dashboards are average shopping time, shop visitors, average basket spend and customer retention. If you are looking for a format to display your unique thoughts, then the professionally designed Enhancing Retail Process By Effective Inventory Management KPI Dashboard For Retail Business Inspiration PDF is the one for you. You can use it as a Google Slides template or a PowerPoint template. Incorporate impressive visuals, symbols, images, and other charts. Modify or reorganize the text boxes as you desire. Experiment with shade schemes and font pairings. Alter, share or cooperate with other people on your work. Download Enhancing Retail Process By Effective Inventory Management KPI Dashboard For Retail Business Inspiration PDF and find out how to give a successful presentation. Present a perfect display to your team and make your presentation unforgettable.

Building Innovation Capabilities And USP Detection Marketing KPI And Dashboard Ppt Infographic Template Pictures PDF
Show your sale and financial highlights of through our dashboard. Deliver an awe-inspiring pitch with this creative building innovation capabilities and usp detection marketing kpi and dashboard ppt infographic template pictures pdf bundle. Topics like revenue per acquisition, per acquisition, marketing spend, total revenu, leads, acquisitions, profit, return on investment can be discussed with this completely editable template. It is available for immediate download depending on the needs and requirements of the user.
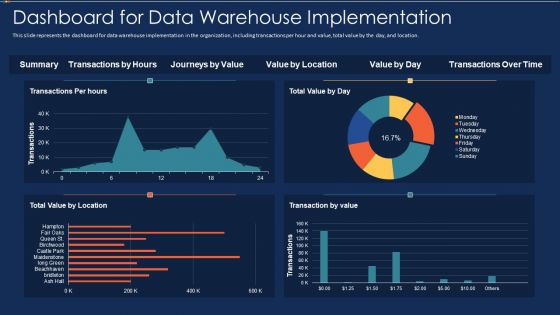
Data Warehousing IT Dashboard For Data Warehouse Implementation Ppt Summary Visual Aids PDF
This slide represents the dashboard for data warehouse implementation in the organization, including transactions per hour and value, total value by the day, and location. Deliver an awe inspiring pitch with this creative data warehousing it dashboard for data warehouse implementation ppt summary visual aids pdf bundle. Topics like transactions, value, location can be discussed with this completely editable template. It is available for immediate download depending on the needs and requirements of the user.
Implementing Fixed Asset Management Fixed Asset Management Dashboard For Tracking Summary PDF
This slide represents fixed asset management dashboard for tracking equipment performance. It includes work management, downtime, work orders etc. Deliver and pitch your topic in the best possible manner with this Implementing Fixed Asset Management Fixed Asset Management Dashboard For Tracking Summary PDF. Use them to share invaluable insights on Data Sets, Asset Details, Labour Analysis, Purchasing Spend and impress your audience. This template can be altered and modified as per your expectations. So, grab it now.
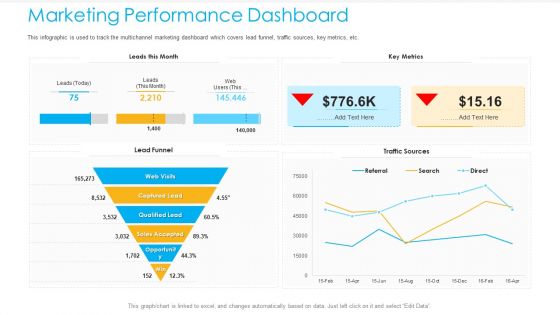
Unified Business To Consumer Marketing Strategy Marketing Performance Dashboard Introduction PDF
This infographic is used to track the multichannel marketing dashboard which covers lead funnel, traffic sources, key metrics, etc.Deliver an awe-inspiring pitch with this creative unified business to consumer marketing strategy marketing performance dashboard introduction pdf bundle. Topics like captured lead, qualified lead, sales accepted can be discussed with this completely editable template. It is available for immediate download depending on the needs and requirements of the user.

Marketing Manual For Product Promotion On Youtube Channel Youtube Marketing Dashboard Highlighting Traffic Professional PDF
This slide showcases the YouTube marketing dashboard which includes subscriber gained vs loss list which includes traffic sources and lasted uploaded videos data.Deliver an awe inspiring pitch with this creative Marketing Manual For Product Promotion On Youtube Channel Youtube Marketing Dashboard Highlighting Traffic Professional PDF bundle. Topics like Direct Traffic, External Sources, Suggested Video can be discussed with this completely editable template. It is available for immediate download depending on the needs and requirements of the user.
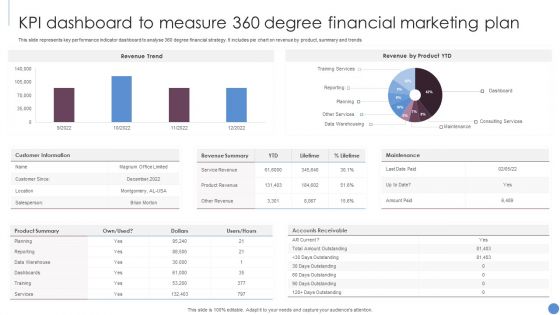
KPI Dashboard To Measure 360 Degree Financial Marketing Plan Slides PDF
This slide represents key performance indicator dashboard to analyse 360 degree financial strategy. It includes pie chart on revenue by product, summary and trends. Showcasing this set of slides titled KPI Dashboard To Measure 360 Degree Financial Marketing Plan Slides PDF. The topics addressed in these templates are Revenue Trend, Revenue Product YTD, Customer Information. All the content presented in this PPT design is completely editable. Download it and make adjustments in color, background, font etc. as per your unique business setting.
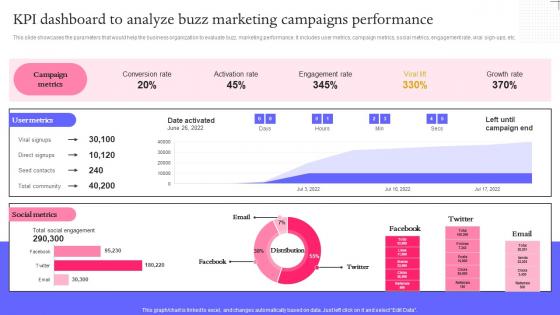
KPI Dashboard To Analyze Buzz Marketing Techniques For Engaging Summary Pdf
This slide showcases the parameters that would help the business organization to evaluate buzz marketing performance. It includes user metrics, campaign metrics, social metrics, engagement rate, viral sign ups, etc. Slidegeeks is here to make your presentations a breeze with KPI Dashboard To Analyze Buzz Marketing Techniques For Engaging Summary Pdf With our easy to use and customizable templates, you can focus on delivering your ideas rather than worrying about formatting. With a variety of designs to choose from, you are sure to find one that suits your needs. And with animations and unique photos, illustrations, and fonts, you can make your presentation pop. So whether you are giving a sales pitch or presenting to the board, make sure to check out Slidegeeks first.

RPA And Hyper Automation Impact Dashboard RPA Influence On Industries Ideas Pdf
The following slide provides an overview of the impact of RPA and Hyperautomation on manufacturing , the provided highlights plant productivity, machine productivity. Retrieve professionally designed RPA And Hyper Automation Impact Dashboard RPA Influence On Industries Ideas Pdf to effectively convey your message and captivate your listeners. Save time by selecting pre-made slideshows that are appropriate for various topics, from business to educational purposes. These themes come in many different styles, from creative to corporate, and all of them are easily adjustable and can be edited quickly. Access them as PowerPoint templates or as Google Slides themes. You do not have to go on a hunt for the perfect presentation because Slidegeeks got you covered from everywhere.
Sports Team And Brand Engagement Tracking Dashboard In Depth Campaigning Guide Diagrams PDF
This slide showcases major impact of sports marketing strategies on overall stakeholder engagement. It provides details about repeated store visit, brand awareness, brand recall, employee engagement, sports sponsorship, etc. Slidegeeks is here to make your presentations a breeze with Sports Team And Brand Engagement Tracking Dashboard In Depth Campaigning Guide Diagrams PDF With our easy-to-use and customizable templates, you can focus on delivering your ideas rather than worrying about formatting. With a variety of designs to choose from, you are sure to find one that suits your needs. And with animations and unique photos, illustrations, and fonts, you can make your presentation pop. So whether you are giving a sales pitch or presenting to the board, make sure to check out Slidegeeks first
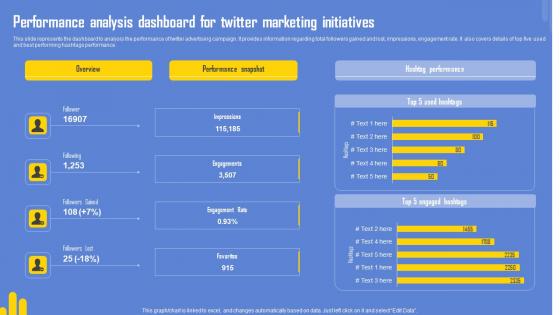
Optimizing Twitter For Online Performance Analysis Dashboard For Twitter Marketing Initiatives Topics Pdf
This slide represents the dashboard to analysis the performance of twitter campaign. It provides information regarding total followers gained and lost, impressions, engagement rate. It also covers details of top five used and best performing hashtags performance. Crafting an eye-catching presentation has never been more straightforward. Let your presentation shine with this tasteful yet straightforward Optimizing Twitter For Online Overview Of Twitter As Social Media Marketing Tool Themes Pdf template. It offers a minimalistic and classy look that is great for making a statement. The colors have been employed intelligently to add a bit of playfulness while still remaining professional. Construct the ideal Optimizing Twitter For Online Overview Of Twitter As Social Media Marketing Tool Themes Pdf that effortlessly grabs the attention of your audience Begin now and be certain to wow your customers

KPI Dashboard To Analyze Paid Comprehensive Guide For Paid Media Marketing Strategies Sample Pdf
This slide showcases the parameters that would help the business organization to evaluate paid media marketing performance. It includes metrics such as cost per acquisition CPA, monthly conversion by channel, ad impressions, daily paid social clicks, etc. Coming up with a presentation necessitates that the majority of the effort goes into the content and the message you intend to convey. The visuals of a PowerPoint presentation can only be effective if it supplements and supports the story that is being told. Keeping this in mind our experts created KPI Dashboard To Analyze Paid Comprehensive Guide For Paid Media Marketing Strategies Sample Pdf to reduce the time that goes into designing the presentation. This way, you can concentrate on the message while our designers take care of providing you with the right template for the situation.
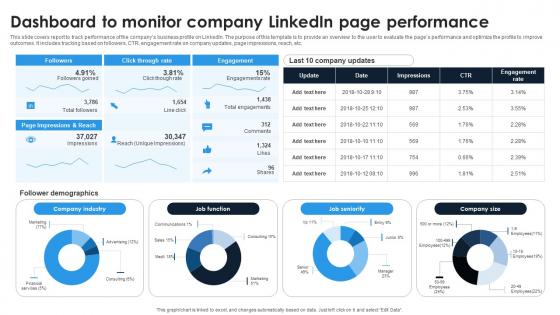
Linkedin Content Strategies Dashboard To Monitor Company Linkedin Page MKT SS V
This slide covers report to track performance of the compans business profile on LinkedIn. The purpose of this template is to provide an overview to the user to evaluate the pages performance and optimize the profile to improve outcomes. It includes tracking based on followers, CTR, engagement rate on company updates, page impressions, reach, etc. Slidegeeks is here to make your presentations a breeze with Linkedin Content Strategies Dashboard To Monitor Company Linkedin Page MKT SS V With our easy-to-use and customizable templates, you can focus on delivering your ideas rather than worrying about formatting. With a variety of designs to choose from, you are sure to find one that suits your needs. And with animations and unique photos, illustrations, and fonts, you can make your presentation pop. So whether you are giving a sales pitch or presenting to the board, make sure to check out Slidegeeks first
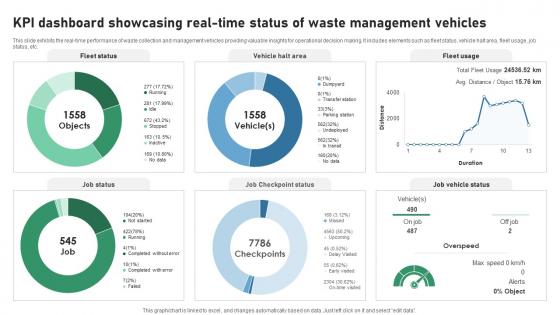
KPI Dashboard Showcasing Real Time Status Of Waste IOT Applications In Smart Waste IoT SS V
This slide exhibits the real-time performance of waste collection and management vehicles providing valuable insights for operational decision making. It includes elements such as fleet status, vehicle halt area, fleet usage, job status, etc. Take your projects to the next level with our ultimate collection of KPI Dashboard Showcasing Real Time Status Of Waste IOT Applications In Smart Waste IoT SS V. Slidegeeks has designed a range of layouts that are perfect for representing task or activity duration, keeping track of all your deadlines at a glance. Tailor these designs to your exact needs and give them a truly corporate look with your own brand colors they will make your projects stand out from the rest
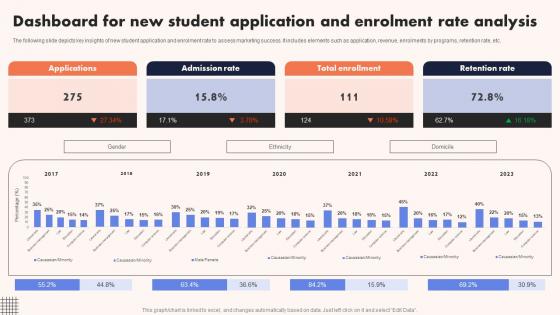
University Marketing Guide Dashboard For New Student Application And Enrolment Strategy SS V
The following slide depicts key insights of new student application and enrolment rate to assess marketing success. It includes elements such as application, revenue, enrolments by programs, retention rate, etc. Coming up with a presentation necessitates that the majority of the effort goes into the content and the message you intend to convey. The visuals of a PowerPoint presentation can only be effective if it supplements and supports the story that is being told. Keeping this in mind our experts created University Marketing Guide Dashboard For New Student Application And Enrolment Strategy SS V to reduce the time that goes into designing the presentation. This way, you can concentrate on the message while our designers take care of providing you with the right template for the situation.

Closing A Project By Fulfilling Project Management Dashboard For Overall Progress PM SS V
This slide showcases dashboard for overall progress of project management. This template focuses on tracking projects by showing high-level metrics for its success. It includes information related to milestones, time spent, etc. This modern and well-arranged Closing A Project By Fulfilling Overview Of Planning Project In An Organisation PM SS V provides lots of creative possibilities. It is very simple to customize and edit with the Powerpoint Software. Just drag and drop your pictures into the shapes. All facets of this template can be edited with Powerpoint, no extra software is necessary. Add your own material, put your images in the places assigned for them, adjust the colors, and then you can show your slides to the world, with an animated slide included.

Brand Reinforcement Dashboard For Increasing Encouraging Repetitive Customer Purchase Ppt Presentation
This slide showcases brand reinforcement metrics. This template focuses on creating brand awareness among new and existing customers. It includes information related to different aspects such as customer acquisition costs, overall sales, etc. Slidegeeks is one of the best resources for PowerPoint templates. You can download easily and regulate Brand Reinforcement Dashboard For Increasing Encouraging Repetitive Customer Purchase Ppt Presentation for your personal presentations from our wonderful collection. A few clicks is all it takes to discover and get the most relevant and appropriate templates. Use our Templates to add a unique zing and appeal to your presentation and meetings. All the slides are easy to edit and you can use them even for advertisement purposes.

Sales Order Summary KPI Dashboard How To Improve Company PPT Sample Strategy SS V
The following slide showcases monthly and half-yearly order summary. It includes elements such as revenue days, refund, transaction status, paid, unpaid, subscriptions, current and previous details, etc. Do you know about Slidesgeeks Sales Order Summary KPI Dashboard How To Improve Company PPT Sample Strategy SS V These are perfect for delivering any kind od presentation. Using it, create PowerPoint presentations that communicate your ideas and engage audiences. Save time and effort by using our pre-designed presentation templates that are perfect for a wide range of topic. Our vast selection of designs covers a range of styles, from creative to business, and are all highly customizable and easy to edit. Download as a PowerPoint template or use them as Google Slides themes.

Performance KPI Dashboard To Measure Strategic Business Management Performance Pictures PDF
This slide shows dashboard which can be used to track strategic business Management operations. It includes key performance indicators planning, design, development, testing, workload, etc.Showcasing this set of slides titled Performance KPI Dashboard To Measure Strategic Business Management Performance Pictures PDF The topics addressed in these templates are Development, Projected Launch, Planning All the content presented in this PPT design is completely editable. Download it and make adjustments in color, background, font etc. as per your unique business setting.

Implementing Cyber Security Incident Cyber Security Incident Response KPI Dashboard Clipart PDF
This slide represents dashboard showing the key metrics of cyber security incident response. It includes key performance indicators such as risk score, compliance status, threat level etc. There are so many reasons you need a Implementing Cyber Security Incident Cyber Security Incident Response KPI Dashboard Clipart PDF. The first reason is you cannot spend time making everything from scratch, Thus, Slidegeeks has made presentation templates for you too. You can easily download these templates from our website easily.
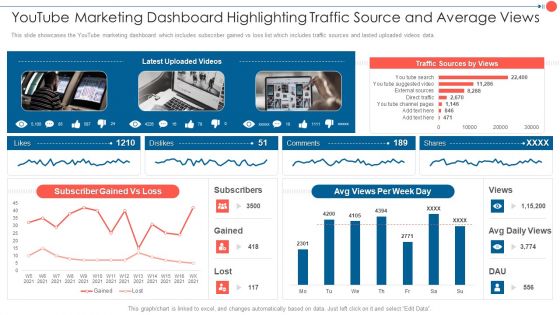
Youtube Advertising Techniques Youtube Marketing Dashboard Highlighting Traffic Source Summary PDF
This slide showcases the YouTube marketing dashboard which includes subscriber gained vs loss list which includes traffic sources and lasted uploaded videos data. Deliver an awe inspiring pitch with this creative Youtube Advertising Techniques Youtube Marketing Dashboard Highlighting Traffic Source Summary PDF bundle. Topics like Subscriber Gained, Traffic Sources, Avg Views can be discussed with this completely editable template. It is available for immediate download depending on the needs and requirements of the user.
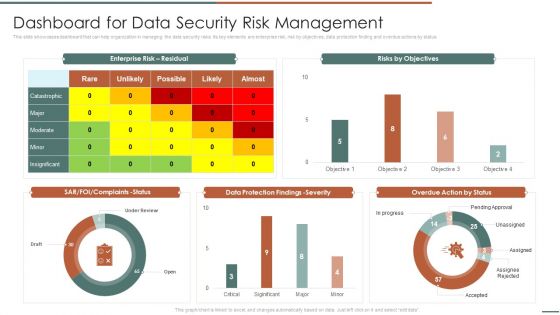
Information Security Risk Evaluation Dashboard For Data Security Risk Management Template PDF
This slide showcases dashboard that can help organization in managing the data security risks. Its key elements are enterprise risk, risk by objectives, data protection finding and overdue actions by status.Deliver an awe inspiring pitch with this creative Information Security Risk Evaluation Dashboard For Data Security Risk Management Template PDF bundle. Topics like Complaints Status, Protection Findings, Overdue Action can be discussed with this completely editable template. It is available for immediate download depending on the needs and requirements of the user.
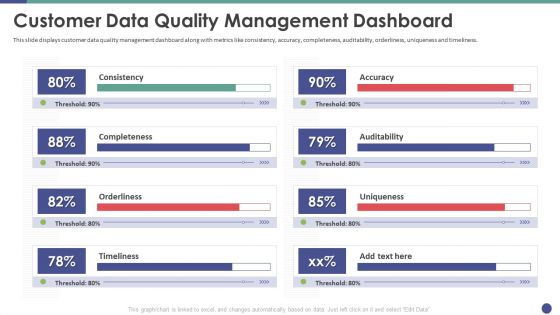
QC Engineering Customer Data Quality Management Dashboard Ppt Infographic Template Guide PDF
This slide displays customer data quality management dashboard along with metrics like consistency, accuracy, completeness, auditability, orderliness, uniqueness and timeliness. Deliver an awe inspiring pitch with this creative qc engineering customer data quality management dashboard ppt infographic template guide pdf bundle. Topics like auditability, timeliness, orderliness, completeness, consistency can be discussed with this completely editable template. It is available for immediate download depending on the needs and requirements of the user.
Cognitive Computing Action Plan Tracking Customer Data Insights Dashboard Ppt Infographics Graphic Tips PDF
This slide provides information regarding customer data insights dashboard in terms of average churn risk, segments, high earner, highly engaged customers, etc. Deliver and pitch your topic in the best possible manner with this cognitive computing action plan tracking customer data insights dashboard ppt infographics graphic tips pdf. Use them to share invaluable insights on median lifetime spend, average churm risk, brand affinities and impress your audience. This template can be altered and modified as per your expectations. So, grab it now.
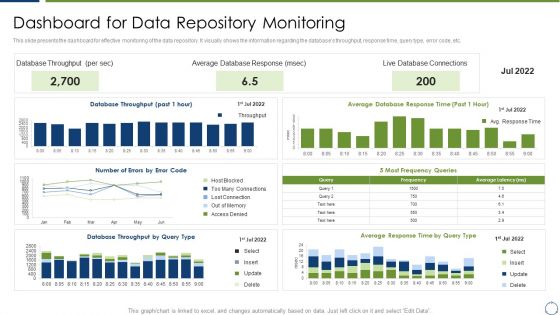
Horizontal Scaling Technique For Information Dashboard For Data Repository Monitoring Designs PDF
This slide presents the dashboard for effective monitoring of the data repository. It visually shows the information regarding the databases throughput, response time, query type, error code, etc.Deliver an awe inspiring pitch with this creative Horizontal Scaling Technique For Information Dashboard For Data Repository Monitoring Designs PDF bundle. Topics like Database Throughput, Average Database Response, Database Connections can be discussed with this completely editable template. It is available for immediate download depending on the needs and requirements of the user.

Cloud Optimization Infrastructure Model Dashboard For Data Storage And Server Usage Monitoring Rules PDF
Below dashboard depicts major statistics based on data storage and server usage of cloud for better optimizing cloud components in order to reduce overall cost.Deliver an awe inspiring pitch with this creative Cloud Optimization Infrastructure Model Dashboard For Data Storage And Server Usage Monitoring Rules PDF bundle. Topics like Storage Utilization, Key Takeaways, Datacenter can be discussed with this completely editable template. It is available for immediate download depending on the needs and requirements of the user.

Techniques To Implement Cloud Infrastructure Dashboard For Data Storage And Server Usage Monitoring Mockup PDF
Below dashboard depicts major statistics based on data storage and server usage of cloud for better optimizing cloud components in order to reduce overall cost.Deliver an awe inspiring pitch with this creative Techniques To Implement Cloud Infrastructure Dashboard For Data Storage And Server Usage Monitoring Mockup PDF bundle. Topics like Storage Utilization, Key Takeaways, Center Memory can be discussed with this completely editable template. It is available for immediate download depending on the needs and requirements of the user.
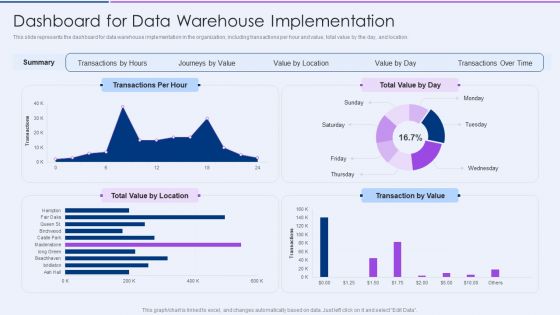
Executive Information Database System Dashboard For Data Warehouse Implementation Ideas PDF
This slide represents the dashboard for data warehouse implementation in the organization, including transactions per hour and value, total value by the day, and location.Deliver and pitch your topic in the best possible manner with this Executive Information Database System Dashboard For Data Warehouse Implementation Ideas PDF. Use them to share invaluable insights on Transactions Time, Value Location, Journeys Value and impress your audience. This template can be altered and modified as per your expectations. So, grab it now.
Computer Simulation Human Thinking Tracking Customer Data Insights Dashboard Topics PDF
This slide provides information regarding customer data insights dashboard in terms of average churn risk, segments, high earner, highly engaged customers, etc. Deliver an awe inspiring pitch with this creative Computer Simulation Human Thinking Tracking Customer Data Insights Dashboard Topics PDF bundle. Topics like Interests, Brand Affinities, High Earners, Return Customers can be discussed with this completely editable template. It is available for immediate download depending on the needs and requirements of the user.
Cognitive Visualizations Computing Strategy Tracking Customer Data Insights Dashboard Brochure PDF
This slide provides information regarding customer data insights dashboard in terms of average churn risk, segments, high earner, highly engaged customers, etc. Deliver an awe inspiring pitch with this creative Cognitive Visualizations Computing Strategy Tracking Customer Data Insights Dashboard Brochure PDF bundle. Topics like Median Lifetime, Engaged Customers, Return Customers can be discussed with this completely editable template. It is available for immediate download depending on the needs and requirements of the user.
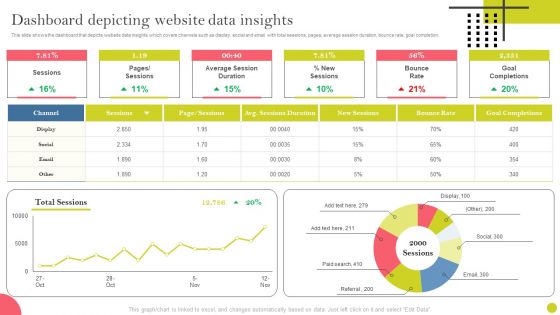
Identifying And Increasing Brand Awareness Dashboard Depicting Website Data Insights Rules PDF
This slide shows the dashboard that depicts website data insights which covers channels such as display, social and email with total sessions, pages, average session duration, bounce rate, goal completion. There are so many reasons you need a Identifying And Increasing Brand Awareness Dashboard Depicting Website Data Insights Rules PDF. The first reason is you can not spend time making everything from scratch, Thus, Slidegeeks has made presentation templates for you too. You can easily download these templates from our website easily.
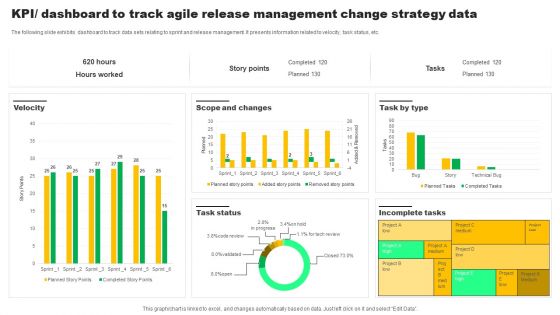
Kpi Dashboard To Track Agile Release Management Change Strategy Data Mockup PDF
The following slide exhibits dashboard to track data sets relating to sprint and release management. It presents information related to velocity, task status, etc. Showcasing this set of slides titled Kpi Dashboard To Track Agile Release Management Change Strategy Data Mockup PDF. The topics addressed in these templates are Velocity, Task Status, Incomplete Tasks. All the content presented in this PPT design is completely editable. Download it and make adjustments in color, background, font etc. as per your unique business setting.
Web App Firewall Services IT Kpis Dashboard For Threat Tracking In WAF Guidelines PDF
This slide depicts how threat risk will be monitored and threat detection will be done in the organization through web application firewall implementation. Deliver and pitch your topic in the best possible manner with this web app firewall services it kpis dashboard for threat tracking in waf guidelines pdf. Use them to share invaluable insights on kpis or dashboard for threat tracking in waf and impress your audience. This template can be altered and modified as per your expectations. So, grab it now.
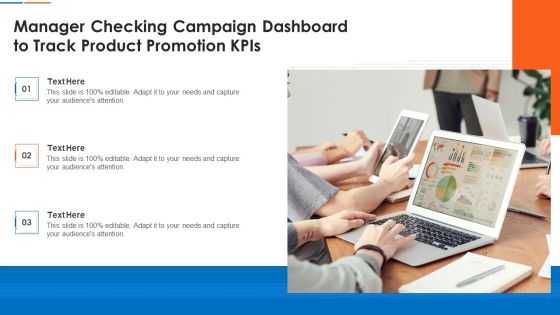
Manager Checking Campaign Dashboard To Track Product Promotion Kpis Pictures PDF Slides PDF
Persuade your audience using this Manager Checking Campaign Dashboard To Track Product Promotion Kpis Pictures PDF Slides PDF This PPT design covers three stages, thus making it a great tool to use. It also caters to a variety of topics including Manager Checking Campaign Dashboard To Track Product Promotion Kpis Download this PPT design now to present a convincing pitch that not only emphasizes the topic but also showcases your presentation skills.
HR Recruitment Dashboard Kpis With Active Pipeline Ppt Icon Slide Portrait PDF
This slide showcases the recruitment dashboard metrics to know monthly hiring rate. It include KPIs like sources, decline reasons, active pipeline, recruitment funnel. Showcasing this set of slides titled HR Recruitment Dashboard Kpis With Active Pipeline Ppt Icon Slide Portrait PDF. The topics addressed in these templates are Recruitment Funnel, Monthly Metrics, Application Sources. All the content presented in this PPT design is completely editable. Download it and make adjustments in color, background, font etc. as per your unique business setting.
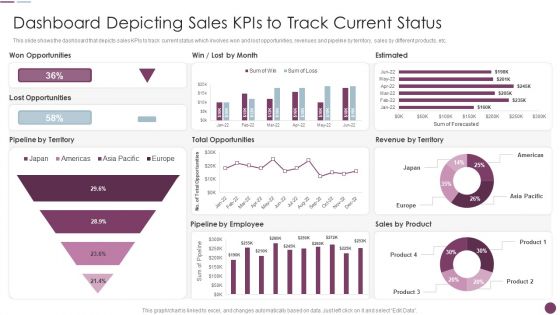
Sales Automation Procedure Dashboard Depicting Sales Kpis To Track Current Status Sample PDF
This slide shows the dashboard that depicts sales KPIs to track current status which involves won and lost opportunities, revenues and pipeline by territory, sales by different products, etc. Deliver an awe inspiring pitch with this creative Sales Automation Procedure Dashboard Depicting Sales Kpis To Track Current Status Sample PDF bundle. Topics like Estimated, Pipeline Employee, Pipeline Territory can be discussed with this completely editable template. It is available for immediate download depending on the needs and requirements of the user.
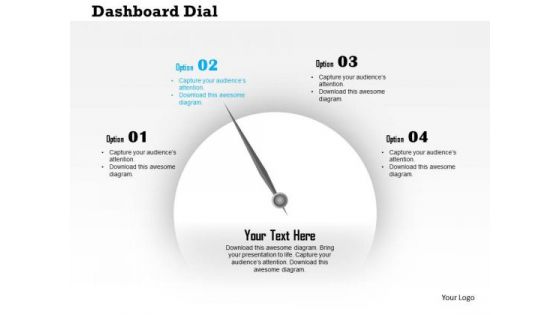
Business Diagram Dashboard With Pointer And Text Boxes For Process Control Presentation Template
This business diagram displays graphic of dashboard with pointer and text boxes. This slide helps to depict concept of business process and management. Present your views using this innovative slide and be assured of leaving a lasting impression.

KPI Dashboard With Financial Analysis Of Company Ppt PowerPoint Presentation Backgrounds
This is a kpi dashboard with financial analysis of company ppt powerpoint presentation backgrounds. This is a four stage process. The stages in this process are business, strategy, marketing, line graph, finance.
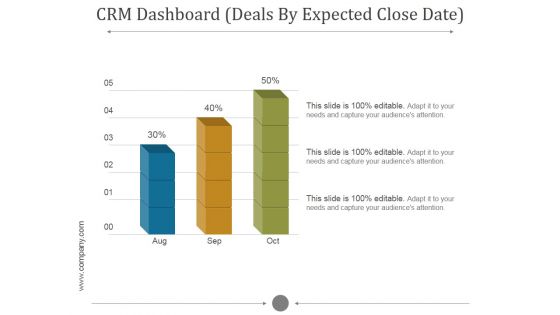
Crm Dashboard Deals By Expected Close Date Ppt PowerPoint Presentation Background Images
This is a crm dashboard deals by expected close date ppt powerpoint presentation background images. This is a five stage process. The stages in this process are bar graph, aug, sep, oct, growth.
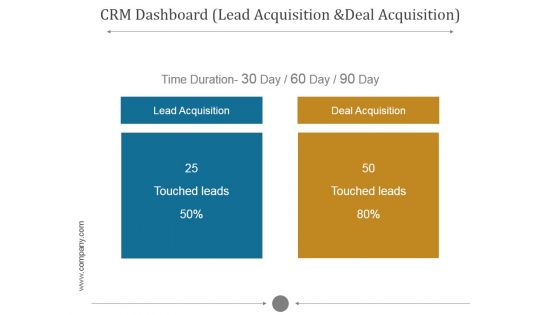
Crm Dashboard Lead Acquisition And Deal Acquisition Ppt PowerPoint Presentation Inspiration
This is a crm dashboard lead acquisition and deal acquisition ppt powerpoint presentation inspiration. This is a five stage process. The stages in this process are touched leads, lead acquisition, deal acquisition, time duration.
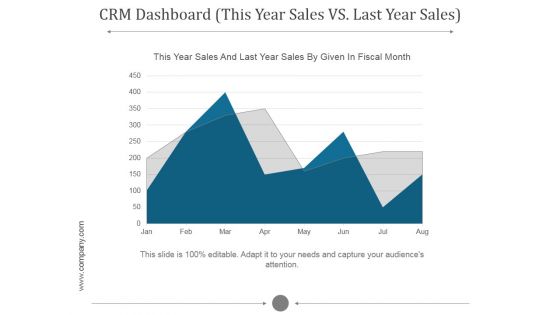
Crm Dashboard This Year Sales Vs Last Year Sales Ppt PowerPoint Presentation Information
This is a crm dashboard this year sales vs last year sales ppt powerpoint presentation information. This is a five stage process. The stages in this process are this year sales and last year sales by given in fiscal month.

Customer Relationship Management Process And Dashboard PPT PowerPoint Presentation Complete Deck With Slides
This is a customer relationship management process and dashboard ppt powerpoint presentation complete deck with slides. This is a one stage process. The stages in this process are sales, service, strategy, revenue, customer service.
Crm Dashboard Deals By Expected Close Date Ppt PowerPoint Presentation Icon
This is a crm dashboard deals by expected close date ppt powerpoint presentation icon. This is a three stage process. The stages in this process are deals by expected close date, years, planning, business, growth.

Crm Dashboard Lead Acquisition And Deal Acquisition Ppt PowerPoint Presentation Backgrounds
This is a crm dashboard lead acquisition and deal acquisition ppt powerpoint presentation backgrounds. This is a two stage process. The stages in this process are lead acquisition, deal acquisition, touched leads, new deals.
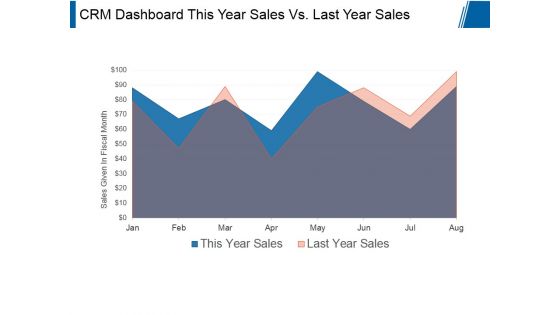
Crm Dashboard This Year Sales Vs Last Year Sales Ppt PowerPoint Presentation Styles
This is a crm dashboard this year sales vs last year sales ppt powerpoint presentation styles. This is a two stage process. The stages in this process are sales given in fiscal month, business, marketing, presentation, growth.

Crm Dashboard Deals By Expected Close Date Ppt PowerPoint Presentation Styles
This is a crm dashboard deals by expected close date ppt powerpoint presentation styles. This is a three stage process. The stages in this process are deals by expected close date, business, marketing, strategy, success.

Crm Dashboard Lead Acquisition And Deal Acquisition Ppt PowerPoint Presentation Tips
This is a crm dashboard lead acquisition and deal acquisition ppt powerpoint presentation tips. This is a two stage process. The stages in this process are lead acquisition, deal acquisition, touched leads, new deals.
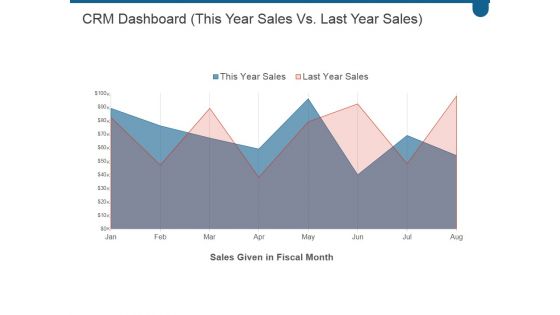
Crm Dashboard This Year Sales Vs Last Year Sales Ppt PowerPoint Presentation Deck
This is a crm dashboard this year sales vs last year sales ppt powerpoint presentation deck. This is a two stage process. The stages in this process are business, marketing, success, growth, finance.
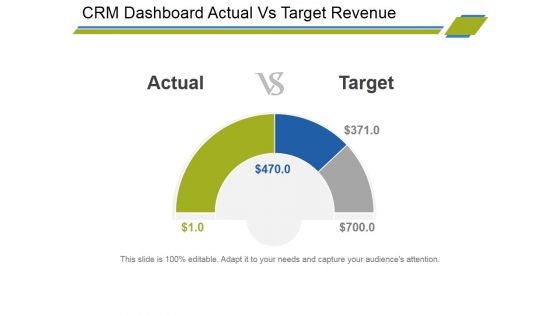
Crm Dashboard Actual Vs Target Revenue Ppt PowerPoint Presentation Outline Example File
This is a crm dashboard actual vs target revenue ppt powerpoint presentation outline example file. This is a three stage process. The stages in this process are actual, target.
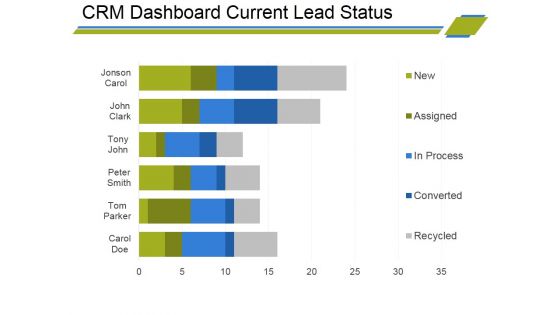
Crm Dashboard Current Lead Status Ppt PowerPoint Presentation Infographic Template Visual Aids
This is a crm dashboard current lead status ppt powerpoint presentation infographic template visual aids. This is a six stage process. The stages in this process are bar graph, finance, marketing, strategy, business, analysis.
Crm Dashboard Deals By Expected Close Date Ppt PowerPoint Presentation Portfolio Icons
This is a crm dashboard deals by expected close date ppt powerpoint presentation portfolio icons. This is a three stage process. The stages in this process are bar graph, finance, marketing, strategy, business, analysis, growth.

Crm Dashboard Lead Acquisition And Deal Acquisition Ppt PowerPoint Presentation Professional File Formats
This is a crm dashboard lead acquisition and deal acquisition ppt powerpoint presentation professional file formats. This is a two stage process. The stages in this process are lead acquisition, deal acquisition.
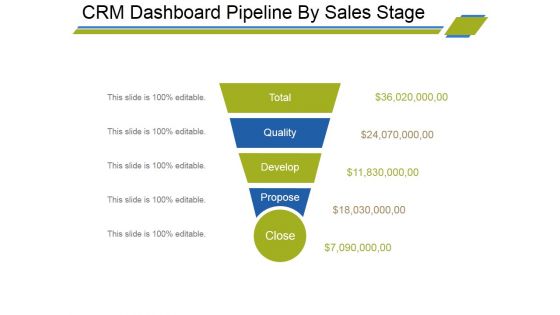
Crm Dashboard Pipeline By Sales Stage Ppt PowerPoint Presentation Infographic Template Slides
This is a crm dashboard pipeline by sales stage ppt powerpoint presentation infographic template slides. This is a five stage process. The stages in this process are total, quality, develop, propose, close.
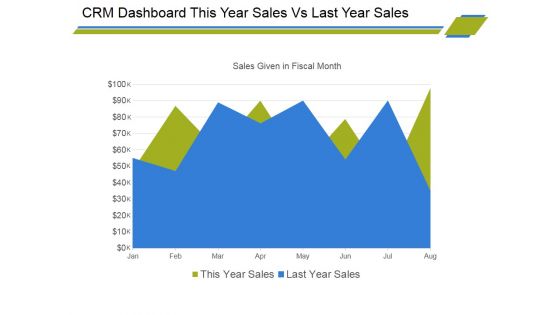
Crm Dashboard This Year Sales Vs Last Year Sales Ppt PowerPoint Presentation Professional Display
This is a crm dashboard this year sales vs last year sales ppt powerpoint presentation professional display. This is a two stage process. The stages in this process are area chart, growth, management, marketing, business, strategy.

Supply Chain Kpi Dashboard Ppt PowerPoint Presentation Complete Deck With Slides
This is a supply chain kpi dashboard ppt powerpoint presentation complete deck with slides. This is a one stage process. The stages in this process are business, strategy, marketing, analysis, business model.
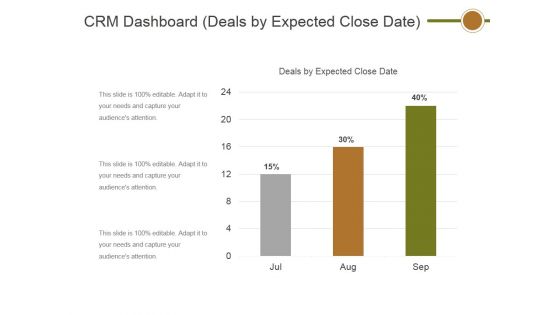
Crm Dashboard Deals By Expected Close Date Ppt PowerPoint Presentation Show Information
This is a crm dashboard deals by expected close date ppt powerpoint presentation show information. This is a three stage process. The stages in this process are deals by expected close date, percentage, business, finance, success.

Crm Dashboard Lead Acquisition And Deal Acquisition Ppt PowerPoint Presentation Model Designs
This is a crm dashboard lead acquisition and deal acquisition ppt powerpoint presentation model designs. This is a two stage process. The stages in this process are lead acquisition, deal acquisition.
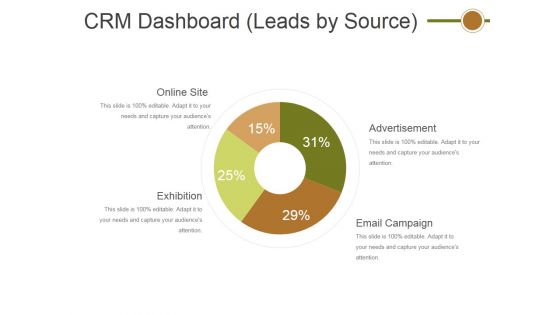
Crm Dashboard Leads By Source Ppt PowerPoint Presentation File Graphics Template
This is a crm dashboard leads by source ppt powerpoint presentation file graphics template. This is a four stage process. The stages in this process are online site, exhibition, advertisement, email campaign.
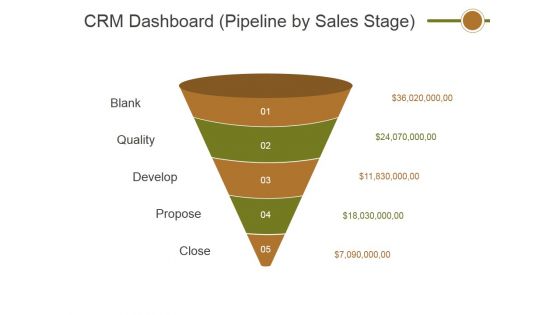
Crm Dashboard Pipeline By Sales Stage Ppt PowerPoint Presentation Outline Outfit
This is a crm dashboard pipeline by sales stage ppt powerpoint presentation outline outfit. This is a five stage process. The stages in this process are blank, quality, develop, propose, close.

 Home
Home