Yearly Progress

Clinical Services Company Profile Our Evolution Rules PDF
The slide the company timeline from its inauguration to current year. It depicts major milestones achieved by organization which includes regulatory approvals, research investment , API formulation development and business expansion. Presenting Clinical Services Company Profile Our Evolution Rules PDF to provide visual cues and insights. Share and navigate important information on tweleve stages that need your due attention. This template can be used to pitch topics like Expanded Business, Drugs Globally, Drug Production. In addtion, this PPT design contains high resolution images, graphics, etc, that are easily editable and available for immediate download.
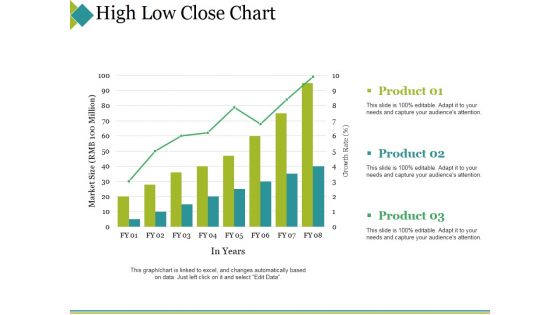
High Low Close Chart Ppt PowerPoint Presentation Portfolio Topics
This is a high low close chart ppt powerpoint presentation portfolio topics. This is a three stage process. The stages in this process are product, market size, in years, success, bar graph.
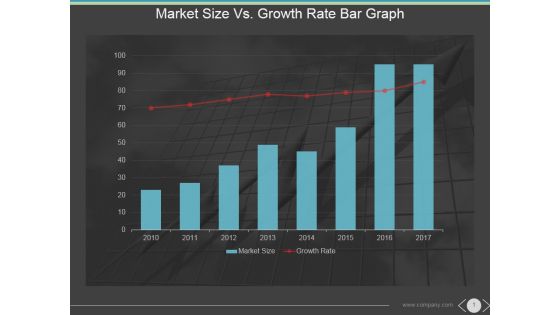
Market Size Vs Growth Rate Bar Graph Ppt PowerPoint Presentation Themes
This is a market size vs growth rate bar graph ppt powerpoint presentation themes. This is a eight stage process. The stages in this process are market size, growth rate, years, future, graph.
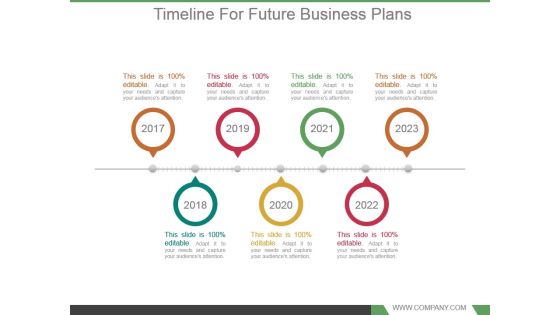
Timeline For Future Business Plans Ppt Background Designs
This is a timeline for future business plans ppt background designs. This is a seven stage process. The stages in this process are time planning, marketing, business, success, years.
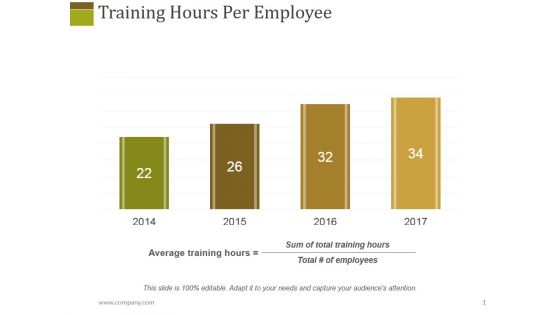
Training Hours Per Employee Ppt PowerPoint Presentation Styles Influencers
This is a training hours per employee ppt powerpoint presentation styles influencers. This is a four stage process. The stages in this process are average training hours, sum of total training hours, year, growth.
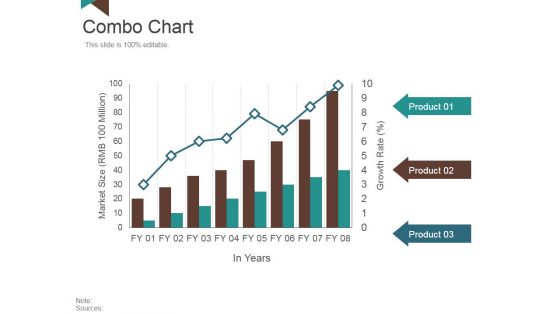
Combo Chart Ppt PowerPoint Presentation Inspiration Images
This is a combo chart ppt powerpoint presentation inspiration images. This is a three stage process. The stages in this process are market size, in years, growth rate, product.

Planning For Future Workforce Needs Ppt PowerPoint Presentation Outline Smartart
This is a planning for future workforce needs ppt powerpoint presentation outline smartart. This is a three stage process. The stages in this process are growth, percentage, number of headcount, year, finance.
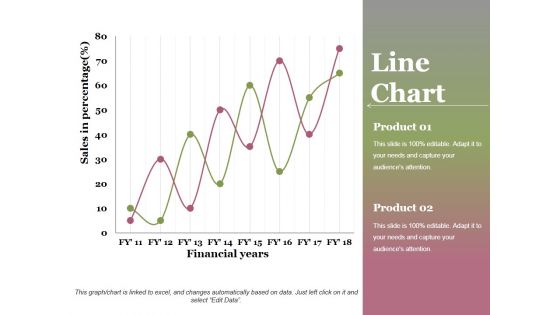
Line Chart Ppt PowerPoint Presentation Professional Graphics Design
This is a line chart ppt powerpoint presentation professional graphics design. This is a two stage process. The stages in this process are financial years, sales in percentage, product, growth, success.

Clustered Column Ppt PowerPoint Presentation File Graphics
This is a clustered column ppt powerpoint presentation file graphics. This is a two stage process. The stages in this process are product, financial year, sales in percentage, graph, growth.

Line Chart Ppt PowerPoint Presentation File Example File
This is a line chart ppt powerpoint presentation file example file. This is a two stage process. The stages in this process are product, in percentage, in years, growth, success.
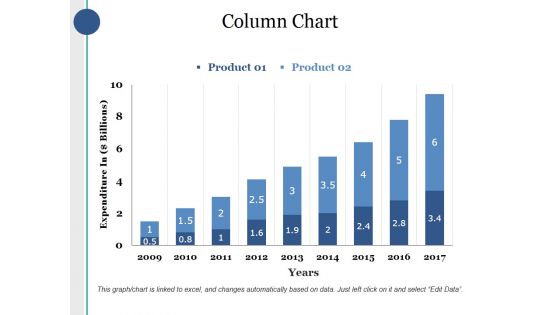
Column Chart Ppt PowerPoint Presentation Infographics Deck
This is a column chart ppt powerpoint presentation infographics deck. This is a two stage process. The stages in this process are product, expenditure in, years, bar graph, growth.
Bar Chart Ppt PowerPoint Presentation Icon Information
This is a bar chart ppt powerpoint presentation icon information. This is a one stage process. The stages in this process are product, sales in percentage, financial years, bar graph, growth.
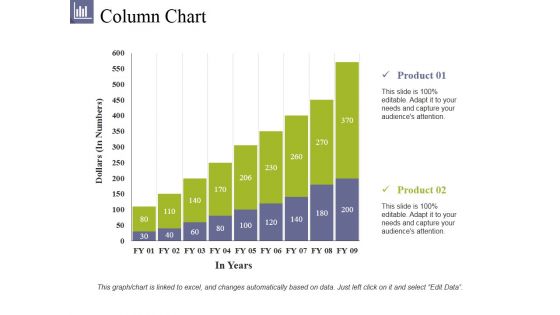
Column Chart Ppt PowerPoint Presentation File Summary
This is a column chart ppt powerpoint presentation file summary. This is a two stage process. The stages in this process are product, dollars, in years, bar graph, growth.
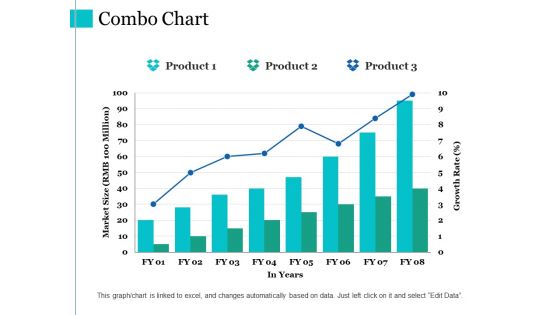
Combo Chart Ppt PowerPoint Presentation Gallery Diagrams
This is a combo chart ppt powerpoint presentation gallery diagrams. This is a three stage process. The stages in this process are combo chart, market size, product, in years, growth rate.

Budget Performance Monitoring Good Ppt Example
This is a budget performance monitoring good ppt example. This is a four stage process. The stages in this process are impact on future years, take actions on variances, approved budget, compare with actual spending.

Project Performance Bar Graph Ppt PowerPoint Presentation Outline
This is a project performance bar graph ppt powerpoint presentation outline. This is a four stage process. The stages in this process are finance, year, business, marketing, future, marketing.
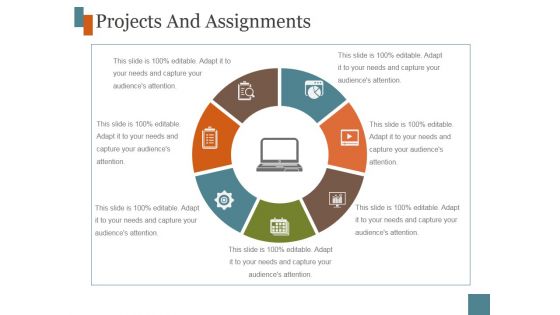
Projects And Assignments Template 8 Ppt PowerPoint Presentation Diagrams
This is a projects and assignments template 8 ppt powerpoint presentation diagrams. This is a seven stage process. The stages in this process are year, business, management, icons, strategy.

Process Management In Tqm Ppt PowerPoint Presentation Show Aids
This is a process management in tqm ppt powerpoint presentation show aids. This is a five stage process. The stages in this process are process, management, years, business, icons.

Process Management In Tqm Ppt PowerPoint Presentation Portfolio Information
This is a process management in tqm ppt powerpoint presentation portfolio information. This is a five stage process. The stages in this process are process, management, years, business, icons.
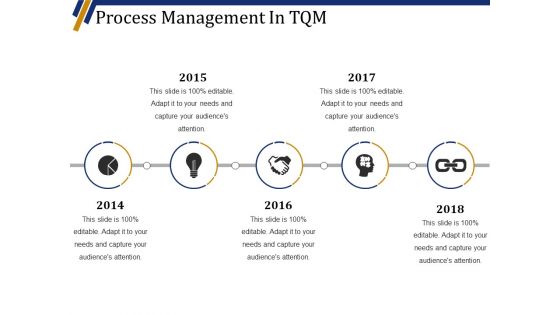
Process Management In Tqm Ppt PowerPoint Presentation Summary Design Ideas
This is a process management in tqm ppt powerpoint presentation summary design ideas. This is a five stage process. The stages in this process are years, icons, business, marketing, strategy.

Clustered Column Ppt PowerPoint Presentation File Slide
This is a clustered column ppt powerpoint presentation file slide. This is a two stage process. The stages in this process are product, financial year, sales in percentage, bar graph.
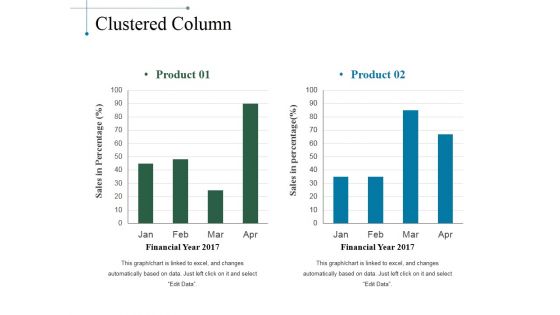
Clustered Column Ppt PowerPoint Presentation Slides Smartart
This is a clustered column ppt powerpoint presentation slides smartart. This is a two stage process. The stages in this process are product, sales in percentage, financial year, bar graph.
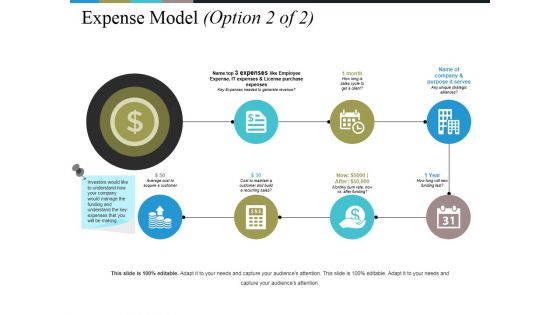
Expense Model Template 1 Ppt PowerPoint Presentation Pictures Template
This is a expense model template 1 ppt powerpoint presentation pictures template. This is a seven stage process. The stages in this process are name of company and purpose it serves, year, month, business, management.
Expense Model Template Ppt PowerPoint Presentation Icon Vector
This is a expense model template ppt powerpoint presentation icon vector. This is a seven stage process. The stages in this process are name of company and purpose it serves, year, month, business, management.
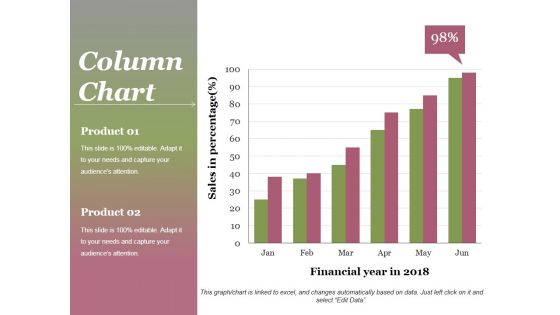
Column Chart Ppt PowerPoint Presentation Gallery Background
This is a column chart ppt powerpoint presentation gallery background. This is a two stage process. The stages in this process are product, sales in percentage, financial year, graph, success.

Column Chart Ppt PowerPoint Presentation Layouts Graphics Example
This is a column chart ppt powerpoint presentation layouts graphics example. This is a two stage process. The stages in this process are product, year, bar graph, business, finance.
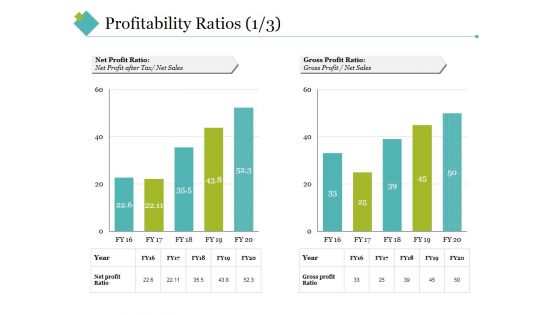
Profitability Ratios Template 2 Ppt PowerPoint Presentation Styles Example Topics
This is a profitability ratios template 2 ppt powerpoint presentation styles example topics. This is a two stage process. The stages in this process are net profit ratio, gross profit ratio, net sales, gross profit, year.
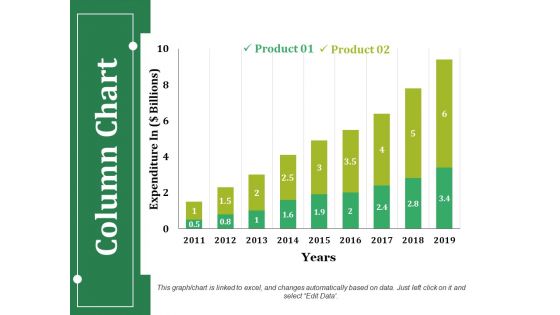
Column Chart Ppt PowerPoint Presentation Infographics Guidelines
This is a column chart ppt powerpoint presentation infographics guidelines. This is a two stage process. The stages in this process are product, expenditure in, years, business, bar graph.
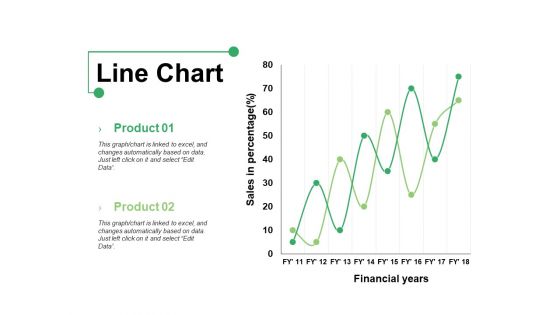
Line Chart Ppt PowerPoint Presentation Show Graphics Example
This is a line chart ppt powerpoint presentation show graphics example. This is a two stage process. The stages in this process are product, line chart, financial years, sales in percentage.

Line Chart Ppt PowerPoint Presentation Professional Grid
This is a line chart ppt powerpoint presentation professional grid. This is a two stage process. The stages in this process are sales in percentage, financial years, product, line chart.

Line Chart Ppt PowerPoint Presentation Ideas Elements
This is a line chart ppt powerpoint presentation ideas elements. This is a two stage process. The stages in this process are product, sales in percentage, financial year, business, line chart.
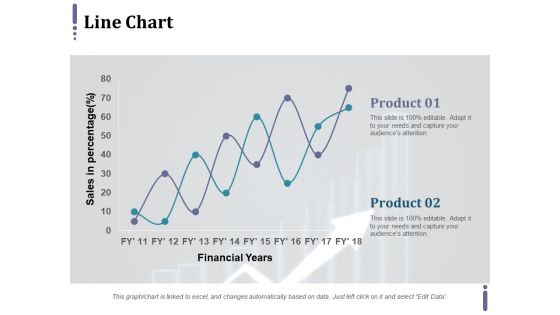
Line Chart Ppt PowerPoint Presentation Infographic Template Master Slide
This is a line chart ppt powerpoint presentation infographic template master slide. This is a two stage process. The stages in this process are product, financial years, sales in percentage.

Clustered Column Ppt PowerPoint Presentation Infographic Template Backgrounds
This is a clustered column ppt powerpoint presentation infographic template backgrounds. This is a two stage process. The stages in this process are sales in percentage, financial year, product.
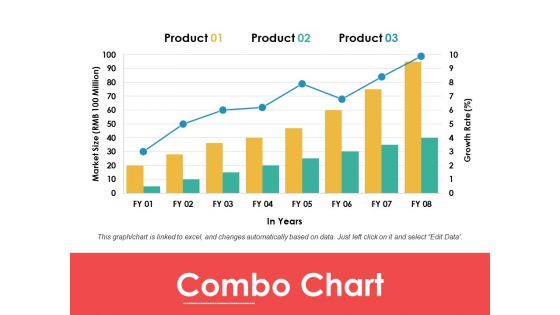
Combo Chart Ppt PowerPoint Presentation Pictures Objects
This is a combo chart ppt powerpoint presentation pictures objects. This is a three stage process. The stages in this process are product, combo chart, in years, market size.

Stacked Area Clustered Column Ppt PowerPoint Presentation Summary Slides
This is a stacked area clustered column ppt powerpoint presentation summary slides. This is a three stage process. The stages in this process are product, in percentage, financial year, bar graph.
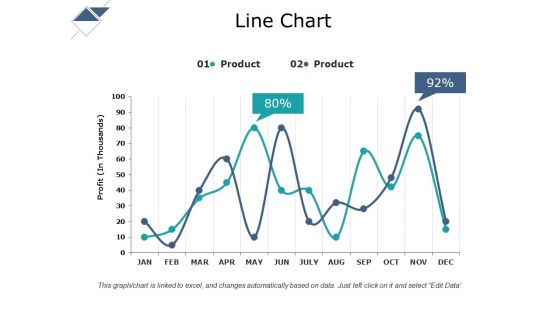
Line Chart Ppt PowerPoint Presentation Gallery Format Ideas
This is a line chart ppt powerpoint presentation gallery format ideas. This is a two stage process. The stages in this process are line chart, product, in year, profit.
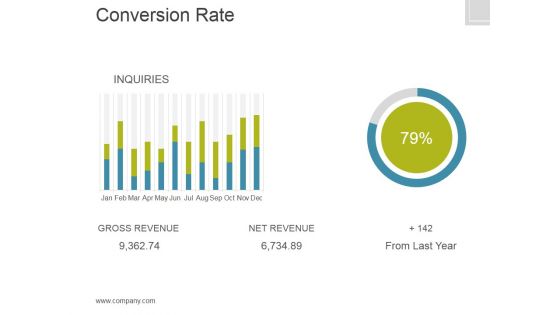
Conversion Rate Template 1 Ppt PowerPoint Presentation Portfolio
This is a conversion rate template 1 ppt powerpoint presentation portfolio. This is a three stage process. The stages in this process are gross revenue, net revenue, from last year.

Quality Cost Report Comparison Template 1 Ppt PowerPoint Presentation Pictures Infographics
This is a quality cost report comparison template 1 ppt powerpoint presentation pictures infographics. This is a five stage process. The stages in this process are amount, percent, year, appraisal cost, prevention cost.
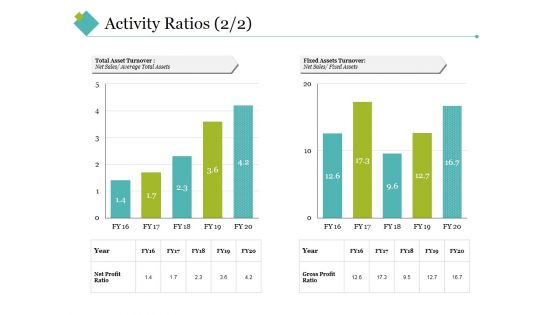
Activity Ratios Template 4 Ppt PowerPoint Presentation Styles Slideshow
This is a activity ratios template 4 ppt powerpoint presentation styles slideshow. This is a two stage process. The stages in this process are total asset turnover, fixed assets turnover, net sales, year, net profit ratio, gross profit ratio.

Marketing Action Plan Timeline Ppt PowerPoint Presentation Styles
This is a marketing action plan timeline ppt powerpoint presentation styles. This is a five stage process. The stages in this process are year, growth, success, time planning, business.

Project Events Timeline Ppt PowerPoint Presentation File Portrait
This is a project events timeline ppt powerpoint presentation file portrait. This is a five stage process. The stages in this process are year, growth, success, time planning, business.
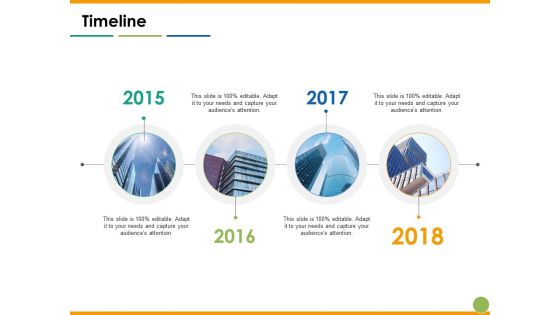
Timeline Capability Maturity Matrix Ppt PowerPoint Presentation Diagram Templates
This is a timeline capability maturity matrix ppt powerpoint presentation diagram templates. This is a four stage process. The stages in this process are year, growth, success, time planning, business.

Business Advancement Internal Growth Financial Projections Guidelines PDF
The slide depicts the projected financial projections of the firm to visualize firms target market, number of users, revenues and expenses for upcoming five years. Deliver an awe-inspiring pitch with this creative business advancement internal growth financial projections guidelines pdf bundle. Topics like target market, revenue, market penetration can be discussed with this completely editable template. It is available for immediate download depending on the needs and requirements of the user.

Business Advancement Internal Growth New Product Sales Forecasting Structure PDF
This slide provides information regarding the new products that are launched in the market with their forecasted sales for next 5 years. Deliver an awe-inspiring pitch with this creative business advancement internal growth new product sales forecasting structure pdf bundle. Topics like target operating income, target market share can be discussed with this completely editable template. It is available for immediate download depending on the needs and requirements of the user.
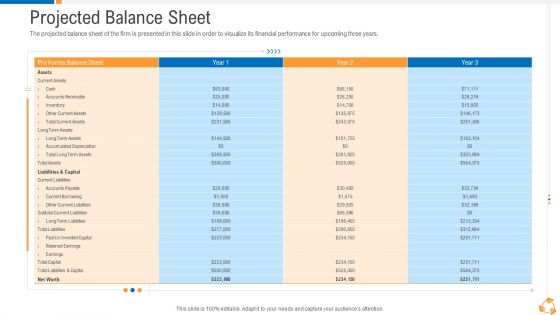
Business Advancement Internal Growth Projected Balance Sheet Pictures PDF
The projected balance sheet of the firm is presented in this slide in order to visualize its financial performance for upcoming three years. Deliver and pitch your topic in the best possible manner with this business advancement internal growth projected balance sheet pictures pdf. Use them to share invaluable insights on projected balance sheet and impress your audience. This template can be altered and modified as per your expectations. So, grab it now.

Business Advancement Internal Growth Projected Income Statement Information PDF
This slide provides glimpse about the projected profit and loss of the firm visualizing its financial performance for upcoming three years. Deliver and pitch your topic in the best possible manner with this business advancement internal growth projected income statement information pdf. Use them to share invaluable insights on projected income statement and impress your audience. This template can be altered and modified as per your expectations. So, grab it now.
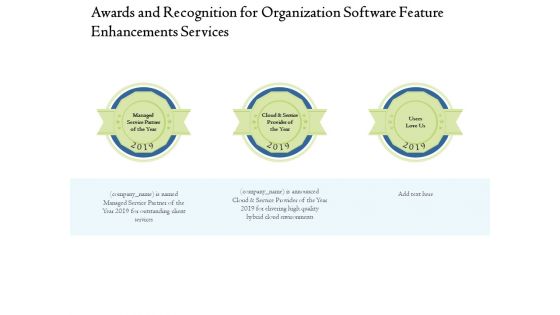
Enterprise Software Development Service Awards And Recognition For Organization Feature Enhancements Formats PDF
Presenting this set of slides with name enterprise software development service awards and recognition for organization feature enhancements formats pdf. This is a three stage process. The stages in this process are managed service partner of the year, cloud and service provider of the year, users love us. This is a completely editable PowerPoint presentation and is available for immediate download. Download now and impress your audience.
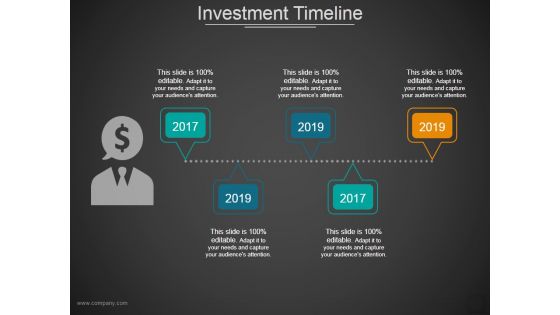
Investment Timeline Ppt PowerPoint Presentation Infographic Template Template
This is a investment timeline ppt powerpoint presentation infographic template template. This is a five stage process. The stages in this process are year, growth, success, time planning, business.

Career Template 2 Ppt PowerPoint Presentation Professional Templates
This is a career template 2 ppt powerpoint presentation professional templates. This is a six stage process. The stages in this process are year, growth, success, time planning, business.
Career Template 2 Ppt PowerPoint Presentation Icon Designs
This is a career template 2 ppt powerpoint presentation icon designs. This is a five stage process. The stages in this process are year, growth, success, time planning, business.

Planning Process In Tqm Ppt PowerPoint Presentation Infographics Template
This is a planning process in tqm ppt powerpoint presentation infographics template. This is a four stage process. The stages in this process are year, growth, success, time planning, business.
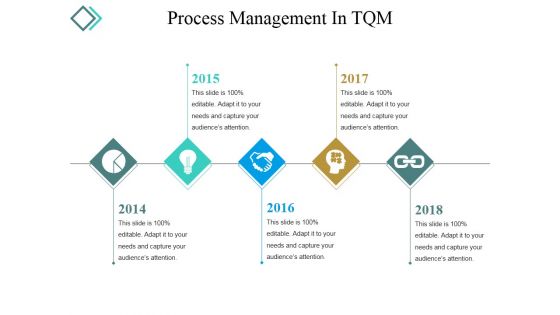
Process Management In Tqm Ppt PowerPoint Presentation Infographics Gridlines
This is a process management in tqm ppt powerpoint presentation infographics gridlines. This is a five stage process. The stages in this process are year, growth, success, time planning, business.
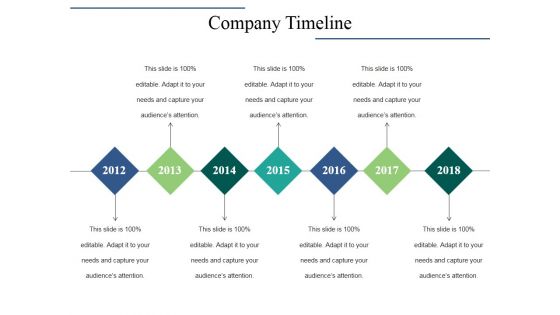
Company Timeline Ppt PowerPoint Presentation Summary Example Topics
This is a company timeline ppt powerpoint presentation summary example topics. This is a seven stage process. The stages in this process are year, growth, success, time planning, business.
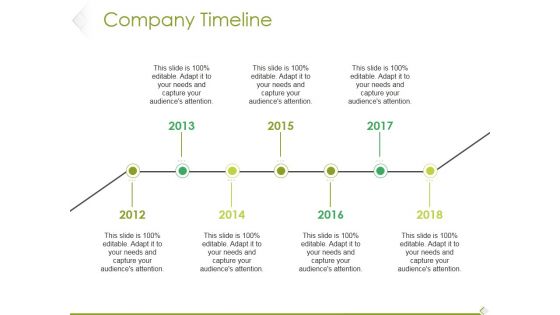
Company Timeline Ppt PowerPoint Presentation Infographic Template Template
This is a company timeline ppt powerpoint presentation infographic template template. This is a seven stage process. The stages in this process are year, growth, success, time planning, business.

Timeline Ppt PowerPoint Presentation Infographic Template Format Ideas
This is a timeline ppt powerpoint presentation infographic template format ideas. This is a four stage process. The stages in this process are year, growth, success, time planning, business.
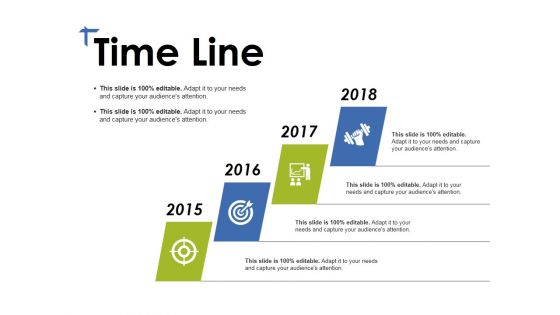
Time Line Ppt PowerPoint Presentation File Design Ideas
This is a time line ppt powerpoint presentation file design ideas. This is a four stage process. The stages in this process are year, growth, success, time planning, business.

Milestone Achieved Ppt PowerPoint Presentation Outline Graphic Tips
This is a milestone achieved ppt powerpoint presentation outline graphic tips. This is a five stage process. The stages in this process are year, growth, success, time planning, business.

Planning Process In TQM Ppt PowerPoint Presentation Infographics Graphics
This is a planning process in tqm ppt powerpoint presentation infographics graphics. This is a seven stage process. The stages in this process are year, growth, success, time planning, business.
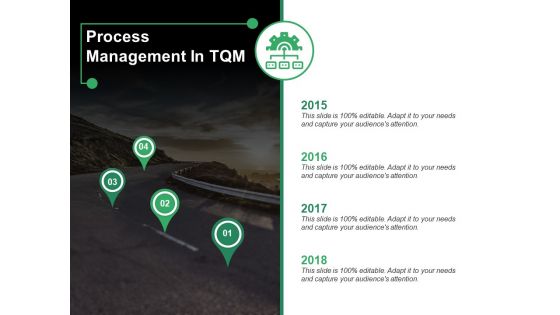
Process Management In TQM Ppt PowerPoint Presentation Inspiration Elements
This is a process management in tqm ppt powerpoint presentation inspiration elements. This is a four stage process. The stages in this process are year, growth, success, time planning, business.
Work Plan Implementation Schedule Ppt PowerPoint Presentation Icon Inspiration
This is a work plan implementation schedule ppt powerpoint presentation icon inspiration. This is a six stage process. The stages in this process are year, growth, success, time planning, business.

 Home
Home