Yearly Progress
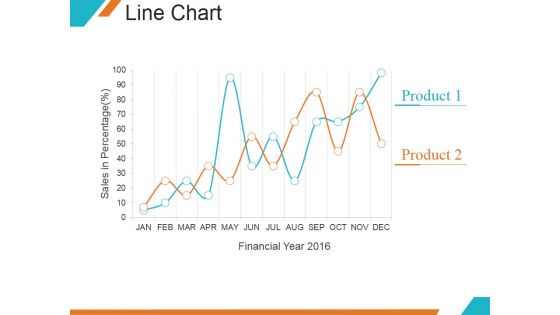
Line Chart Ppt PowerPoint Presentation Samples
This is a line chart ppt powerpoint presentation samples. This is a two stage process. The stages in this process are financial year, product, growth, marketing.
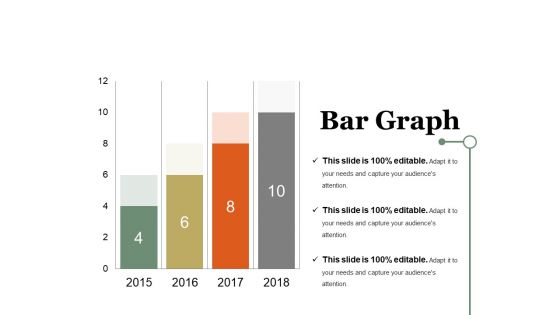
Bar Graph Ppt PowerPoint Presentation Summary Inspiration
This is a bar graph ppt powerpoint presentation summary inspiration. This is a four stage process. The stages in this process are graph, business, marketing, growth, years.
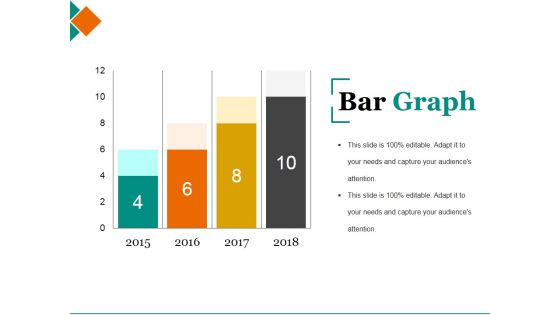
Bar Graph Ppt PowerPoint Presentation File Demonstration
This is a bar graph ppt powerpoint presentation file demonstration. This is a four stage process. The stages in this process are graph, year, success, growth, business.
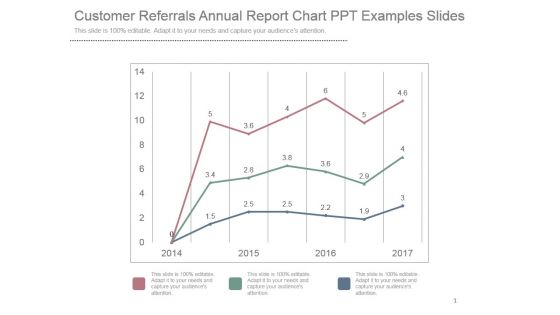
Customer Referrals Annual Report Chart Ppt Examples Slides
This is a customer referrals annual report chart ppt examples slides. This is a three stage process. The stages in this process are business, marketing, graph, success, years.

Column Chart Ppt PowerPoint Presentation Infographic Template Inspiration
This is a column chart ppt powerpoint presentation infographic template inspiration. This is a two stage process. The stages in this process are bar, years, business, marketing, success.

Area Chart Ppt PowerPoint Presentation Samples
This is a area chart ppt powerpoint presentation samples. This is a two stage process. The stages in this process are financial year, sales in percentage, jan, feb.
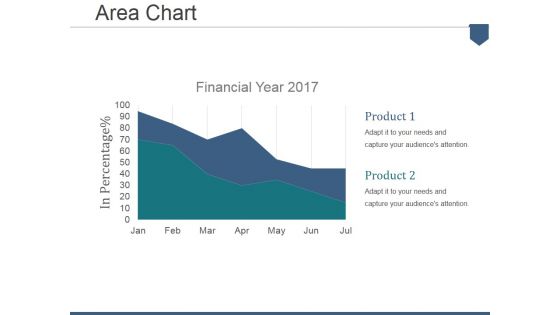
Area Chart Ppt PowerPoint Presentation Summary Example
This is a area chart ppt powerpoint presentation summary example. This is a two stage process. The stages in this process are financial year, in percentage, product.

Bar Graph Ppt PowerPoint Presentation Pictures Display
This is a bar graph ppt powerpoint presentation pictures display. This is a one stage process. The stages in this process are sales in percentage, financial year.

Line Chart Ppt PowerPoint Presentation Layouts Background Image
This is a line chart ppt powerpoint presentation layouts background image. This is a two stage process. The stages in this process are in percentage, in years, product.
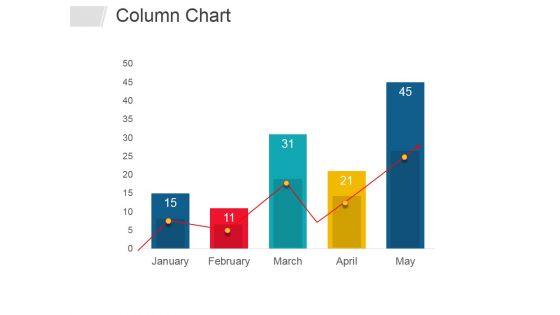
Column Chart Ppt PowerPoint Presentation Layouts Layout
This is a column chart ppt powerpoint presentation layouts layout. This is a five stage process. The stages in this process are column chart, years, business, management, marketing.

Combo Chart Ppt PowerPoint Presentation Slides Introduction
This is a combo chart ppt powerpoint presentation slides introduction. This is a four stage process. The stages in this process are profit, years, business, marketing, graph.
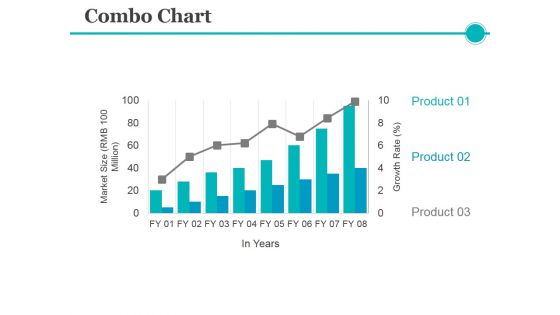
Combo Chart Ppt PowerPoint Presentation Pictures Layouts
This is a combo chart ppt powerpoint presentation pictures layouts. This is a eight stage process. The stages in this process are product, growth rate, market size, years.

Combo Chart Ppt PowerPoint Presentation File Model
This is a combo chart ppt powerpoint presentation file model. This is a eight stage process. The stages in this process are product, year, market size, business, marketing.
Line Chart Ppt PowerPoint Presentation Icon Inspiration
This is a line chart ppt powerpoint presentation icon inspiration. This is a two stage process. The stages in this process are product, financial years, sales in percentage.

Client Referrals Results Powerpoint Slide Show
This is a client referrals results powerpoint slide show. This is a three stage process. The stages in this process are series, year, success, planning, growth.
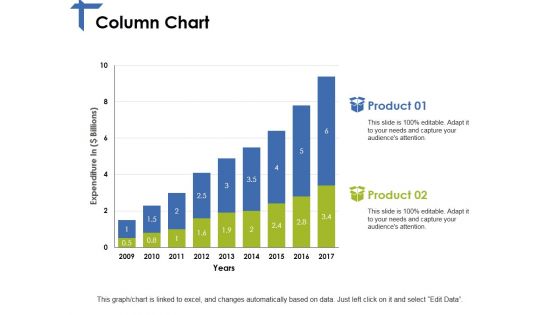
Column Chart Ppt PowerPoint Presentation Portfolio Topics
This is a column chart ppt powerpoint presentation portfolio topics. This is a two stage process. The stages in this process are expenditure, years, product, growth, success.

Demand Statistics Ppt PowerPoint Presentation Portfolio Guide
This is a demand statistics ppt powerpoint presentation portfolio guide. This is a four stage process. The stages in this process are demand, graph, growth, success, year.

Area Ppt PowerPoint Presentation Show
This is a area ppt powerpoint presentation show. This is a two stage process. The stages in this process are area, bar graph, growth, years, business.

Combo Chart Ppt PowerPoint Presentation Portfolio Infographics
This is a combo chart ppt powerpoint presentation portfolio infographics. This is a eight stage process. The stages in this process are market size, growth, years, finance, business.

Accomplishments To Date Ppt PowerPoint Presentation Ideas
This is a accomplishments to date ppt powerpoint presentation ideas. This is a four stage process. The stages in this process are icons, business, process, marketing, years.

Line Chart Ppt PowerPoint Presentation Pictures Layout
This is a line chart ppt powerpoint presentation pictures layout. This is a two stage process. The stages in this process are product, financial years, sales in percentage.
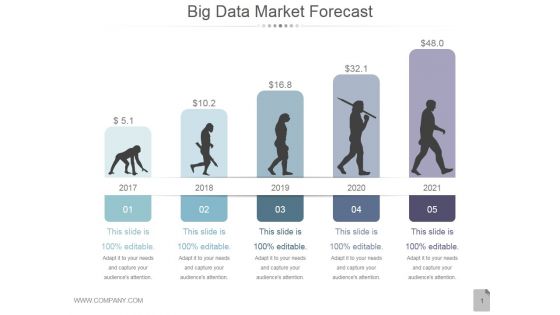
Big Data Market Forecast Ppt PowerPoint Presentation Clipart
This is a big data market forecast ppt powerpoint presentation clipart. This is a five stage process. The stages in this process are business, marketing, management, planning, years.
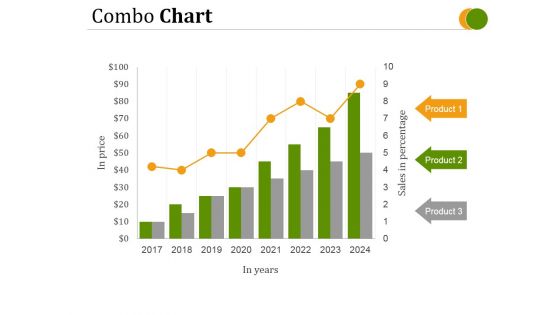
Combo Chart Ppt PowerPoint Presentation Deck
This is a combo chart ppt powerpoint presentation deck. This is a eight stage process. The stages in this process are in price, in years, product.

Line Chart Ppt PowerPoint Presentation Ideas Portfolio
This is a line chart ppt powerpoint presentation ideas portfolio. This is a two stage process. The stages in this process are line chart, in years, in percentage.
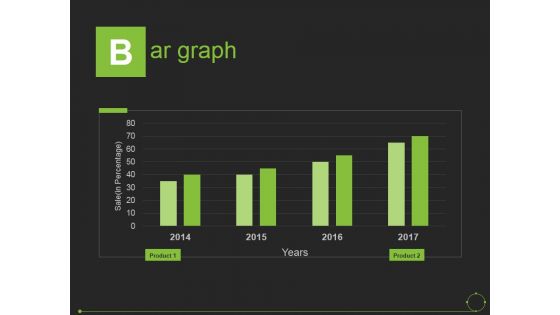
Bar Graph Ppt PowerPoint Presentation Portfolio Background
This is a bar graph ppt powerpoint presentation portfolio background. This is a four stage process. The stages in this process are sale, years, product.

Stacked Column Ppt PowerPoint Presentation Slides Introduction
This is a stacked column ppt powerpoint presentation slides introduction. This is a nine stage process. The stages in this process are years, profit, product, business, marketing.

Column Chart Ppt PowerPoint Presentation Ideas Styles
This is a column chart ppt powerpoint presentation ideas styles. This is a two stage process. The stages in this process are dollars, product, planning, business, years.

Column Chart Ppt PowerPoint Presentation Ideas Guidelines
This is a column chart ppt powerpoint presentation ideas guidelines. This is a two stage process. The stages in this process are column chart, product, year, business, marketing.
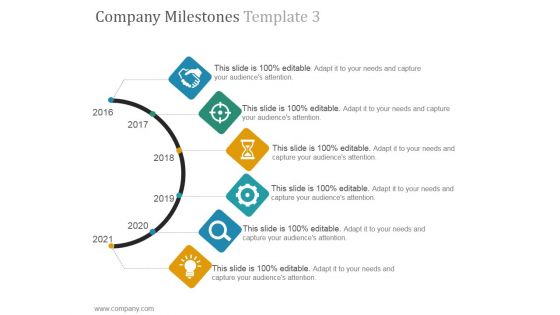
Company Milestones Template 3 Ppt PowerPoint Presentation Images
This is a company milestones template 3 ppt powerpoint presentation images. This is a six stage process. The stages in this process are icon, business, strategy, timeline, years.

Marketing Roadmap Planner Ppt Ideas
This is a marketing roadmap planner ppt ideas. This is a eight stage process. The stages in this process are finance, percentage, planning, year, growth.
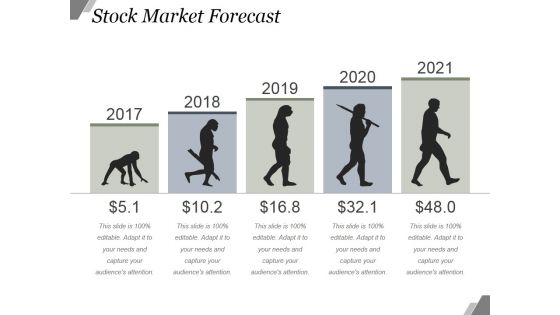
Stock Market Forecast Ppt PowerPoint Presentation Influencers
This is a stock market forecast ppt powerpoint presentation influencers. This is a five stage process. The stages in this process are timeline, growth, future, years, marketing.
Column Chart Ppt PowerPoint Presentation Icon Graphics Pictures
This is a column chart ppt powerpoint presentation icon graphics pictures. This is a nine stage process. The stages in this process are product, growth, year, chart, management.

Column Chart Ppt PowerPoint Presentation Show Images
This is a column chart ppt powerpoint presentation show images. This is a two stage process. The stages in this process are product, expenditure, years, bar graph, growth.

Stacked Line Chart Ppt PowerPoint Presentation Styles Graphics
This is a stacked line chart ppt powerpoint presentation styles graphics. This is a two stage process. The stages in this process are product, year, profit, percentage, growth.
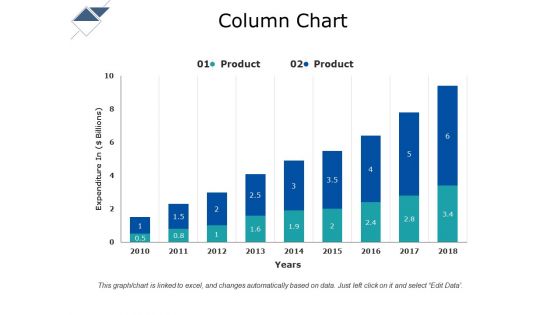
Column Chart Ppt PowerPoint Presentation Gallery Show
This is a column chart ppt powerpoint presentation gallery show. This is a two stage process. The stages in this process are column chart, product, year, expenditure, growth.
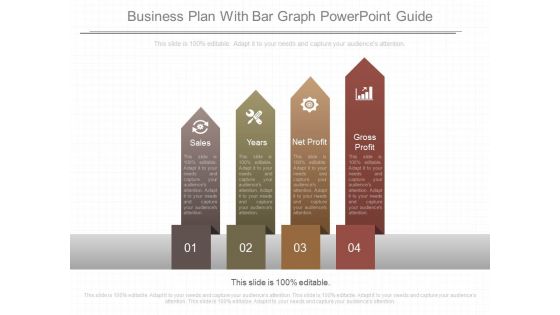
Business Plan With Bar Graph Powerpoint Guide
This is a business plan with bar graph powerpoint guide. This is a four stage process. The stages in this process are sales, years, net profit, gross profit.

Market Opportunity Analysis Ppt PowerPoint Presentation Templates
This is a market opportunity analysis ppt powerpoint presentation templates. This is a two stage process. The stages in this process are today, business, marketing, year, financial.
Timeline Ppt PowerPoint Presentation Icon
This is a timeline ppt powerpoint presentation icon. This is a five stage process. The stages in this process are year, timeline, management, future, strategy.

Magnifying Glass Ppt PowerPoint Presentation Background Designs
This is a magnifying glass ppt powerpoint presentation background designs. This is a five stage process. The stages in this process are years, magnify, search, success, time line.
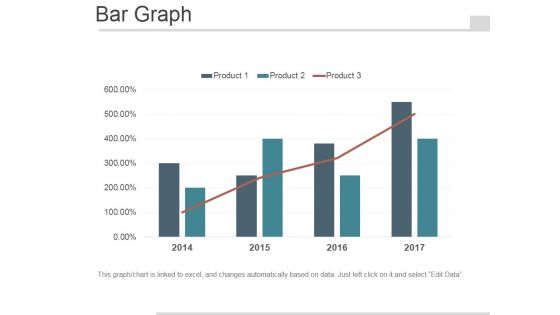
Bar Graph Ppt PowerPoint Presentation Design Ideas
This is a bar graph ppt powerpoint presentation design ideas. This is a four stage process. The stages in this process are business, management, marketing, finance, year.

Expense Model Template 1 Ppt PowerPoint Presentation Rules
This is a expense model template 1 ppt powerpoint presentation rules. This is a seven stage process. The stages in this process are month, year, icons, strategy.
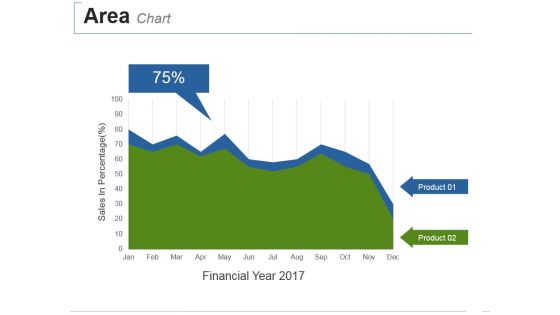
Area Chart Ppt PowerPoint Presentation Summary Deck
This is a area chart ppt powerpoint presentation summary deck. This is a two stage process. The stages in this process are sales in percentage, financial year.
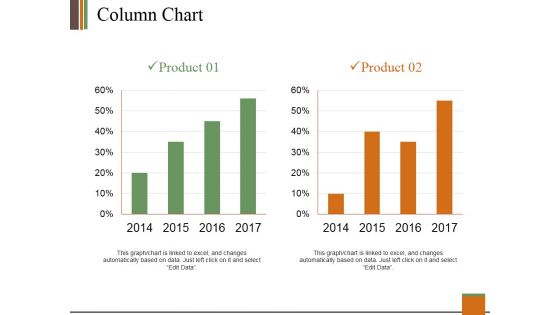
Column Chart Ppt PowerPoint Presentation Model Visuals
This is a column chart ppt powerpoint presentation model visuals. This is a two stage process. The stages in this process are product, year, graph, business, finance.
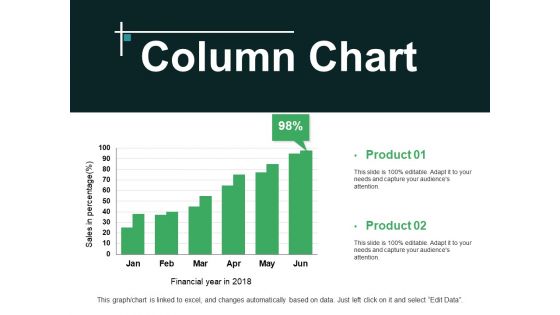
Column Chart Ppt PowerPoint Presentation Professional Aids
This is a column chart ppt powerpoint presentation professional aids. This is a two stage process. The stages in this process are product, sales in percentage, financial years.
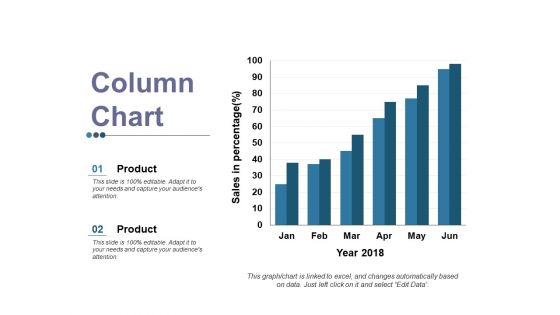
Column Chart Ppt PowerPoint Presentation Gallery Layout
This is a column chart ppt powerpoint presentation gallery layout. This is a two stage process. The stages in this process are product, sales in percentage, year.
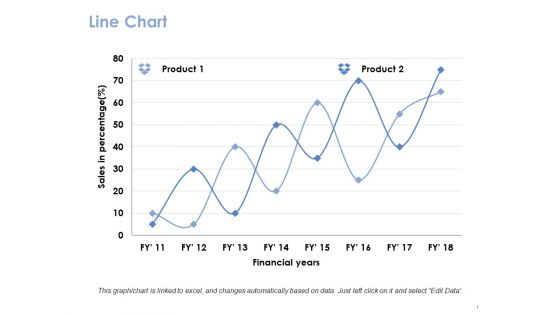
Line Chart Ppt PowerPoint Presentation Gallery Guide
This is a line chart ppt powerpoint presentation gallery guide. This is a two stage process. The stages in this process are product, financial years, sales in percentage.
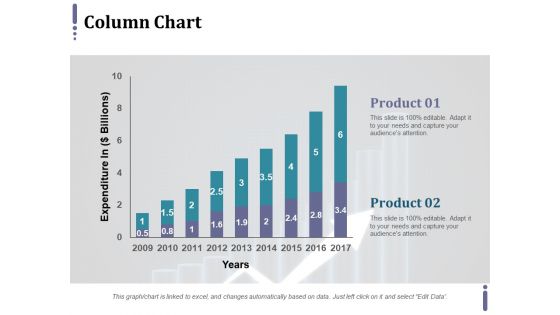
Column Chart Ppt PowerPoint Presentation Model Graphics Example
This is a column chart ppt powerpoint presentation model graphics example. This is a two stage process. The stages in this process are expenditure in, product, years.
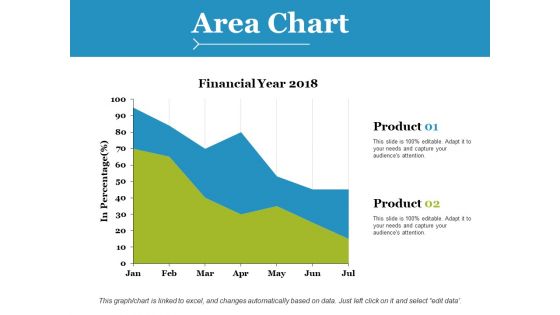
Area Chart Ppt PowerPoint Presentation Styles Brochure
This is a area chart ppt powerpoint presentation styles brochure. This is a two stage process. The stages in this process are product, financial years, in percentage.
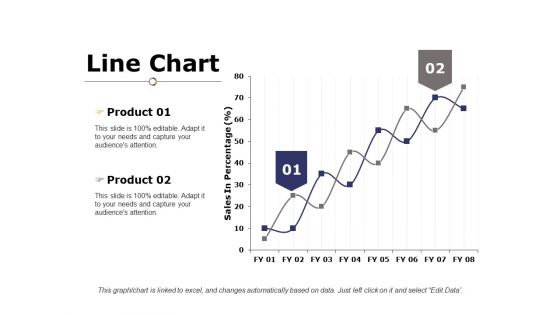
Line Chart Ppt PowerPoint Presentation Gallery Example Introduction
This is a line chart ppt powerpoint presentation portfolio shapes. This is a two stage process. The stages in this process are product, financial years, line chart.
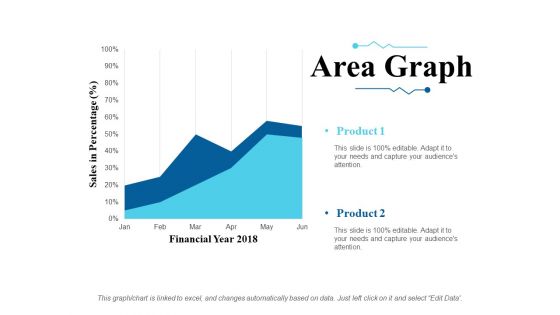
Area Graph Ppt PowerPoint Presentation Slides Ideas
This is a area graph ppt powerpoint presentation slides ideas. This is a two stage process. The stages in this process are sales in percentage, financial year, product.
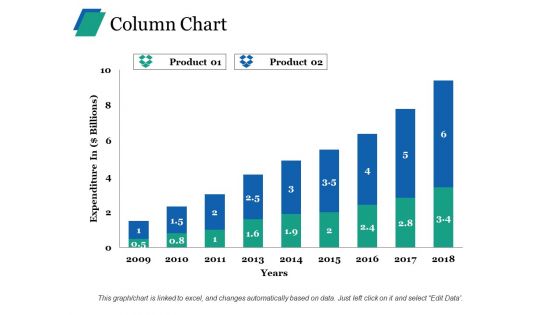
Column Chart Ppt PowerPoint Presentation Ideas Clipart
This is a column chart ppt powerpoint presentation ideas clipart. This is a two stage process. The stages in this process are product, expenditure in, years.

Column Chart Ppt PowerPoint Presentation Show Slideshow
This is a column chart ppt powerpoint presentation show slideshow. This is a two stage process. The stages in this process are product, expenditure, years.

Marketing Plan Timeline Ppt Sample Presentations
This is a marketing plan timeline ppt sample presentations. This is a seven stage process. The stages in this process are year, growth, business, marketing, success.
Stacked Area With Markers Ppt PowerPoint Presentation Icon
This is a stacked area with markers ppt powerpoint presentation icon. This is a two stage process. The stages in this process are business, growth, success, marketing, year.
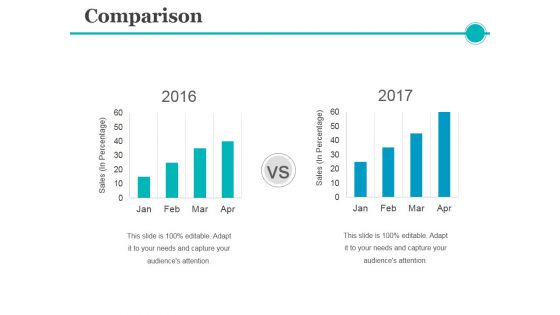
Comparison Ppt PowerPoint Presentation Layouts Example
This is a comparison ppt powerpoint presentation layouts example. This is a two stage process. The stages in this process are sales, year, success, growth, business.

Comparison Ppt PowerPoint Presentation Layouts Gridlines
This is a comparison ppt powerpoint presentation layouts gridlines. This is a three stage process. The stages in this process are year, growth, success, percentage, finance.

Business Milestones Success Timeline Ppt PowerPoint Presentation Picture
This is a business milestones success timeline ppt powerpoint presentation picture. This is a five stage process. The stages in this process are business, marketing, icons, years, timeline.

Timeline Ppt PowerPoint Presentation Information
This is a timeline ppt powerpoint presentation information. This is a five stage process. The stages in this process are business, marketing, year, future, icons.

Analyst Briefing Plan Ppt PowerPoint Presentation Portfolio
This is a analyst briefing plan ppt powerpoint presentation portfolio. This is a five stage process. The stages in this process are year, growth, business, planning, success.
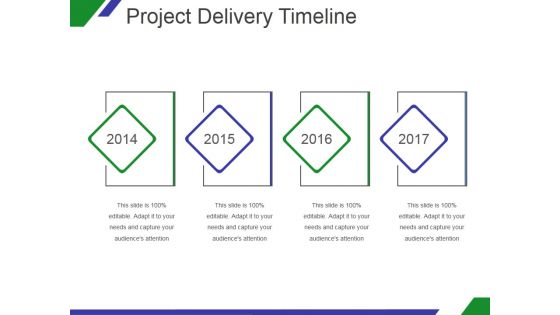
Project Delivery Timeline Ppt PowerPoint Presentation Slides
This is a project delivery timeline ppt powerpoint presentation slides. This is a four stage process. The stages in this process are year, growth, success, business.

 Home
Home