Work Plan
AI High Tech PowerPoint Templates Conventional System Vs Expert System Ppt Show Layout Ideas PDF
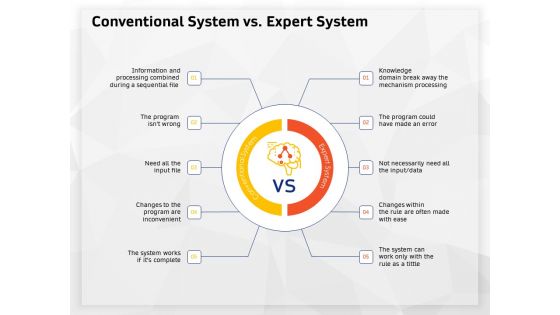
Presenting this set of slides with name ai high tech powerpoint templates conventional system vs expert system ppt show layout ideas pdf. This is a five stage process. The stages in this process are information and processing combined during a sequential file, knowledge domain break away the mechanism processing, changes to the program are inconvenient. This is a completely editable PowerPoint presentation and is available for immediate download. Download now and impress your audience.

AI Machine Learning Presentations Conventional System Vs Expert System Ppt Infographics Layouts PDF
Presenting this set of slides with name ai machine learning presentations conventional system vs expert system ppt infographics layouts pdf. This is a five stage process. The stages in this process are information and processing combined during a sequential file, knowledge domain break away the mechanism processing, changes to the program are inconvenient. This is a completely editable PowerPoint presentation and is available for immediate download. Download now and impress your audience.

WQM System Global Water Treatment Market By Industry Ppt PowerPoint Presentation Layouts Smartart PDF
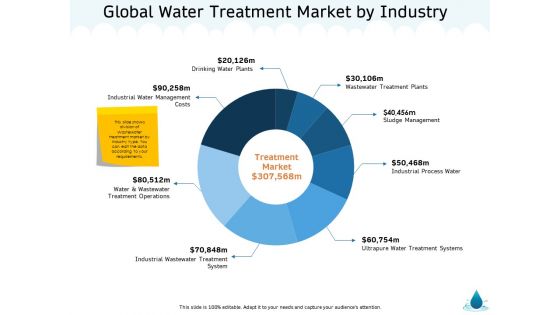
Presenting this set of slides with name wqm system global water treatment market by industry ppt powerpoint presentation layouts smartart pdf. The topics discussed in these slides are treatment market, wastewater treatment plants, sludge management, industrial process water, ultrapure water treatment systems, industrial wastewater treatment system, water and wastewater treatment operations, industrial water management costs, drinking water plants. This is a completely editable PowerPoint presentation and is available for immediate download. Download now and impress your audience.

Monitoring And Evaluating Water Quality Global Water Treatment Market By Industry Ppt Clipart PDF
Presenting this set of slides with name monitoring and evaluating water quality global water treatment market by industry ppt clipart pdf. The topics discussed in these slides are industrial water management costs, drinking water plants, wastewater treatment plants, sludge management, industrial process water, ultrapure water treatment systems, industrial wastewater treatment system, water and wastewater treatment operations. This is a completely editable PowerPoint presentation and is available for immediate download. Download now and impress your audience.
Water NRM Global Water Treatment Market By Industry Ppt Pictures Inspiration PDF
Presenting this set of slides with name water nrm global water treatment market by industry ppt pictures inspiration pdf. The topics discussed in these slides are sludge management, industrial process water, ultrapure water treatment systems, industrial wastewater treatment system, drinking water plants, industrial water management costs. This is a completely editable PowerPoint presentation and is available for immediate download. Download now and impress your audience.
Estimated Recruitment Efficiency Status Of The Company Diagrams PDF
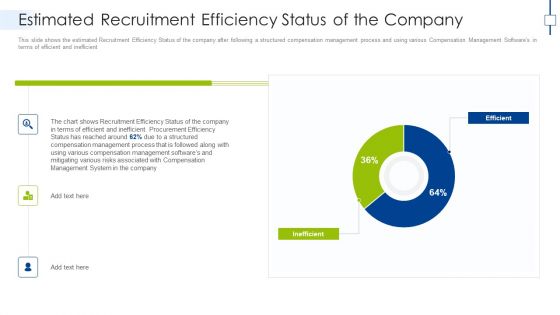
This slide shows the estimated Recruitment Efficiency Status of the company after following a structured compensation management process and using various Compensation Management Softwares in terms of efficient and inefficient. Deliver and pitch your topic in the best possible manner with this estimated recruitment efficiency status of the company diagrams pdf. Use them to share invaluable insights on inefficient, efficient and impress your audience. This template can be altered and modified as per your expectations. So, grab it now.

How To Overcome The Security Awareness Training Program Challenges Infographics PDF
The purpose of this is to highlight various solutions which can be used to overcome the cyber security awareness challenges. The key solutions covered in the slide are introducing dynamic courses, fully managed training program, convenient program etc. Create an editable How To Overcome The Security Awareness Training Program Challenges Infographics PDF that communicates your idea and engages your audience. Whether you are presenting a business or an educational presentation, pre-designed presentation templates help save time. How To Overcome The Security Awareness Training Program Challenges Infographics PDF is highly customizable and very easy to edit, covering many different styles from creative to business presentations. Slidegeeks has creative team members who have crafted amazing templates. So, go and get them without any delay.
Computer Simulation Human Thinking Selecting Suitable Cognitive Computing Platform Brochure PDF
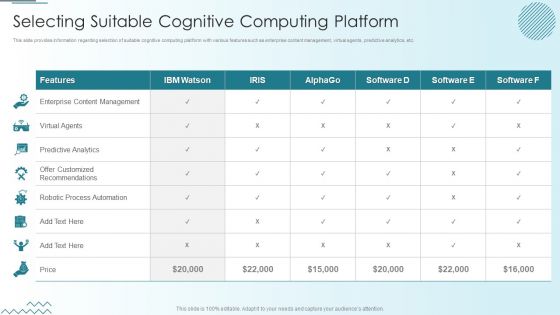
This slide provides information regarding selection of suitable cognitive computing platform with various features such as enterprise content management, virtual agents, predictive analytics, etc. Deliver and pitch your topic in the best possible manner with this Computer Simulation Human Thinking Selecting Suitable Cognitive Computing Platform Brochure PDF. Use them to share invaluable insights on Enterprise Content Management, Virtual Agents, Predictive Analytics and impress your audience. This template can be altered and modified as per your expectations. So, grab it now.
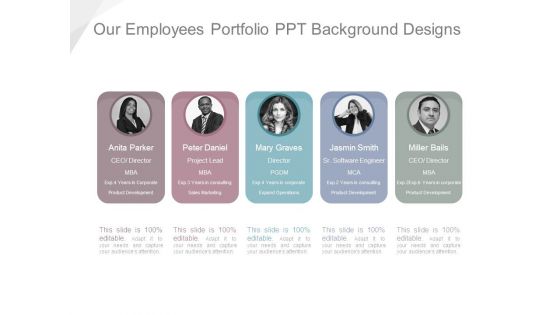
Our Employees Portfolio Ppt Background Designs
This is a our employees portfolio ppt background designs. This is a five stage process. The stages in this process are anita parker ceo director mba, peter daniel project lead mba, mary graves director pgdm, jasmin smith software engineer mca, miller bails ceo director mba.

Ppt 4 Colorful PowerPoint Background Divisions Forming Circle Templates
PPT 4 colorful powerpoint background divisions forming circle Templates-This PowerPoint Diagram consists of four colorful divisions forming a circle. It is useful to explain four different components required in Business. It signifies constituent, factor, fixings, ingredient, item, making, makings, peripheral, piece, plug-in, segment, unit etc.-Can be used for presentations on 3d, background, brochure, business, catalog, chart, circle, concept, corporate, design, development, diagram, division, economic, financial, flyer, graphic, illustration, manager, progress, round, scheme, section, situation, state, tab, vector, wallpaper-PPT 4 colorful powerpoint background divisions forming circle Templates

Ppt Go Green PowerPoint Presentation Division Illustrating Third Issue Templates
PPT go green powerpoint presentation division illustrating third issue Templates-This PowerPoint Diagram consists of four divisions forming a circle. This Diagram explains one issue using Green part of division. It signifies diagnosis, disjuncture, dismemberment, disporting, disseverance, dissolution, distinguishing, distribution, disunion, conflict, dispute, and dissonance.-Can be used for presentations on 3d, backdrop, background, brochure, business, catalog, chart, circle, concept, corporate, design, development, diagram, division, economic, economy, eps10, financial, flyer, four, graph, graphic, human, illustration, image, man, manager, one, part, poster, print, progress, round, scheme, section, situation, state, tab, vector, wallpaper-PPT go green powerpoint presentation division illustrating third issue Templates

Ppt Orange Division Illustrating Four Issue PowerPoint Templates
PPT orange division illustrating four issue PowerPoint Templates-This PowerPoint Diagram consists of four divisions forming a circle. This Diagram explains one issue using Orange part of division. It signifies diagnosis, disjuncture, dismemberment, disporting, distinguishing, distribution, disunion, conflict, dispute, and dissonance.-Can be used for presentations on 3d, backdrop, background, brochure, business, catalog, chart, circle, concept, corporate, design, development, diagram, division, economic, economy, eps10, financial, flyer, four, graph, graphic, human, illustration, image, man, manager, one, part, poster, print, progress, round, scheme, section, situation, state, tab, vector, wallpaper-PPT orange division illustrating four issue PowerPoint Templates

Christmas Hanging Balls Picture Ornament PowerPoint Templates Ppt Backgrounds For Slides 0113
We present our Christmas Hanging Balls Picture Ornament PowerPoint Templates PPT Backgrounds For Slides 0113.Present our Spheres PowerPoint Templates because Our PowerPoint Templates and Slides will let you Hit the target. Go the full distance with ease and elan. Present our Christmas PowerPoint Templates because It will Raise the bar of your Thoughts. They are programmed to take you to the next level. Download and present our Holidays PowerPoint Templates because You are an avid believer in ethical practices. Highlight the benefits that accrue with our PowerPoint Templates and Slides. Use our Festival PowerPoint Templates because You have gained great respect for your brilliant ideas. Use our PowerPoint Templates and Slides to strengthen and enhance your reputation. Download our Shapes PowerPoint Templates because You can Inspire your team with our PowerPoint Templates and Slides. Let the force of your ideas flow into their minds.Use these PowerPoint slides for presentations relating to Hanging christmas balls, Spheres, Christmas, Holidays, Festival, Shapes. The prominent colors used in the PowerPoint template are Red, Yellow, White. Customers tell us our Christmas Hanging Balls Picture Ornament PowerPoint Templates PPT Backgrounds For Slides 0113 are specially created by a professional team with vast experience. They diligently strive to come up with the right vehicle for your brilliant Ideas. Customers tell us our Holidays PowerPoint templates and PPT Slides provide you with a vast range of viable options. Select the appropriate ones and just fill in your text. Customers tell us our Christmas Hanging Balls Picture Ornament PowerPoint Templates PPT Backgrounds For Slides 0113 provide great value for your money. Be assured of finding the best projection to highlight your words. Professionals tell us our balls PowerPoint templates and PPT Slides are specially created by a professional team with vast experience. They diligently strive to come up with the right vehicle for your brilliant Ideas. We assure you our Christmas Hanging Balls Picture Ornament PowerPoint Templates PPT Backgrounds For Slides 0113 are incredible easy to use. Professionals tell us our Holidays PowerPoint templates and PPT Slides will make the presenter successul in his career/life.

Marketing And Promotion Automation Implementation Manual Ppt Powerpoint Presentation Complete Deck
With this completely editable presentation template, our Marketing And Promotion Automation Implementation Manual Ppt Powerpoint Presentation Complete Deck offers a new proposition for business managers to consider. When expressed as a written form in the shape of a PPT presentation business concepts assume a new dimension. This presentation of seventy slides on Presentation will allow you to showcase your expert to roomful of people in business domains for purposeful exchange of ideas. We list all facets of business that require a bit of effort to grasp. The aim is to ensure the presenter and the audience can arrive at an agreement for a business deal. If this is done, our purpose is solved. Download now.

IT Industry Market Research To Identify Target Audience Ppt Powerpoint Presentation Complete Deck With Slides
With this completely editable presentation template, our IT Industry Market Research To Identify Target Audience Ppt Powerpoint Presentation Complete Deck With Slides offers a new proposition for business managers to consider. When expressed as a written form in the shape of a PPT presentation business concepts assume a new dimension. This presentation of fifty slides on Presentation will allow you to showcase your expert to roomful of people in business domains for purposeful exchange of ideas. We list all facets of business that require a bit of effort to grasp. The aim is to ensure the presenter and the audience can arrive at an agreement for a business deal. If this is done, our purpose is solved. Download now.

Enhancing Customer Service Operations Using CRM Technology Ppt Powerpoint Presentation Complete Deck
With this completely editable presentation template,our Enhancing Customer Service Operations Using CRM Technology Ppt Powerpoint Presentation Complete Deck offers a new proposition for business managers to consider. When expressed as a written form in the shape of a PPT presentation business concepts assume a new dimension. This presentation of sixty six slides on Presentation will allow you to showcase your expert to roomful of people in business domains for purposeful exchange of ideas. We list all facets of business that require a bit of effort to grasp. The aim is to ensure the presenter and the audience can arrive at an agreement for a business deal. If this is done,our purpose is solved. Download now.

Carelulu Shareholders Fund Raising Pitch Deck Ppt Powerpoint Presentation Complete Deck With Slides
With this completely editable presentation template, our Carelulu Shareholders Fund Raising Pitch Deck Ppt Powerpoint Presentation Complete Deck With Slides offers a new proposition for business managers to consider. When expressed as a written form in the shape of a PPT presentation business concepts assume a new dimension. This presentation of thirty eight slides on Presentation will allow you to showcase your expert to roomful of people in business domains for purposeful exchange of ideas. We list all facets of business that require a bit of effort to grasp. The aim is to ensure the presenter and the audience can arrive at an agreement for a business deal. If this is done, our purpose is solved. Download now.

Data Lineage Implementation Overview Of Data Lineage By Data Tagging Technique Structure PDF
This slide represents the overview of data lineage by parsing technique that reads the logic behind the automatic data processing. It also includes the tools and programming languages used by this technique such as STL logic, SQL, XML, Java and so on. Create an editable Data Lineage Implementation Overview Of Data Lineage By Data Tagging Technique Structure PDF that communicates your idea and engages your audience. Whether youre presenting a business or an educational presentation, pre designed presentation templates help save time. Data Lineage Implementation Overview Of Data Lineage By Data Tagging Technique Structure PDF is highly customizable and very easy to edit, covering many different styles from creative to business presentations. Slidegeeks has creative team members who have crafted amazing templates. So, go and get them without any delay.
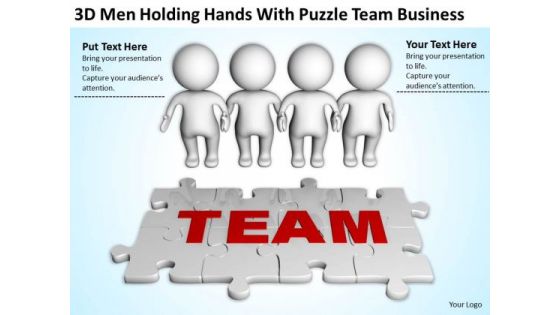
Business Persons Hands With Puzzle Team PowerPoint Templates Download
We present our business persons hands with puzzle team powerpoint templates download.Download our Puzzles or Jigsaws PowerPoint Templates because You can Give birth to your ideas with our PowerPoint Templates and Slides. See them grow big and strong in record time. Download and present our People PowerPoint Templates because you should once Tap the ingenuity of our PowerPoint Templates and Slides. They are programmed to succeed. Download our Leadership PowerPoint Templates because You are an avid believer in ethical practices. Highlight the benefits that accrue with our PowerPoint Templates and Slides. Download our Communication PowerPoint Templates because Our PowerPoint Templates and Slides are the chords of your song. String them along and provide the lilt to your views. Download our Business PowerPoint Templates because You can Rise to the occasion with our PowerPoint Templates and Slides. You will bring your audience on their feet in no time.Use these PowerPoint slides for presentations relating to 3d, achieve, achievement, business, cgi, community, company, concept, connection, cooperation, creativity, finish, four, friendship, game, goal, grey, group, hands, happy, holding, illustration, jigsaw, job, join, men, motivation, organization, part, partnership, people, person, pieces, puzzle, red, relationship, render, solution, standing, strategy, succeed, success, symbol, team, teamwork, together, unite, unity, white, word. The prominent colors used in the PowerPoint template are Red, Gray, Black. PowerPoint presentation experts tell us our business persons hands with puzzle team powerpoint templates download are specially created by a professional team with vast experience. They diligently strive to come up with the right vehicle for your brilliant Ideas. People tell us our company PowerPoint templates and PPT Slides effectively help you save your valuable time. We assure you our business persons hands with puzzle team powerpoint templates download effectively help you save your valuable time. We assure you our cgi PowerPoint templates and PPT Slides are aesthetically designed to attract attention. We guarantee that they will grab all the eyeballs you need. Presenters tell us our business persons hands with puzzle team powerpoint templates download will generate and maintain the level of interest you desire. They will create the impression you want to imprint on your audience. Use our company PowerPoint templates and PPT Slides will make the presenter successul in his career/life.

Deliveroo Capital Fundraising Pitch Deck Technology Used By The Company Ppt Model Diagrams PDF
This slide shows the advanced technology that is used by Deliveroo in its operation which is related to an algorithm that determines an effective way of order distribution and a machine learning program that helps to determine the time for preparing the meal that helps to streamline the delivery process. Presenting deliveroo capital fundraising pitch deck technology used by the company ppt model diagrams pdf to provide visual cues and insights. Share and navigate important information on two stages that need your due attention. This template can be used to pitch topics like technology used by the company. In addtion, this PPT design contains high resolution images, graphics, etc, that are easily editable and available for immediate download.
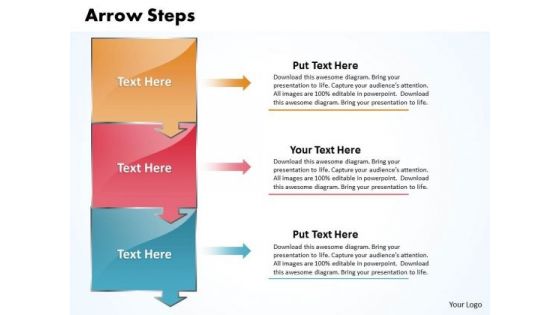
Ppt Arrow Create PowerPoint Macro 3 Phase Diagram Templates
PPT arrow create powerpoint macro 3 phase diagram Templates-Use this Arrow Steps Diagram to define the boundaries of a process, and develop a common base of knowledge about a process.-PPT arrow create powerpoint macro 3 phase diagram Templates-Advertising, Arrow, Background, Card, Choice, Concept, Corporate, Creative, Design, Flow, Illustration, Graphic, Instruction, Label, Layout, Manual, Modern, Number, Options, Order, Paper, Product, Progress, Progress Concept, Progress Report, Promotion, Sequence, Step, Symbol, Tutorial, Version

Ppt Arrow Create PowerPoint Macro 4 Stages Templates
PPT arrow create powerpoint macro 4 stages Templates-This is a Process Arrows layout image. Use This PPT to show multiple groups of information or steps and sub-steps in a task, process, or workflow-PPT arrow create powerpoint macro 4 stages Templates-Advertising, Arrow, Background, Card, Choice, Concept, Corporate, Creative, Design, Flow, Illustration, Graphic, Instruction, Label, Layout, Manual, Modern, Number, Options, Order, Page, Paper, Product, Progress, Progress Concept, Progress Report, Promotion, Sequence, Step, Symbol, Tab, Tutorial, Version
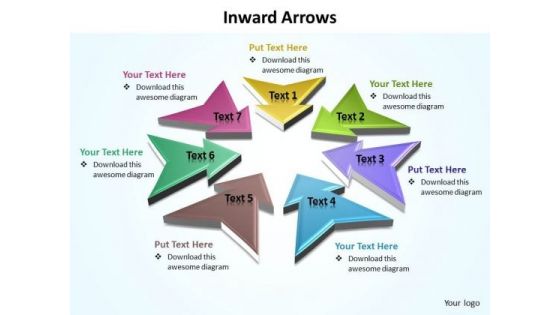
Ppt 7 Colorful PowerPoint Background Arrows Pointing Inwards Templates
PPT 7 colorful powerpoint background arrows pointing inwards Templates-This diagram can help in showing an organized view of business services and processes. This Diagram imitates the concept of connected, consecutive, continued, day and night, endless, everlasting, extended etc.-PPT 7 colorful powerpoint background arrows pointing inwards Templates-7 Different, Abstract, Background, Communication, Concept, Conceptual, Design, Diagram, Direction, Elements, Exchange, Flow, Flowchart, Graph, Graphic, Icon, Pointing, Process, Sign, Symbol, Icons

Ppt 3d Literature Circle PowerPoint Presentations Shaped Text Arrow Templates
PPT 3d literature circle powerpoint presentations shaped text arrow Templates-This 3D Business PowerPoint Diagram shows the circular arrows connected to each other signifying step by step execution. This Diagram can be used to represent Process charts, Waterfall chart, Sales process chart and blank process etc.-PPT 3d literature circle powerpoint presentations shaped text arrow Templates-3d, Advertisement, Advertising, Arrow, Border, Business, Circles, Collection, Customer, Design, Element, Icon, Idea, Illustration, Info, Information, Isolated, Label, Light, Location, Needle, New, Notification, Notify, Point, Pointer, Promotion, Role, Rounded
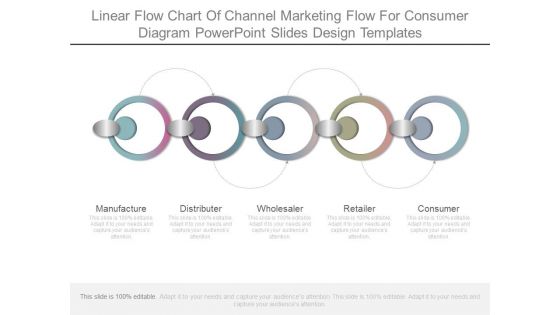
Linear Flow Chart Of Channel Marketing Flow For Consumer Diagram Powerpoint Slides Design Templates
This is a linear flow chart of channel marketing flow for consumer diagram powerpoint slides design templates. This is a five stage process. The stages in this process are manufacture, distributor, wholesaler, retailer, consumer.
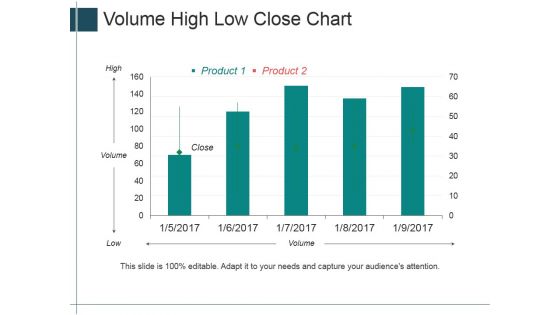
Volume High Low Close Chart Ppt PowerPoint Presentation Summary Layout Ideas
This is a volume high low close chart ppt powerpoint presentation summary layout ideas. This is a five stage process. The stages in this process are high, volume, low, close, product.
Competitive Analysis Template 6 Scatter Chart Ppt PowerPoint Presentation Icon Example Topics
This is a competitive analysis template 6 scatter chart ppt powerpoint presentation icon example topics. This is a eight stage process. The stages in this process are users interface, data import, example, pricing, support, update, tutorials, easy to use.
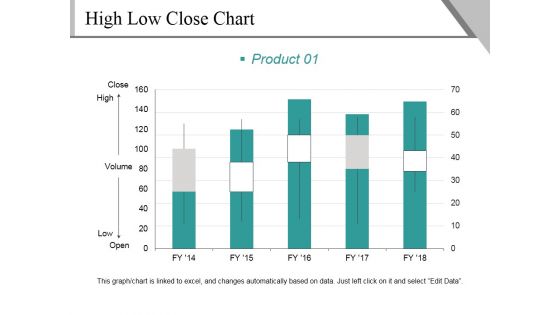
High Low Close Chart Template 1 Ppt PowerPoint Presentation Infographics Graphics Design
This is a high low close chart template 1 ppt powerpoint presentation infographics graphics design. This is a five stage process. The stages in this process are close, high, volume, low, open, product.
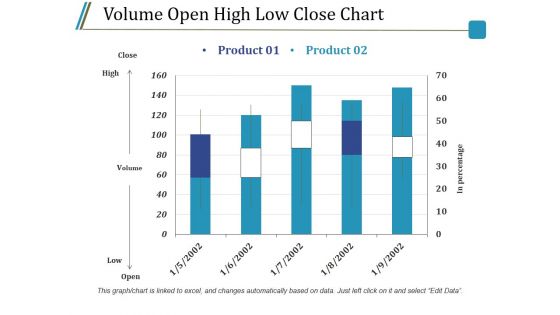
Volume Open High Low Close Chart Ppt PowerPoint Presentation Infographics Guide
This is a volume open high low close chart ppt powerpoint presentation infographics guide. This is a two stage process. The stages in this process are close, high, volume, low, open, product.
Volume Open High Low Close Chart Ppt PowerPoint Presentation Icon Design Inspiration
This is a volume open high low close chart ppt powerpoint presentation icon design inspiration. This is a three stage process. The stages in this process are close, high, low, volume, open.
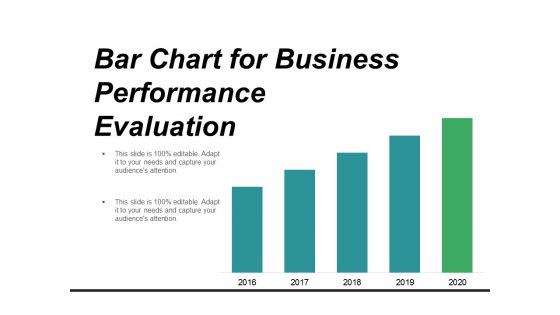
Bar Chart For Business Performance Evaluation Ppt PowerPoint Presentation Infographics Professional
This is a bar chart for business performance evaluation ppt powerpoint presentation infographics professional. This is a five stage process. The stages in this process are metrics icon, kpis icon, statistics icon.

Chart With Magnifying Glass For Business Research Ppt PowerPoint Presentation Inspiration Shapes
This is a chart with magnifying glass for business research ppt powerpoint presentation inspiration shapes. This is a two stage process. The stages in this process are metrics icon, kpis icon, statistics icon.

3D Bar Chart For Data Representation Ppt PowerPoint Presentation Model Graphic Tips
This is a 3d bar chart for data representation ppt powerpoint presentation model graphic tips. This is a four stage process. The stages in this process are art, colouring, paint brush.

3D Bar Chart For Percentage Values Comparison Ppt PowerPoint Presentation Professional Visual Aids
This is a 3d bar chart for percentage values comparison ppt powerpoint presentation professional visual aids. This is a five stage process. The stages in this process are art, colouring, paint brush.
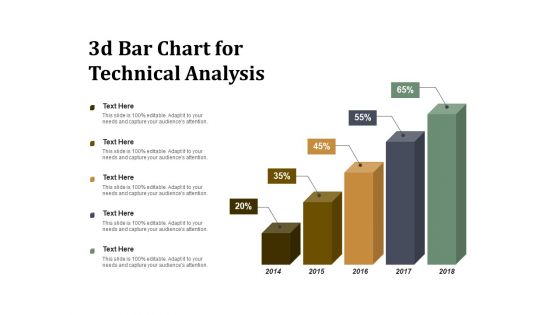
3D Bar Chart For Technical Analysis Ppt PowerPoint Presentation Summary Visuals
This is a 3d bar chart for technical analysis ppt powerpoint presentation summary visuals. This is a five stage process. The stages in this process are art, colouring, paint brush.
3D Bar Chart To Display Data Ppt PowerPoint Presentation Icon Design Inspiration
This is a 3d bar chart to display data ppt powerpoint presentation icon design inspiration. This is a four stage process. The stages in this process are art, colouring, paint brush.
3D Chart For Graphical Display Of Data Ppt PowerPoint Presentation Styles Icon
This is a 3d chart for graphical display of data ppt powerpoint presentation styles icon. This is a four stage process. The stages in this process are art, colouring, paint brush.
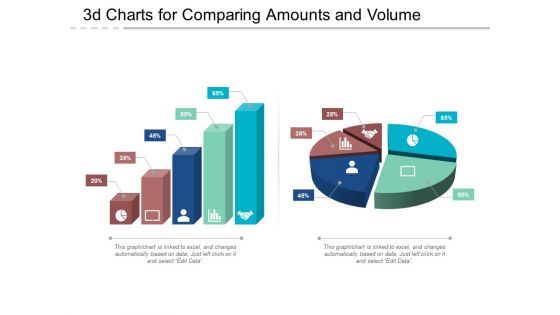
3D Charts For Comparing Amounts And Volume Ppt PowerPoint Presentation Show Deck
This is a 3d charts for comparing amounts and volume ppt powerpoint presentation show deck. This is a five stage process. The stages in this process are art, colouring, paint brush.

3D Pie Chart For Data Comparison Ppt PowerPoint Presentation Model Design Ideas
This is a 3d pie chart for data comparison ppt powerpoint presentation model design ideas. This is a six stage process. The stages in this process are art, colouring, paint brush.

Bar Charts For Business Performance Analysis Ppt PowerPoint Presentation Show Slideshow
This is a bar charts for business performance analysis ppt powerpoint presentation show slideshow. This is a two stage process. The stages in this process are compare, comparison of two, competitive analysis.

Career Progression And Growth Chart Ppt PowerPoint Presentation Professional Design Inspiration
This is a career progression and growth chart ppt powerpoint presentation professional design inspiration. This is a three stage process. The stages in this process are career progression, career aspiration, career promotion powerpoint presentation slides.
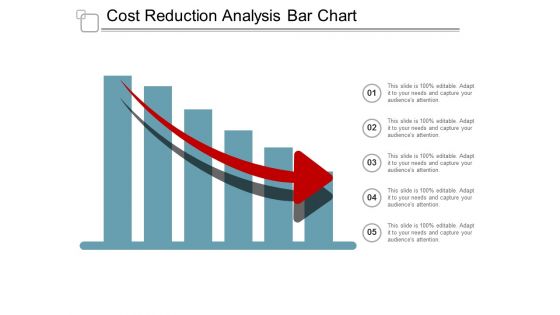
Cost Reduction Analysis Bar Chart Ppt Powerpoint Presentation File Graphics Design
This is a cost reduction analysis bar chart ppt powerpoint presentation file graphics design. This is a five stage process. The stages in this process are data analysis, data science, information science.

Computer Screen With Pie Chart For Data Analysis Ppt PowerPoint Presentation Show Picture
This is a computer screen with pie chart for data analysis ppt powerpoint presentation show picture. This is a six stage process. The stages in this process are computer icon, desktop icon, laptop screen icon.
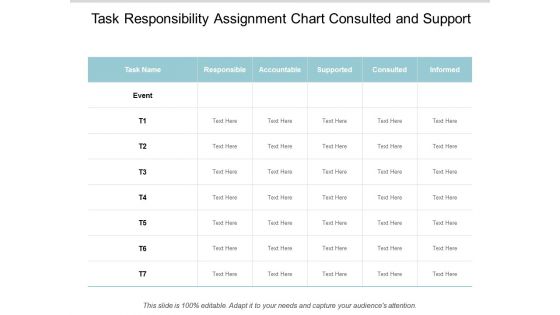
Task Responsibility Assignment Chart Consulted And Support Ppt Powerpoint Presentation Styles Background
This is a task responsibility assignment chart consulted and support ppt powerpoint presentation styles background. This is a seven stage process. The stages in this process are authority matrix, responsibility matrix, leadership matrix.

Bar Chart With Magnifying Glass For Financial Analysis Ppt Powerpoint Presentation Infographics Designs Download
This is a bar chart with magnifying glass for financial analysis ppt powerpoint presentation infographics designs download. This is a three stage process. The stages in this process are business metrics, business kpi, business dashboard.

Business Analysis Data Charts And Reports Ppt Powerpoint Presentation Ideas Portrait
This is a business analysis data charts and reports ppt powerpoint presentation ideas portrait. This is a three stage process. The stages in this process are business metrics, business kpi, business dashboard.
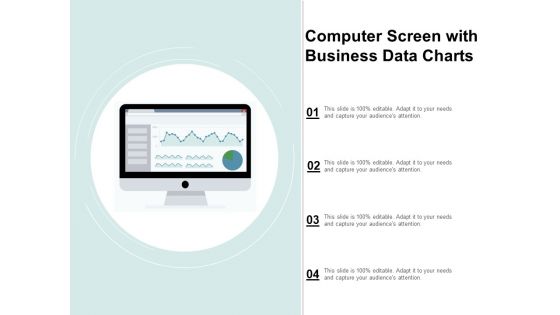
Computer Screen With Business Data Charts Ppt Powerpoint Presentation Show Vector
This is a computer screen with business data charts ppt powerpoint presentation show vector. This is a four stage process. The stages in this process are business metrics, business kpi, business dashboard.
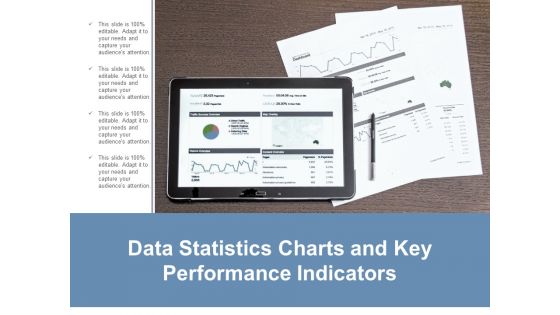
Data Statistics Charts And Key Performance Indicators Ppt Powerpoint Presentation Layouts Guide
This is a data statistics charts and key performance indicators ppt powerpoint presentation layouts guide. This is a four stage process. The stages in this process are business metrics, business kpi, business dashboard.

Financial Charts And Graphs For Statistical Analysis Ppt Powerpoint Presentation Show Layout
This is a financial charts and graphs for statistical analysis ppt powerpoint presentation show layout. This is a four stage process. The stages in this process are business metrics, business kpi, business dashboard.
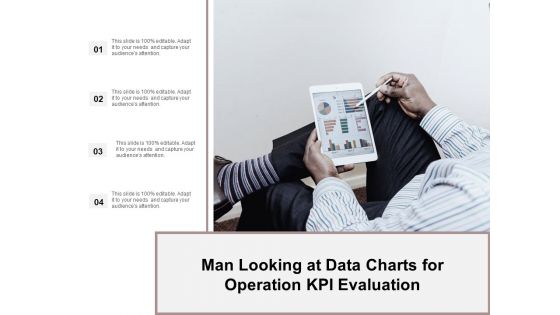
Man Looking At Data Charts For Operation Kpi Evaluation Ppt Powerpoint Presentation Ideas Demonstration
This is a man looking at data charts for operation kpi evaluation ppt powerpoint presentation ideas demonstration. This is a four stage process. The stages in this process are business metrics, business kpi, business dashboard.
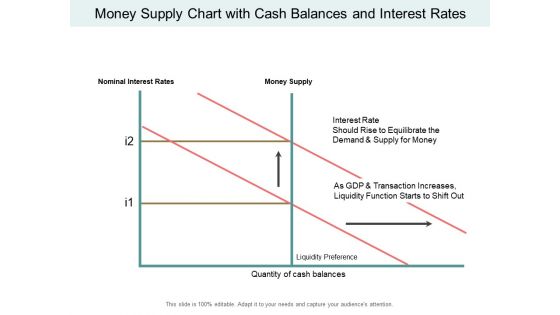
Money Supply Chart With Cash Balances And Interest Rates Ppt PowerPoint Presentation Inspiration Background Images
This is a money supply chart with cash balances and interest rates ppt powerpoint presentation inspiration background images. This is a two stage process. The stages in this process are liquidity, cash assets, solvency.
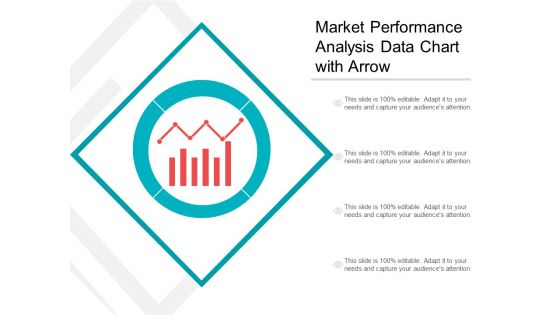
Market Performance Analysis Data Chart With Arrow Ppt PowerPoint Presentation Inspiration Graphics
This is a market performance analysis data chart with arrow ppt powerpoint presentation inspiration graphics. This is a four stage process. The stages in this process are marketing analytics, marketing performance, marketing discovery.
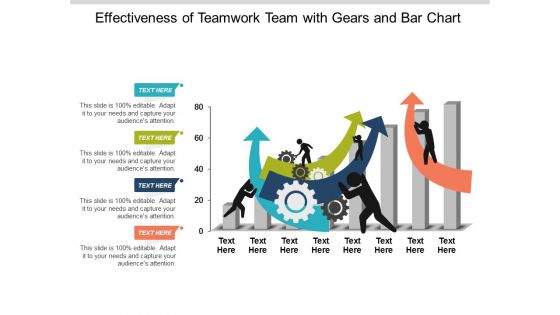
Effectiveness Of Teamwork Team With Gears And Bar Chart Ppt Powerpoint Presentation Ideas Information
This is a effectiveness of teamwork team with gears and bar chart ppt powerpoint presentation ideas information. This is a four stage process. The stages in this process are team performance, member performance, group performance.
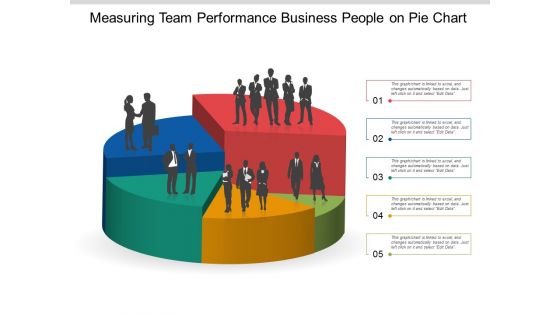
Measuring Team Performance Business People On Pie Chart Ppt Powerpoint Presentation Gallery Smartart
This is a measuring team performance business people on pie chart ppt powerpoint presentation gallery smartart. This is a five stage process. The stages in this process are team performance, member performance, group performance.
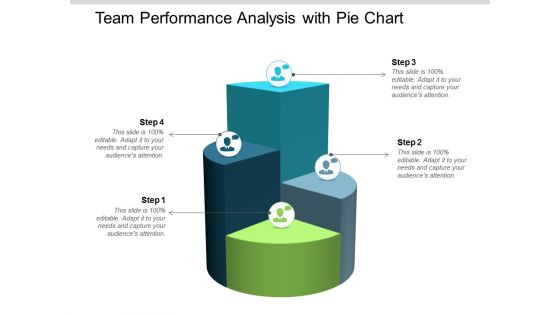
Team Performance Analysis With Pie Chart Ppt Powerpoint Presentation Infographic Template Slideshow
This is a team performance analysis with pie chart ppt powerpoint presentation infographic template slideshow. This is a four stage process. The stages in this process are team performance, member performance, group performance.
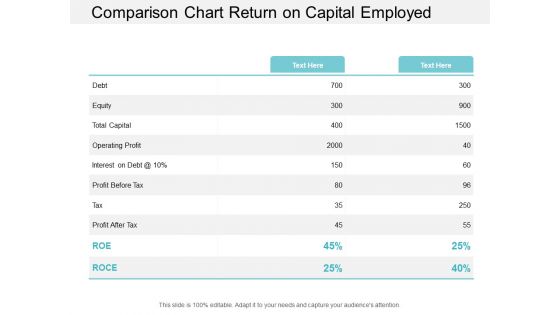
Comparison Chart Return On Capital Employed Ppt PowerPoint Presentation Portfolio Templates
This is a comparison chart return on capital employed ppt powerpoint presentation portfolio templates. This is a two stage process. The stages in this process are accounting ratio, roce, return on capital employed.

Return On Capital Employed Market Trend Chart Ppt PowerPoint Presentation Styles Examples
This is a return on capital employed market trend chart ppt powerpoint presentation styles examples. This is a two stage process. The stages in this process are accounting ratio, roce, return on capital employed.

Return On Capital Employed Product Performance Chart Ppt PowerPoint Presentation Portfolio Visuals
This is a return on capital employed product performance chart ppt powerpoint presentation portfolio visuals. This is a three stage process. The stages in this process are accounting ratio, roce, return on capital employed.
Percentage Value Comparison Pie Chart Icon Ppt PowerPoint Presentation Model Clipart Images
This is a percentage value comparison pie chart icon ppt powerpoint presentation model clipart images. This is a three stage process. The stages in this process are percentage icon, dividend icon, portion icon.
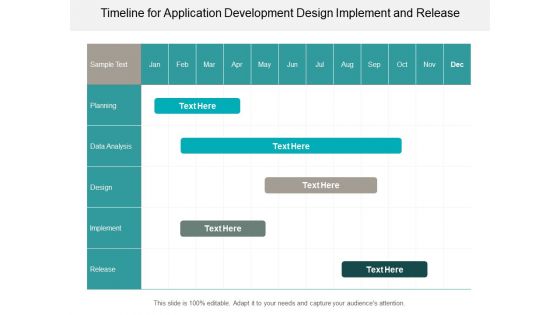
Timeline For Application Development Design Implement And Release Ppt PowerPoint Presentation Diagram Graph Charts
This is a timeline for application development design implement and release ppt powerpoint presentation diagram graph charts. This is a five stage process. The stages in this process are overlapping timeline, overlapping roadmap, overlapping linear roadmap.

 Home
Home