Work Plan
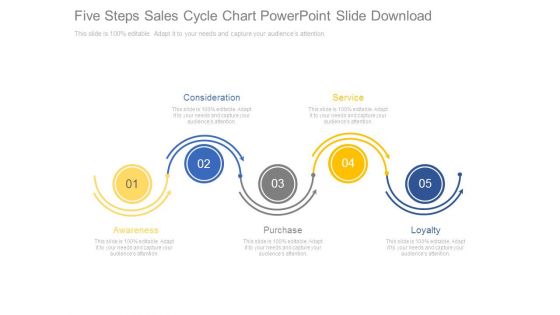
Five Steps Sales Cycle Chart Powerpoint Slide Download
This is a five steps sales cycle chart powerpoint slide download. This is a five stage process. The stages in this process are consideration, service, loyalty, purchase, awareness.
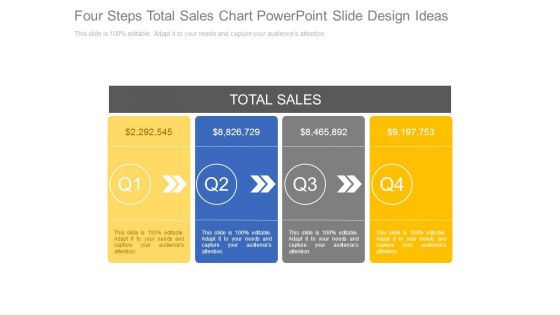
Four Steps Total Sales Chart Powerpoint Slide Design Ideas
This is a four steps total sales chart powerpoint slide design ideas. This is a four stage process. The stages in this process are total sales, marketing.

Personal Characteristics Flow Chart Powerpoint Slide Background Picture
This is a personal characteristics flow chart powerpoint slide background picture. This is a three stage process. The stages in this process are attitude, personal characteristics, loyalty.
Chart Variations To Compare Quarterly Performance Ppt Icon
This is a chart variations to compare quarterly performance ppt icon. This is a five stage process. The stages in this process are series, business, marketing, finance, success.
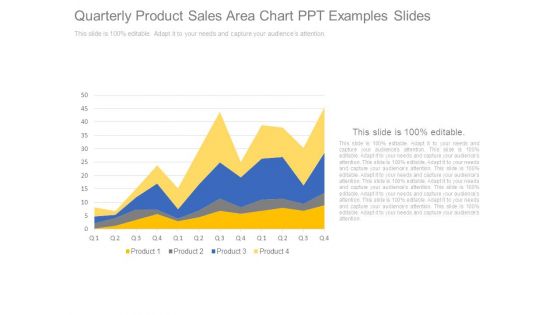
Quarterly Product Sales Area Chart Ppt Examples Slides
This is a quarterly product sales area chart ppt examples slides. This is a four stage process. The stages in this process are product, business, marketing, success, sales.
Puzzle Chart With Possible Solutions Ppt Background Template
This is a puzzle chart with possible solutions ppt background template. This is a four stage process. The stages in this process are puzzles, problem, solution, business, marketing.

Pie Charts For Pareto Analysis Powerpoint Slide Backgrounds
This is a pie charts for pareto analysis powerpoint slide backgrounds. This is a two stage process. The stages in this process are reasons, complaints.
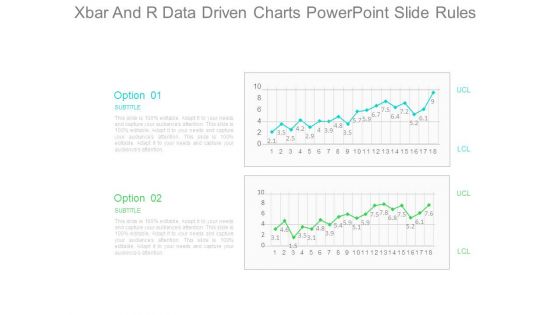
Xbar And R Data Driven Charts Powerpoint Slide Rules
This is a xbar and r data driven charts powerpoint slide rules. This is a two stage process. The stages in this process are option, subtitle, lcl, ucl.
What If Modelling Hexagon Chart Powerpoint Slide Graphics
This is a what if modelling hexagon chart powerpoint slide graphics. This is a three stage process. The stages in this process are what if modelling.
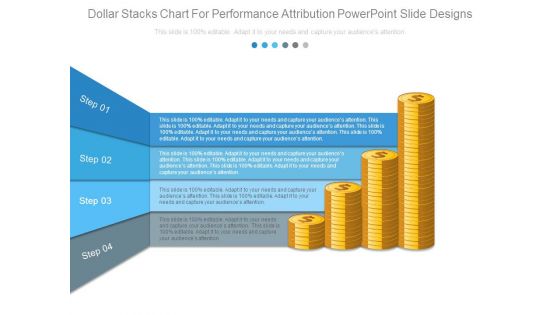
Dollar Stacks Chart For Performance Attribution Powerpoint Slide Designs
This is a dollar stacks chart for performance attribution powerpoint slide designs. This is a four stage process. The stages in this process are step.

Business Expenditure Analysis Pie Charts Ppt Infographic Template
This is a business expenditure analysis pie charts ppt infographic template. This is a three stage process. The stages in this process are pie, business, marketing, finance, success.
Corporate Over View Three Steps Chart Ppt Icon
This is a corporate over view three steps chart ppt icon. This is a three stage process. The stages in this process are value, vision, mission.
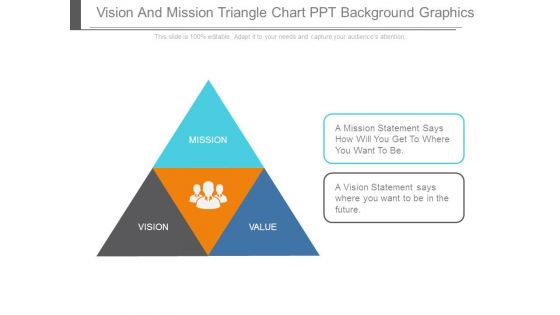
Vision And Mission Triangle Chart Ppt Background Graphics
This is a vision and mission triangle chart ppt background graphics. This is a three stage process. The stages in this process are mission, value, vision.

Vision Mission Goal Infographic Chart Ppt Slide Show
This is a vision mission goal infographic chart ppt slide show. This is a three stage process. The stages in this process are vision, mission, goal.
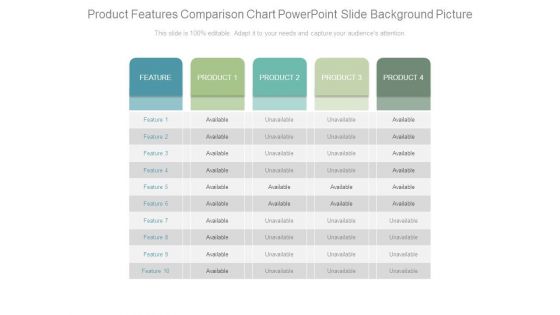
Product Features Comparison Chart Powerpoint Slide Background Picture
This is a product features comparison chart powerpoint slide background picture. This is a four stage process. The stages in this process are feature, product, available, unavailable.
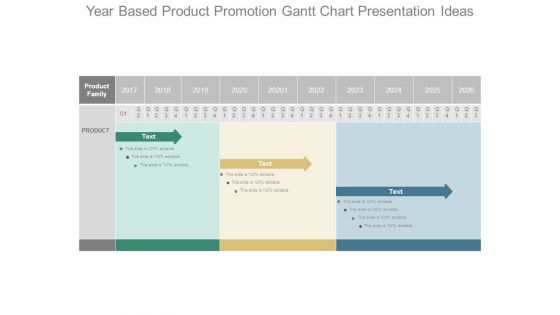
Year Based Product Promotion Gantt Chart Presentation Ideas
This is a year based product promotion gantt chart presentation ideas. This is a three stage process. The stages in this process are product family, product.
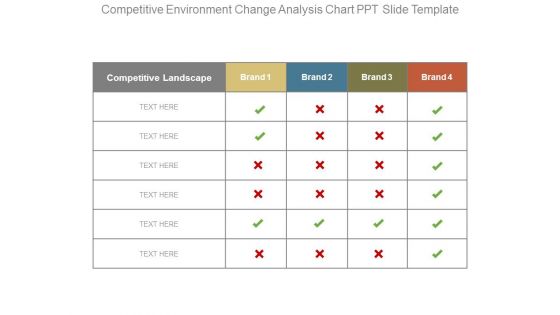
Competitive Environment Change Analysis Chart Ppt Slide Template
This is a competitive environment change analysis chart ppt slide template. This is a four stage process. The stages in this process are competitive landscape, brand.

Changes In Competitive Environment Landscape Chart Powerpoint Layout
This is a changes in competitive environment landscape chart powerpoint layout. This is a four stage process. The stages in this process are competitive landscape, brand.

Overall Revenue Analysis Bar Chart Powerpoint Slide Information
This is a overall revenue analysis bar chart powerpoint slide information. This is a nine stage process. The stages in this process are finance, success, business, marketing, percentage.
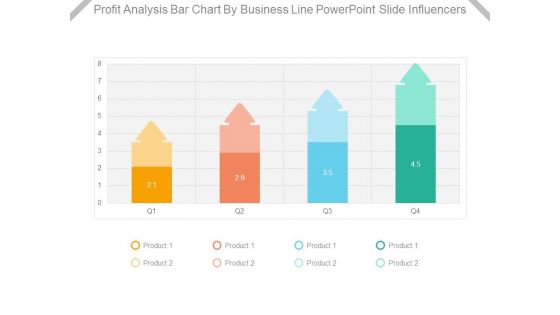
Profit Analysis Bar Chart By Business Line Powerpoint Slide Influencers
This is a profit analysis bar chart by business line powerpoint slide influencers. This is a four stage process. The stages in this process are product.
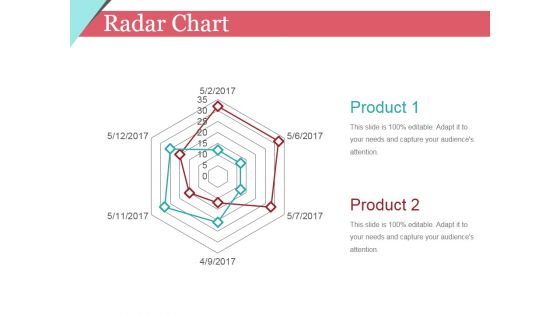
Radar Chart Ppt PowerPoint Presentation Infographic Template Design Templates
This is a radar chart ppt powerpoint presentation infographic template design templates. This is a seven stage process. The stages in this process are business, shapes, product, marketing.

Stock Chart Ppt PowerPoint Presentation Infographic Template Clipart Images
This is a stock chart ppt powerpoint presentation infographic template clipart images. This is a five stage process. The stages in this process are high, volume, low, close.

Hierarchy Chart Ppt PowerPoint Presentation Model Graphics Pictures
This is a hierarchy chart ppt powerpoint presentation model graphics pictures. This is a four stage process. The stages in this process are ceo, accountant, sales, developer, designer.
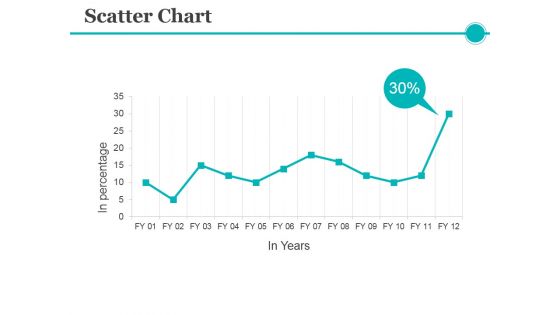
Scatter Chart Ppt PowerPoint Presentation Portfolio Design Inspiration
This is a scatter chart ppt powerpoint presentation portfolio design inspiration. This is a twelve stage process. The stages in this process are graph, growth, success, business.
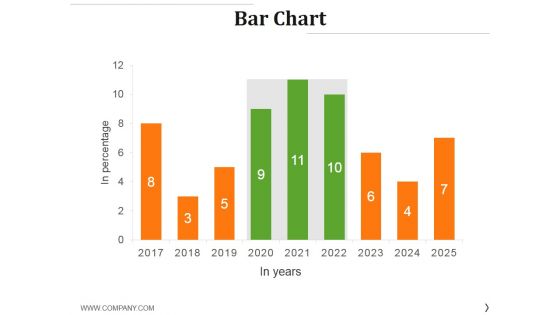
Bar Chart Ppt PowerPoint Presentation Styles Graphics Example
This is a bar chart ppt powerpoint presentation styles graphics example. This is a nine stage process. The stages in this process are graph, growth, success, business, finance.

Column Chart Ppt PowerPoint Presentation Inspiration Example Topics
This is a column chart ppt powerpoint presentation inspiration example topics. This is a twelve stage process. The stages in this process are dollar, growth, business, marketing, success.
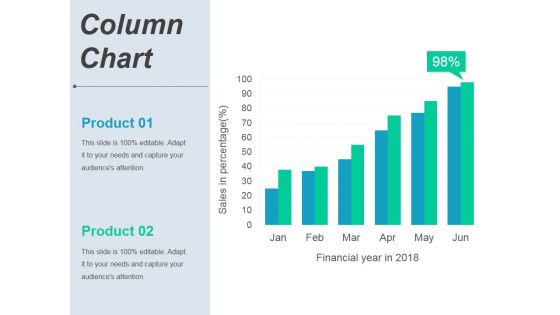
Column Chart Ppt PowerPoint Presentation Portfolio Graphics Template
This is a column chart ppt powerpoint presentation portfolio graphics template. This is a six stage process. The stages in this process are product, finance, growth, success, business.
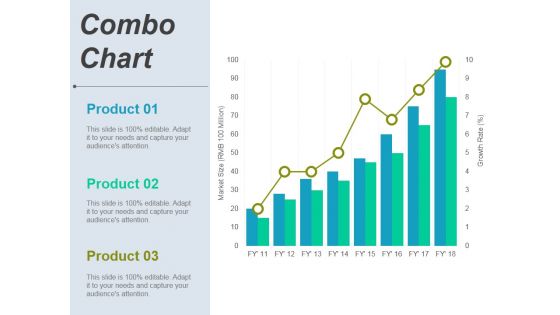
Combo Chart Ppt PowerPoint Presentation Professional Graphics Example
This is a combo chart ppt powerpoint presentation professional graphics example. This is a eight stage process. The stages in this process are product, finance, growth, success, business.

Radar Chart Ppt PowerPoint Presentation Pictures Graphics Example
This is a radar chart ppt powerpoint presentation pictures graphics example. This is a two stage process. The stages in this process are business, marketing, shapes, diagram.
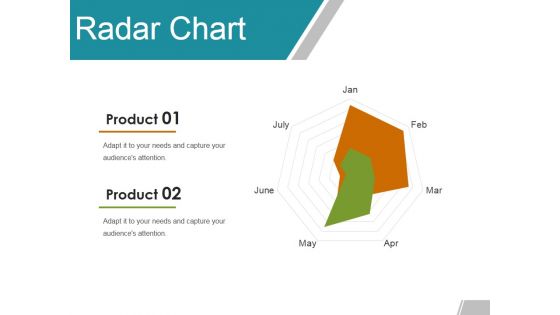
Radar Chart Ppt PowerPoint Presentation Gallery Example Topics
This is a radar chart ppt powerpoint presentation gallery example topics. This is a seven stage process. The stages in this process are product, business, marketing, shapes.
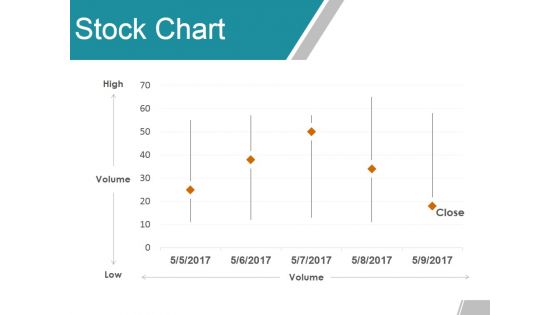
Stock Chart Ppt PowerPoint Presentation Summary Graphics Pictures
This is a stock chart ppt powerpoint presentation summary graphics pictures. This is a five stage process. The stages in this process are high, volume, low, close, finance.

Column Chart Ppt PowerPoint Presentation Infographic Template Layouts
This is a column chart ppt powerpoint presentation infographic template layouts. This is a nine stage process. The stages in this process are product, growth, success, business, graph.
Stock Chart Ppt PowerPoint Presentation Icon Graphic Images
This is a stock chart ppt powerpoint presentation icon graphic images. This is a five stage process. The stages in this process are high, volume, low, close.
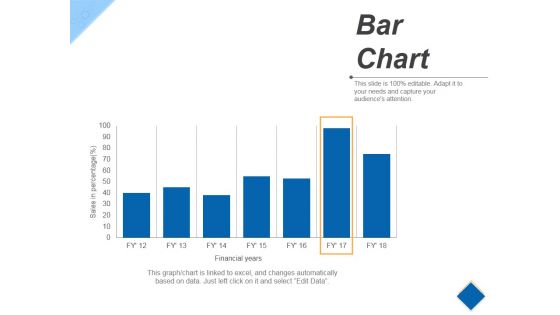
Bar Chart Ppt PowerPoint Presentation Infographic Template Example
This is a bar chart ppt powerpoint presentation infographic template example. This is a seven stage process. The stages in this process are business, finance, marketing, percentage.
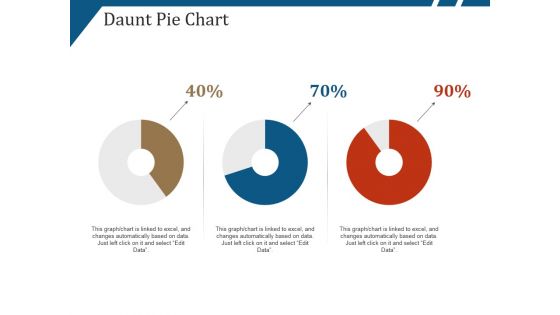
Daunt Pie Chart Ppt PowerPoint Presentation Layouts Portrait
This is a daunt pie chart ppt powerpoint presentation layouts portrait. This is a three stage process. The stages in this process are percentage, finance, donut, business.
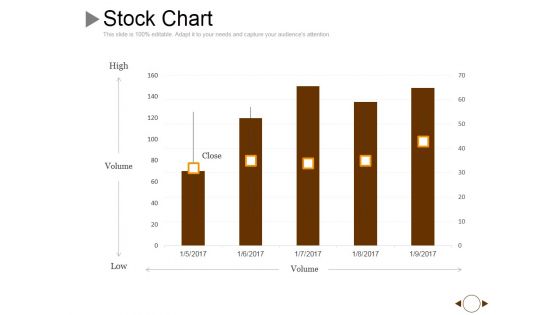
Stock Chart Ppt PowerPoint Presentation Gallery Graphics Example
This is a stock chart ppt powerpoint presentation gallery graphics example. This is a five stage process. The stages in this process are volume, high, low, close.

Radar Chart Ppt PowerPoint Presentation Infographic Template Graphics Template
This is a radar chart ppt powerpoint presentation infographic template graphics template. This is a six stage process. The stages in this process are product, business, marketing, shapes.

Area Chart Ppt PowerPoint Presentation Gallery Clipart Images
This is a area chart ppt powerpoint presentation gallery clipart images. This is a two stage process. The stages in this process are product, profit, business, finance, marketing.
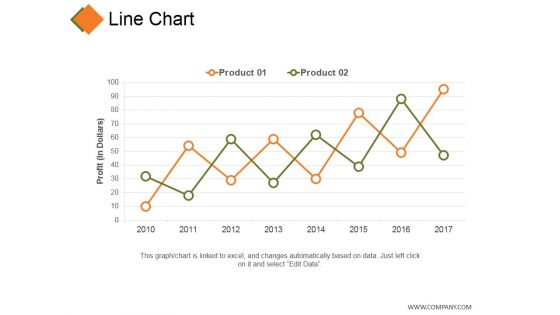
Line Chart Ppt PowerPoint Presentation Visual Aids Inspiration
This is a line chart ppt powerpoint presentation visual aids inspiration. This is a two stage process. The stages in this process are product, profit, growth, decline, success.
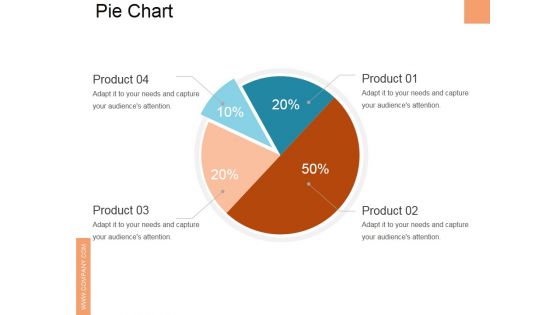
Pie Chart Ppt PowerPoint Presentation Slides Graphics Download
This is a pie chart ppt powerpoint presentation slides graphics download. This is a four stage process. The stages in this process are business, marketing, pie, finance, analysis.
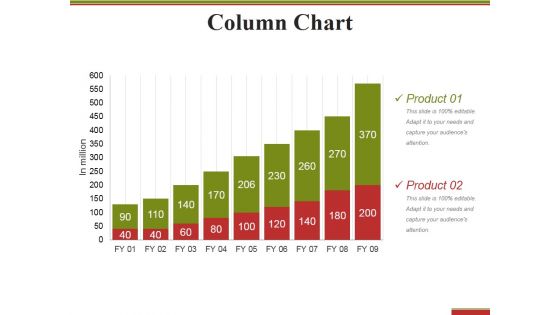
Column Chart Ppt PowerPoint Presentation Inspiration Design Ideas
This is a column chart ppt powerpoint presentation inspiration design ideas. This is a nine stage process. The stages in this process are product, growth, success, graph, business.
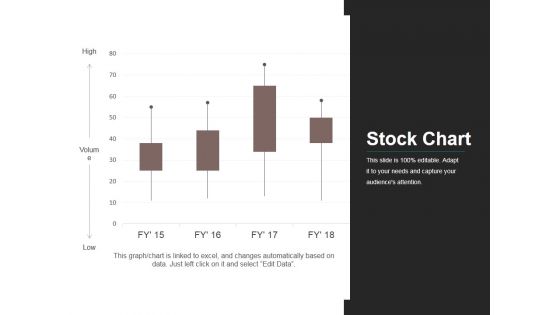
Stock Chart Ppt PowerPoint Presentation Infographic Template Elements
This is a stock chart ppt powerpoint presentation infographic template elements. This is a four stage process. The stages in this process are business, market, stock, finance, analysis.
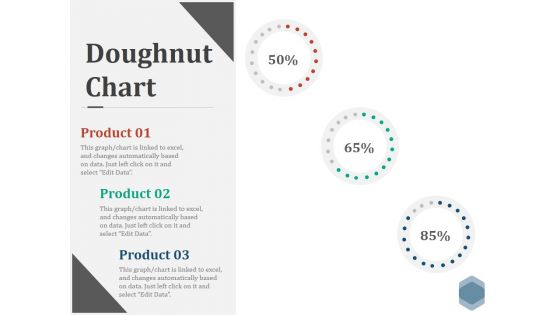
Doughnut Chart Ppt PowerPoint Presentation Visual Aids Files
This is a doughnut chart ppt powerpoint presentation visual aids files. This is a three stage process. The stages in this process are finance, donut, percentage, business, marketing.
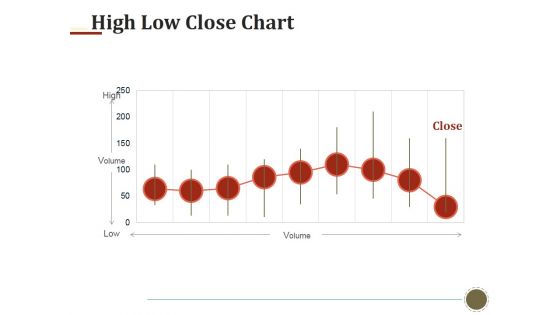
High Low Close Chart Ppt PowerPoint Presentation Infographics Templates
This is a high low close chart ppt powerpoint presentation infographics templates. This is a nine stage process. The stages in this process are high, volume, low, close.
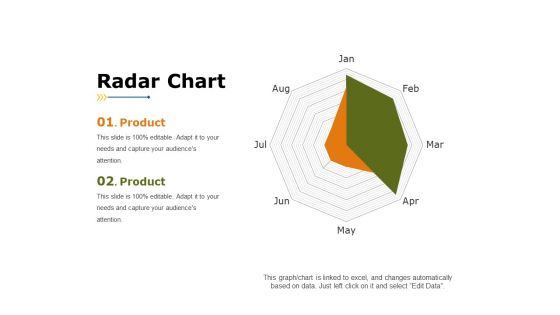
Radar Chart Ppt PowerPoint Presentation Summary Background Designs
This is a radar chart ppt powerpoint presentation summary background designs. This is a two stage process. The stages in this process are product, finance, business, marketing.
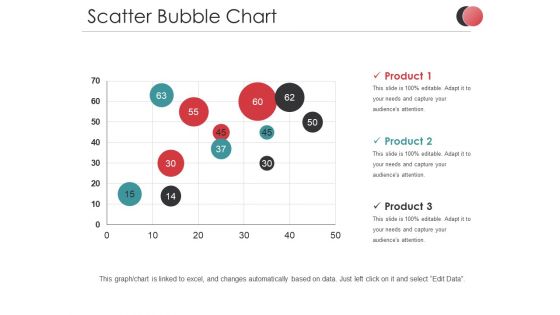
Scatter Bubble Chart Ppt PowerPoint Presentation Infographic Template Diagrams
This is a scatter bubble chart ppt powerpoint presentation infographic template diagrams. This is a three stage process. The stages in this process are product, business, marketing, finance.

Donut Pie Chart Ppt PowerPoint Presentation Show Topics
This is a donut pie chart ppt powerpoint presentation show topics. This is a three stage process. The stages in this process are percentage, finance, donut, business.

Hierarchy Chart Ppt PowerPoint Presentation Infographic Template Graphics
This is a hierarchy chart ppt powerpoint presentation infographic template graphics. This is a four stage process. The stages in this process are ceo, director, accountant, sales, developer.
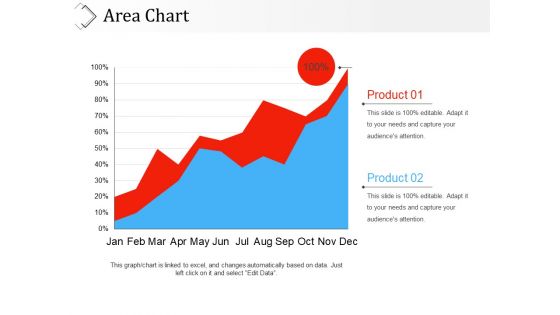
Area Chart Ppt PowerPoint Presentation Model Example Topics
This is a area chart ppt powerpoint presentation model example topics. This is a two stage process. The stages in this process are product, percentage, business, marketing, finance.
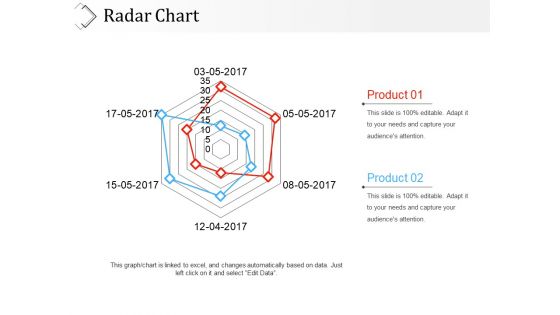
Radar Chart Ppt PowerPoint Presentation File Graphic Tips
This is a radar chart ppt powerpoint presentation file graphic tips. This is a two stage process. The stages in this process are product, finance, marketing, business.
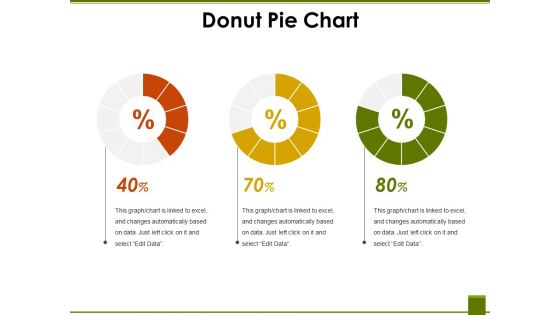
Donut Pie Chart Ppt PowerPoint Presentation File Mockup
This is a donut pie chart ppt powerpoint presentation file mockup. This is a three stage process. The stages in this process are finance, business, percentage, marketing.
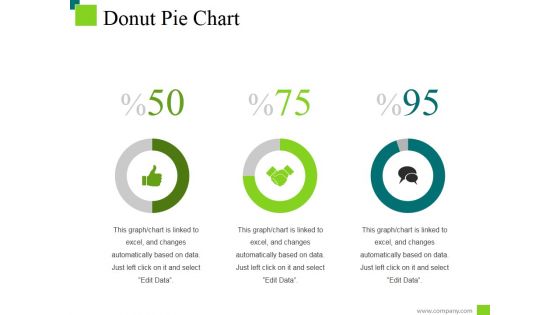
Donut Pie Chart Ppt PowerPoint Presentation Inspiration Deck
This is a donut pie chart ppt powerpoint presentation inspiration deck. This is a three stage process. The stages in this process are percentage, finance, donut, business.
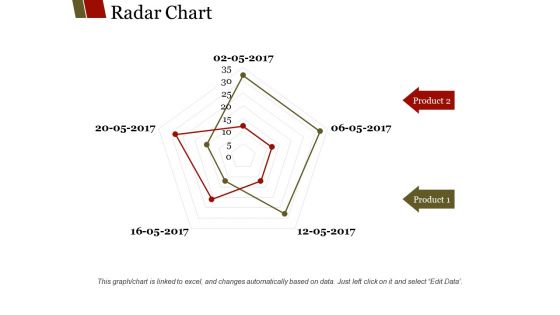
Radar Chart Ppt PowerPoint Presentation Summary Slide Portrait
This is a radar chart ppt powerpoint presentation summary slide portrait. This is a two stage process. The stages in this process are product, business, marketing, finance.

Stock Chart Ppt PowerPoint Presentation Gallery Graphic Images
This is a stock chart ppt powerpoint presentation gallery graphic images. This is a five stage process. The stages in this process are close, high, volume, low, open.

Donut Pie Chart Ppt PowerPoint Presentation Ideas Portrait
This is a donut pie chart ppt powerpoint presentation ideas portrait. This is a three stage process. The stages in this process are percentage, finance, donut, business.
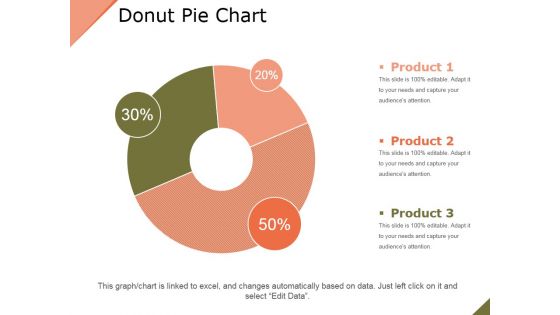
Donut Pie Chart Ppt PowerPoint Presentation Layouts Outfit
This is a donut pie chart ppt powerpoint presentation layouts outfit. This is a three stage process. The stages in this process are product, business, percentage, finance, marketing.
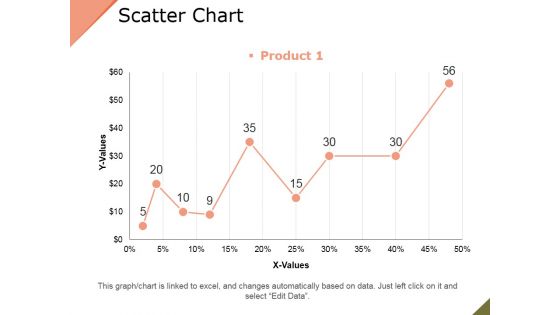
Scatter Chart Ppt PowerPoint Presentation Infographic Template Objects
This is a scatter chart ppt powerpoint presentation infographic template objects. This is a nine stage process. The stages in this process are product, growth, success, graph.

Donut Pie Chart Ppt PowerPoint Presentation Model Pictures
This is a donut pie chart ppt powerpoint presentation model pictures. This is a six stage process. The stages in this process are product, percentage, finance, year, business.

Donut Pie Chart Ppt PowerPoint Presentation Model Show
This is a donut pie chart ppt powerpoint presentation model show. This is a three stage process. The stages in this process are product, donut, percentage, finance, business.
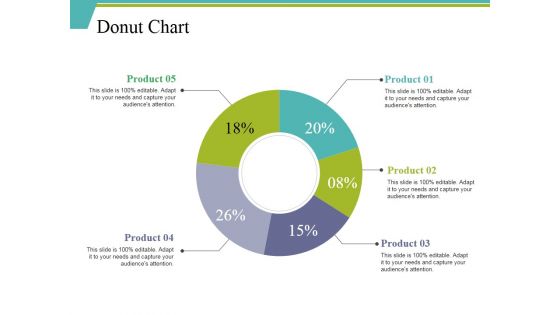
Donut Chart Ppt PowerPoint Presentation Ideas Background Designs
This is a donut chart ppt powerpoint presentation ideas background designs. This is a five stage process. The stages in this process are percentage, finance, donut, business, product.

 Home
Home