Waterfall Chart
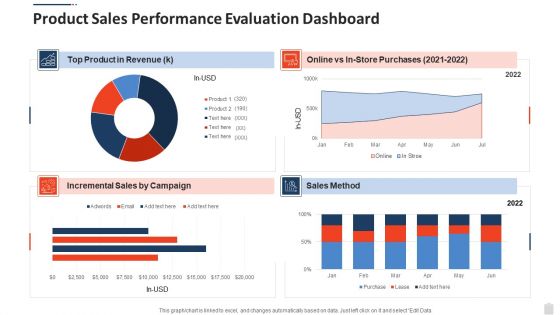
Product Sales Performance Evaluation Dashboard Graphics PDF
Pitch your topic with ease and precision using this product sales performance evaluation dashboard graphics pdf. This layout presents information on product sales performance evaluation dashboard. It is also available for immediate download and adjustment. So, changes can be made in the color, design, graphics or any other component to create a unique layout.
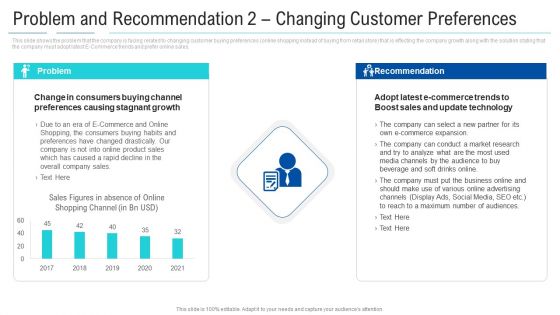
Problem And Recommendation 2 Changing Customer Preferences Brochure PDF
This slide shows the problem that the company is facing related to changing customer buying preferences online shopping instead of buying from retail store that is effecting the company growth along with the solution stating that the company must adopt latest E Commerce trends and prefer online sales. Deliver and pitch your topic in the best possible manner with this problem and recommendation 2 changing customer preferences brochure pdf. Use them to share invaluable insights on product sales, company sales, preferences, social media, online advertising, e commerce and impress your audience. This template can be altered and modified as per your expectations. So, grab it now.

Determine B2B Sales Management Dashboard Elements PDF
This slide provides information regarding B2B sales management activities dashboard. The key elements of dashboard highlights total contacts, goal identification, bounce rate, etc. Presenting this PowerPoint presentation, titled Determine B2B Sales Management Dashboard Elements PDF, with topics curated by our researchers after extensive research. This editable presentation is available for immediate download and provides attractive features when used. Download now and captivate your audience. Presenting this Determine B2B Sales Management Dashboard Elements PDF. Our researchers have carefully researched and created these slides with all aspects taken into consideration. This is a completely customizable Determine B2B Sales Management Dashboard Elements PDF that is available for immediate downloading. Download now and make an impact on your audience. Highlight the attractive features available with our PPTs.
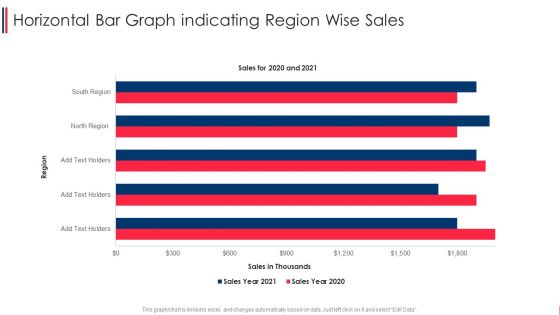
Horizontal Bar Graph Indicating Region Wise Sales Formats PDF
Pitch your topic with ease and precision using this horizontal bar graph indicating region wise sales formats pdf. This layout presents information on horizontal bar graph indicating region wise sales. It is also available for immediate download and adjustment. So, changes can be made in the color, design, graphics or any other component to create a unique layout.

Stacked Horizontal Bar Graph Indicating Organization Quarterly Sales Graphics PDF
Pitch your topic with ease and precision using this stacked horizontal bar graph indicating organization quarterly sales graphics pdf. This layout presents information on stacked horizontal bar graph indicating organization quarterly sales. It is also available for immediate download and adjustment. So, changes can be made in the color, design, graphics or any other component to create a unique layout.

Sales Enhancement Strategy Dashboard With Product Classification And Financial Analysis Formats PDF
This slide shows sales improvement plan dashboard for product classification and financial analysis which can be referred by companies which want to make quick decisions by having overview of organized and compiled data. It includes details such as comparison chart, state wise sales, total sales, adjusted margin, operational expenses, etc. Showcasing this set of slides titled Sales Enhancement Strategy Dashboard With Product Classification And Financial Analysis Formats PDF. The topics addressed in these templates are Gross Margin, Sales, Operational Expenses. All the content presented in this PPT design is completely editable. Download it and make adjustments in color, background, font etc. as per your unique business setting.

Business Sales Procedures Improvement Dashboard Designs PDF
Following slide shows the dashboard for reengineering business sales processes which assist in accelerated processing times, lower costs, better customer service, and stronger employee retention. The KPI are proposals ,opportunities, etc. Pitch your topic with ease and precision using this Business Sales Procedures Improvement Dashboard Designs PDF. This layout presents information on Deals Opportunities Ratios, Opportunity, Deals Conversion Ratio. It is also available for immediate download and adjustment. So, changes can be made in the color, design, graphics or any other component to create a unique layout.

Sales Evaluation Ppt PowerPoint Presentation Inspiration Gridlines
Presenting this set of slides with name sales evaluation ppt powerpoint presentation inspiration gridlines. The topics discussed in these slides are finance, marketing, management, investment, analysis. This is a completely editable PowerPoint presentation and is available for immediate download. Download now and impress your audience.
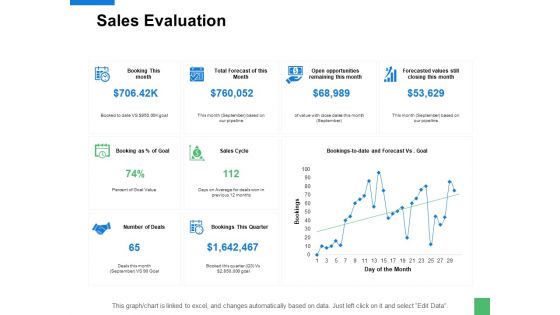
Sales Evaluation Ppt PowerPoint Presentation Ideas Examples
Presenting this set of slides with name sales evaluation ppt powerpoint presentation ideas examples. The topics discussed in these slides are finance, marketing, management, investment, analysis. This is a completely editable PowerPoint presentation and is available for immediate download. Download now and impress your audience.
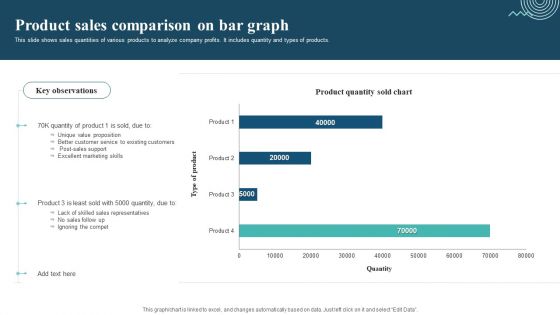
Product Sales Comparison On Bar Graph Sample PDF
This slide shows sales quantities of various products to analyze company profits. It includes quantity and types of products. Pitch your topic with ease and precision using this Product Sales Comparison On Bar Graph Sample PDF. This layout presents information on Unique Value Proposition, Excellent Marketing Skills, Ignoring The Compet. It is also available for immediate download and adjustment. So, changes can be made in the color, design, graphics or any other component to create a unique layout.
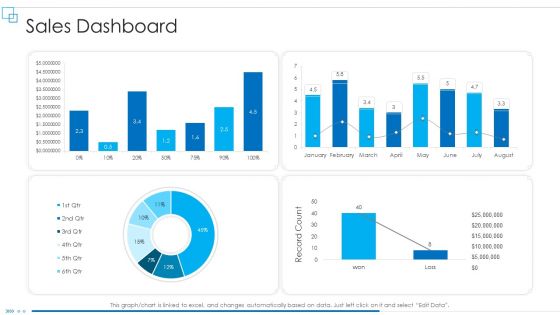
Business Scheme Management Synopsis Sales Dashboard Record Designs PDF
Deliver an awe inspiring pitch with this creative business scheme management synopsis sales dashboard record designs pdf bundle. Topics like sales dashboard can be discussed with this completely editable template. It is available for immediate download depending on the needs and requirements of the user.

Dashboard For Statistical Analysis Of Product Sales Ppt PowerPoint Presentation Infographics Graphics Pictures PDF
Presenting this set of slides with name dashboard for statistical analysis of product sales ppt powerpoint presentation infographics graphics pictures pdf. The topics discussed in these slides are sales chart, product. This is a completely editable PowerPoint presentation and is available for immediate download. Download now and impress your audience.
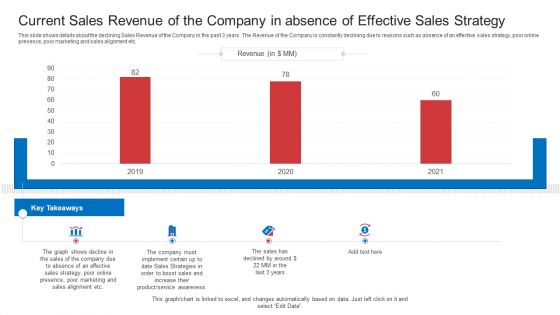
Strategic Plan To Increase Sales Volume And Revenue Current Sales Revenue Of The Company In Absence Of Effective Sales Strategy Diagrams PDF
This slide shows details about the declining Sales Revenue of the Company in the past 3 years. The Revenue of the Company is constantly declining due to reasons such as absence of an effective sales strategy, poor online presence, poor marketing and sales alignment etc. Deliver and pitch your topic in the best possible manner with this strategic plan to increase sales volume and revenue current sales revenue of the company in absence of effective sales strategy diagrams pdf. Use them to share invaluable insights on marketing, sales, strategy, effective, awareness and impress your audience. This template can be altered and modified as per your expectations. So, grab it now.
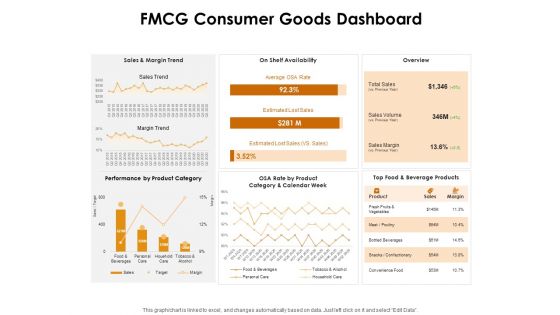
KPI Dashboards Per Industry FMCG Consumer Goods Dashboard Ppt PowerPoint Presentation Infographics Graphics Tutorials PDF
Deliver and pitch your topic in the best possible manner with this kpi dashboards per industry fmcg consumer goods dashboard ppt powerpoint presentation infographics graphics tutorials pdf. Use them to share invaluable insights on sales and margin trend, on shelf availability, overview, performance product category and impress your audience. This template can be altered and modified as per your expectations. So, grab it now.
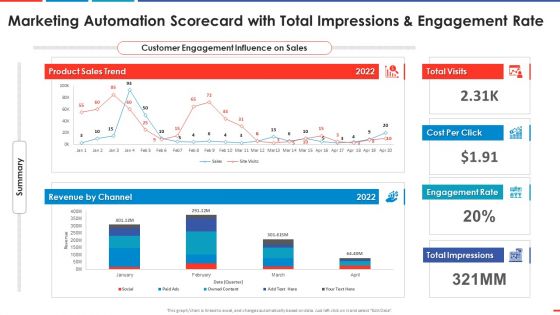
Marketing Automation Scorecard With Total Impression And Automated Business Promotion Scorecard Sample PDF
Deliver and pitch your topic in the best possible manner with this marketing automation scorecard with total impression and automated business promotion scorecard sample pdf. Use them to share invaluable insights on revenue, product sales trend, engagement rate and impress your audience. This template can be altered and modified as per your expectations. So, grab it now.
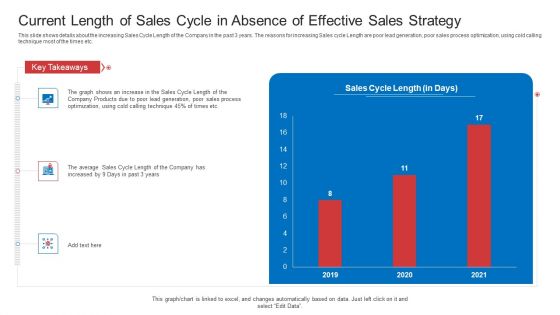
Strategic Plan To Increase Sales Volume And Revenue Current Length Of Sales Cycle In Absence Of Effective Sales Strategy Ideas PDF
This slide shows details about the increasing Sales Cycle Length of the Company in the past 3 years. The reasons for increasing Sales cycle Length are poor lead generation, poor sales process optimization, using cold calling technique most of the times etc. Deliver an awe inspiring pitch with this creative strategic plan to increase sales volume and revenue current length of sales cycle in absence of effective sales strategy ideas pdf bundle. Topics like technique, sales, process, optimization can be discussed with this completely editable template. It is available for immediate download depending on the needs and requirements of the user.
Monthly Sales Performance Tracking And Monitoring Dashboard Diagrams PDF
This slide showcases a dashboard presenting various metrics to measure and analyze sales performance for revenue growth. It includes key components such as number of sales, revenue, profit, cost, sales revenue, sales increment, cost analysis and cross sell. Make sure to capture your audiences attention in your business displays with our gratis customizable Monthly Sales Performance Tracking And Monitoring Dashboard Diagrams PDF. These are great for business strategies, office conferences, capital raising or task suggestions. If you desire to acquire more customers for your tech business and ensure they stay satisfied, create your own sales presentation with these plain slides.

Companys Promotional Budget Analysis Client Acquisition Techniques To Boost Sales Guidelines PDF
The slides shows promotional budget breakup traditional advertising, digital marketing, other promotional activities of the company by month. Further, it represents the annual budget breakup through a pie chart. Boost your pitch with our creative Companys Promotional Budget Analysis Client Acquisition Techniques To Boost Sales Guidelines PDF. Deliver an awe-inspiring pitch that will mesmerize everyone. Using these presentation templates you will surely catch everyones attention. You can browse the ppts collection on our website. We have researchers who are experts at creating the right content for the templates. So you do not have to invest time in any additional work. Just grab the template now and use them.

Business Strategy Development Process Company Sales Graph Diagrams PDF
Deliver an awe inspiring pitch with this creative business strategy development process company sales graph diagrams pdf bundle. Topics like company sales graph can be discussed with this completely editable template. It is available for immediate download depending on the needs and requirements of the user.

Monthly Sales Volume Report With Graph Demonstration PDF
The following slide highlights the monthly sales volume report with graph illustrating key headings which includes sales report, current month sales volume and current month volume vs last month volume. Showcasing this set of slides titled Monthly Sales Volume Report With Graph Demonstration PDF. The topics addressed in these templates are Monthly Sales, Volume Report, Graph. All the content presented in this PPT design is completely editable. Download it and make adjustments in color, background, font etc. as per your unique business setting.
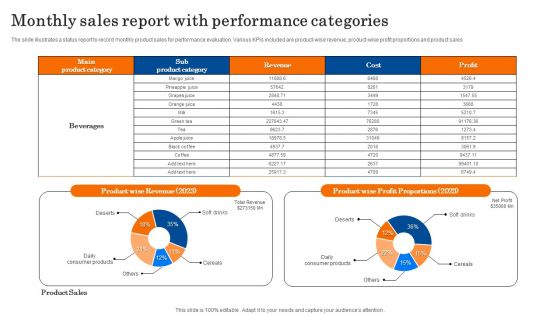
Monthly Sales Report With Performance Categories Diagrams PDF
The slide illustrates a status report to record monthly product sales for performance evaluation. Various KPIs included are product wise revenue, product-wise profit proportions and product sales. Showcasing this set of slides titled Monthly Sales Report With Performance Categories Diagrams PDF. The topics addressed in these templates are Revenue, Profit Proportions, Product Sales. All the content presented in this PPT design is completely editable. Download it and make adjustments in color, background, font etc. as per your unique business setting.
Sales Performance Comparison Graph Of Top Customer Icons PDF
This slide shows the customer sales comparison graph along with the units of product purchased by the clients. Showcasing this set of slides titled Sales Performance Comparison Graph Of Top Customer Icons PDF. The topics addressed in these templates are Highest Units, Customer, Product. All the content presented in this PPT design is completely editable. Download it and make adjustments in color, background, font etc. as per your unique business setting.
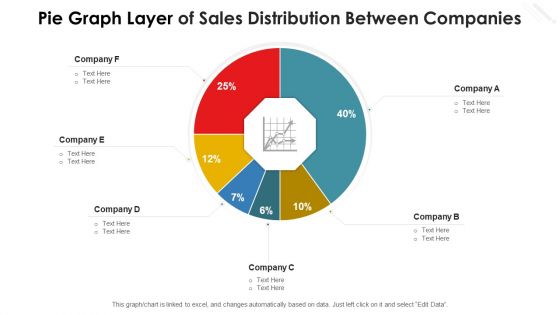
Pie Graph Layer Of Sales Distribution Between Companies Template PDF
Showcasing this set of slides titled pie graph layer of sales distribution between companies template pdf. The topics addressed in these templates are pie graph layer of sales distribution between companies. All the content presented in this PPT design is completely editable. Download it and make adjustments in color, background, font etc. as per your unique business setting.
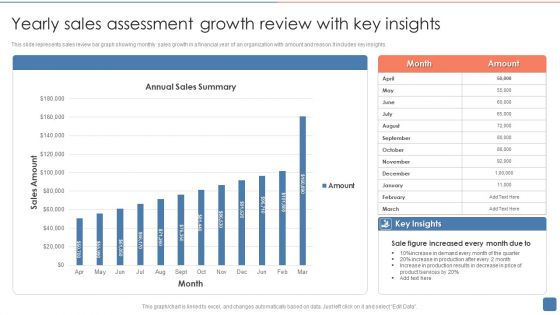
Yearly Sales Assessment Growth Review With Key Insights Infographics PDF
This slide represents sales review bar graph showing monthly sales growth in a financial year of an organization with amount and reason.It includes key insights. Showcasing this set of slides titled Yearly Sales Assessment Growth Review With Key Insights Infographics PDF. The topics addressed in these templates are Sale Figure, Demand, Services. All the content presented in this PPT design is completely editable. Download it and make adjustments in color, background, font etc. as per your unique business setting.
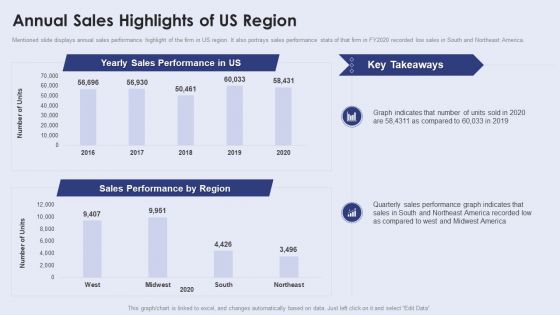
Creating New Product Launch Campaign Strategy Annual Sales Highlights Of Us Region Microsoft PDF
Mentioned slide displays annual sales performance highlight of the firm in US region. It also portrays sales performance stats of that firm in FY2020 recorded low sales in South and Northeast America. If you are looking for a format to display your unique thoughts, then the professionally designed Creating New Product Launch Campaign Strategy Annual Sales Highlights Of Us Region Microsoft PDF is the one for you. You can use it as a Google Slides template or a PowerPoint template. Incorporate impressive visuals, symbols, images, and other charts. Modify or reorganize the text boxes as you desire. Experiment with shade schemes and font pairings. Alter, share or cooperate with other people on your work. Download Creating New Product Launch Campaign Strategy Annual Sales Highlights Of Us Region Microsoft PDF and find out how to give a successful presentation. Present a perfect display to your team and make your presentation unforgettable.
Monthly Sales Performance Tracking And Monitoring Dashboard Designs PDF
This slide showcases a dashboard presenting various metrics to measure and analyze sales performance for revenue growth. It includes key components such as number of sales, revenue, profit, cost, sales revenue, sales increment, cost analysis and cross sell. Make sure to capture your audiences attention in your business displays with our gratis customizable Monthly Sales Performance Tracking And Monitoring Dashboard Designs PDF. These are great for business strategies, office conferences, capital raising or task suggestions. If you desire to acquire more customers for your tech business and ensure they stay satisfied, create your own sales presentation with these plain slides.
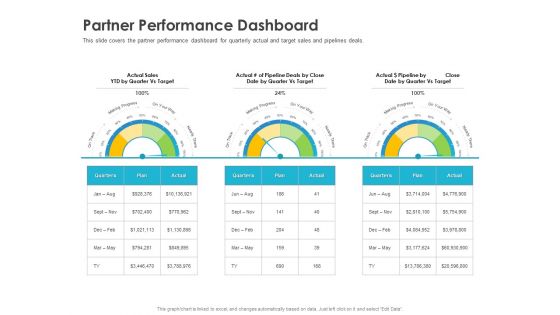
Robust Partner Sales Enablement Program Partner Performance Dashboard Rules PDF
Deliver an awe inspiring pitch with this creative robust partner sales enablement program partner performance dashboard rules pdf bundle. Topics like sales, target, actual, plan can be discussed with this completely editable template. It is available for immediate download depending on the needs and requirements of the user.
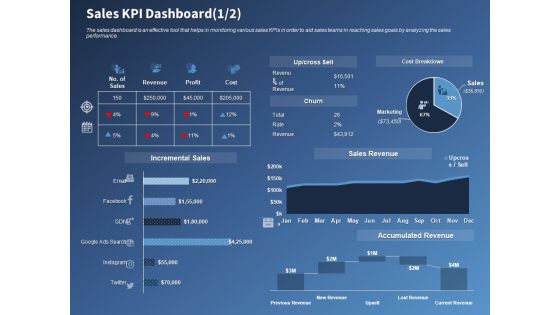
Performance Assessment Sales Initiative Report Sales KPI Dashboard Ppt Slides Influencers PDF
Presenting this set of slides with name performance assessment sales initiative report sales kpi dashboard ppt slides influencers pdf. The topics discussed in these slides are revenue, profit, cost, incremental, sales. This is a completely editable PowerPoint presentation and is available for immediate download. Download now and impress your audience.
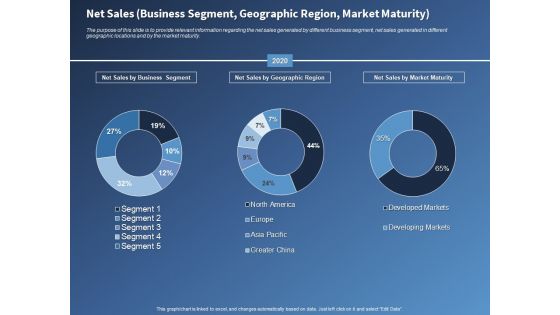
Performance Assessment Sales Initiative Report Net Sales Business Segment Geographic Region Market Maturity Information
Presenting this set of slides with name performance assessment sales initiative report net sales business segment geographic region market maturity information. The topics discussed in these slides are business, segment, sales, geographic, market maturity. This is a completely editable PowerPoint presentation and is available for immediate download. Download now and impress your audience.

Performance Assessment Sales Initiative Report Yearly Report Accessing Sales Department Performance Graphics
Presenting this set of slides with name performance assessment sales initiative report yearly report accessing sales department performance graphics. The topics discussed in these slides are sales, performance. This is a completely editable PowerPoint presentation and is available for immediate download. Download now and impress your audience.
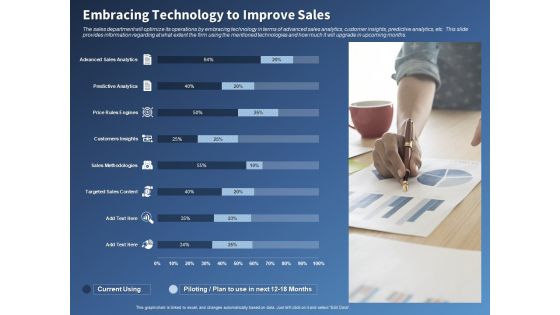
Performance Assessment Sales Initiative Report Embracing Technology To Improve Sales Ppt Outline Ideas PDF
Presenting this set of slides with name performance assessment sales initiative report embracing technology to improve sales ppt outline ideas pdf. The topics discussed in these slides are analytics, sales, methodologies, targeted, predictive. This is a completely editable PowerPoint presentation and is available for immediate download. Download now and impress your audience.

Performance Assessment Sales Initiative Report Projected Sales Performance Ppt Summary Show PDF
Presenting this set of slides with name performance assessment sales initiative report projected sales performance ppt summary show pdf. The topics discussed in these slide is projected sales performance. This is a completely editable PowerPoint presentation and is available for immediate download. Download now and impress your audience.

Performance Assessment Sales Initiative Report Sales Comparison Year Over Year Ppt Professional Design Ideas PDF
Presenting this set of slides with name performance assessment sales initiative report sales comparison year over year ppt professional design ideas pdf. The topics discussed in these slide is sales comparison year over year. This is a completely editable PowerPoint presentation and is available for immediate download. Download now and impress your audience.
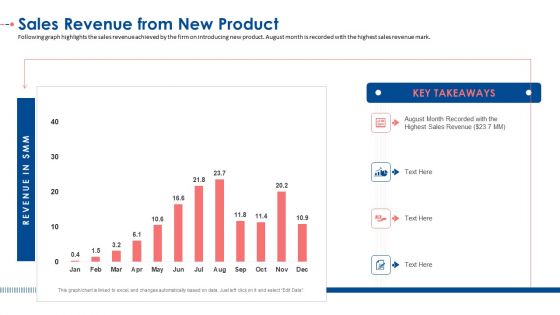
Sales Revenue From New Product Ppt Infographic Template Example PDF
Following graph highlights the sales revenue achieved by the firm on introducing new product. August month is recorded with the highest sales revenue mark. Deliver and pitch your topic in the best possible manner with this sales revenue from new product ppt infographic template example pdf. Use them to share invaluable insights on sales revenue from new product and impress your audience. This template can be altered and modified as per your expectations. So, grab it now.

State Wise Customer Sales Performance Comparison Graph Introduction PDF
This slide shows the sales graph of 3 products of a company in various states. It includes five states which are New York, Texas, California, Washington and New Jersey. Showcasing this set of slides titled State Wise Customer Sales Performance Comparison Graph Introduction PDF. The topics addressed in these templates are Lowest Sales, Decrease Demand. All the content presented in this PPT design is completely editable. Download it and make adjustments in color, background, font etc. as per your unique business setting.

Determining Risks In Sales Administration Procedure Comparative Analysis Of Budgeted And Actual Sales Formats PDF
The following slide depicts the analysis of projected and actual sales performance post risk management to evaluate its success. It mainly includes revenue generated during 2021 and 2022 along with gross profit margin etc. Presenting this PowerPoint presentation, titled Determining Risks In Sales Administration Procedure Comparative Analysis Of Budgeted And Actual Sales Formats PDF, with topics curated by our researchers after extensive research. This editable presentation is available for immediate download and provides attractive features when used. Download now and captivate your audience. Presenting this Determining Risks In Sales Administration Procedure Comparative Analysis Of Budgeted And Actual Sales Formats PDF. Our researchers have carefully researched and created these slides with all aspects taken into consideration. This is a completely customizable Determining Risks In Sales Administration Procedure Comparative Analysis Of Budgeted And Actual Sales Formats PDF that is available for immediate downloading. Download now and make an impact on your audience. Highlight the attractive features available with our PPTs.

Performance Report With Sales Cycle Length Template PDF
The slide showcases a product report to calculate the average sales cycle length for performance management. Various KPIs included are average sales cycle length, sales funnel, sales phases average length, lead conversion rate for different sales managers. sPitch your topic with ease and precision using this Performance Report With Sales Cycle Length Template PDF. This layout presents information on Sales Manager, Conversation Rate, Opportunity. It is also available for immediate download and adjustment. So, changes can be made in the color, design, graphics or any other component to create a unique layout.
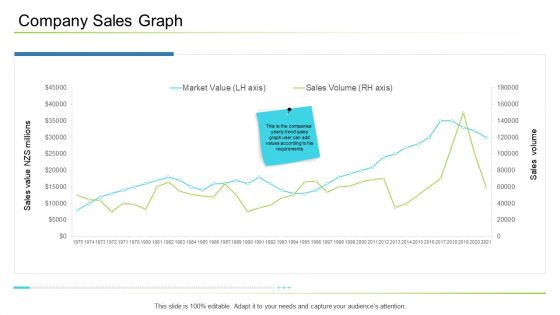
Business Management Company Sales Graph Ppt Inspiration Model PDF
Deliver an awe inspiring pitch with this creative business management company sales graph ppt inspiration model pdf bundle. Topics like company sales graph can be discussed with this completely editable template. It is available for immediate download depending on the needs and requirements of the user.
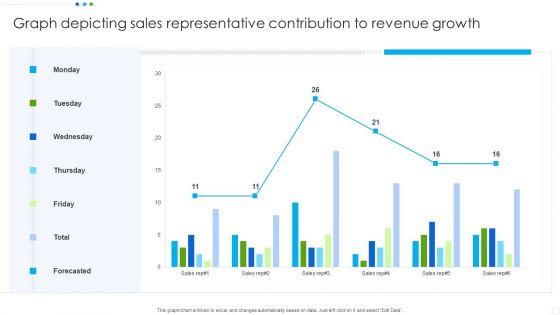
Graph Depicting Sales Representative Contribution To Revenue Growth Graphics PDF
Showcasing this set of slides titled Graph Depicting Sales Representative Contribution To Revenue Growth Graphics PDF. The topics addressed in these templates are Graph Depicting Sales, Revenue Growth. All the content presented in this PPT design is completely editable. Download it and make adjustments in color, background, font etc. as per your unique business setting.
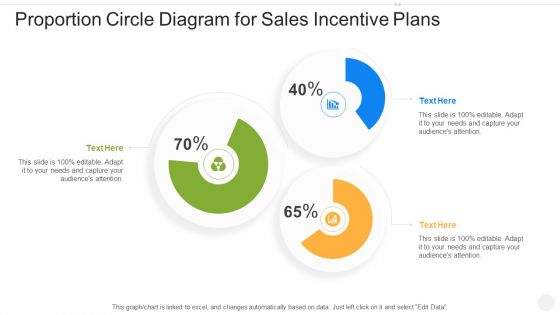
Proportion Circle Diagram For Sales Incentive Plans Slides PDF
Showcasing this set of slides titled proportion circle diagram for sales incentive plans slides pdf. The topics addressed in these templates are proportion circle diagram for sales incentive plans. All the content presented in this PPT design is completely editable. Download it and make adjustments in color, background, font etc. as per your unique business setting.

Business Operations Assessment Company Sales Graph Ppt Portfolio Good PDF
Deliver an awe-inspiring pitch with this creative business operations assessment company sales graph ppt portfolio good pdf bundle. Topics like market value, sales volume can be discussed with this completely editable template. It is available for immediate download depending on the needs and requirements of the user.

Administrative Regulation Company Sales Graph Ppt PowerPoint Presentation Outline PDF
Deliver an awe-inspiring pitch with this creative administrative regulation company sales graph ppt powerpoint presentation outline pdf bundle. Topics like market value, sales volume can be discussed with this completely editable template. It is available for immediate download depending on the needs and requirements of the user.
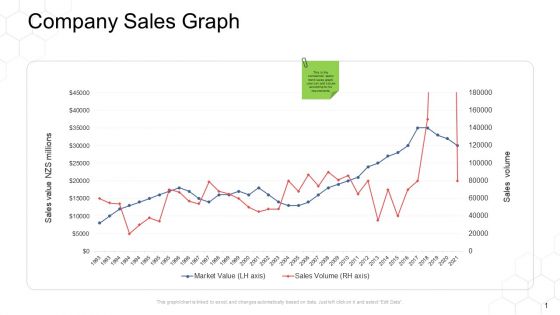
Corporate Regulation Company Sales Graph Ppt Infographics Backgrounds PDF
Deliver an awe inspiring pitch with this creative corporate regulation company sales graph ppt infographics backgrounds pdf bundle. Topics like sales, value, market can be discussed with this completely editable template. It is available for immediate download depending on the needs and requirements of the user.
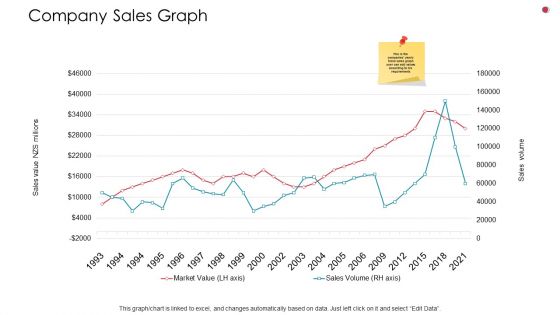
Company Sales Graph Business Analysis Method Ppt Professional Visuals PDF
Deliver an awe inspiring pitch with this creative company sales graph business analysis method ppt professional visuals pdf bundle. Topics like market value, sales can be discussed with this completely editable template. It is available for immediate download depending on the needs and requirements of the user.

Strategic Sales Area Plan With Leader Board Inspiration PDF
This slide depicts leader board of strategic sales territory to keep sales reps accountable. It includes parts such as strategic sales territory map, and sales leader board 2023. Showcasing this set of slides titled Strategic Sales Area Plan With Leader Board Inspiration PDF. The topics addressed in these templates are Strategic Sales Area, Plan Leader Board. All the content presented in this PPT design is completely editable. Download it and make adjustments in color, background, font etc. as per your unique business setting.
Determine Pipeline By Individual Sales Representative Performance Icons PDF
This slide provides information regarding monitoring of different sales representatives performance by determine sales duration at various pipeline stages. Deliver an awe inspiring pitch with this creative Determine Pipeline By Individual Sales Representative Performance Icons PDF bundle. Topics like Sales Representative, Sales Department, Shorter Sales Cycle can be discussed with this completely editable template. It is available for immediate download depending on the needs and requirements of the user.
Implementing Effective Distribution Company Sales From Current Distribution Channels Icons PDF
This slide includes the graphical depiction of current distribution strategies of the company with revenue numbers from last 3 years. Company is currently using strategies like retail store based sales, personal selling, direct mail etc. If you are looking for a format to display your unique thoughts, then the professionally designed Implementing Effective Distribution Company Sales From Current Distribution Channels Icons PDF is the one for you. You can use it as a Google Slides template or a PowerPoint template. Incorporate impressive visuals, symbols, images, and other charts. Modify or reorganize the text boxes as you desire. Experiment with shade schemes and font pairings. Alter, share or cooperate with other people on your work. Download Implementing Effective Distribution Company Sales From Current Distribution Channels Icons PDF and find out how to give a successful presentation. Present a perfect display to your team and make your presentation unforgettable.
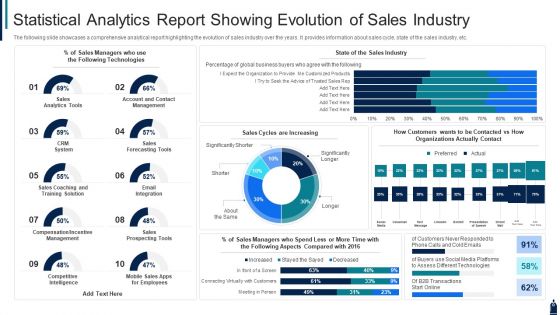
Statistical Analytics Report Showing Evolution Of Sales Industry Diagrams PDF
The following slide showcases a comprehensive analytical report highlighting the evolution of sales industry over the years. It provides information about sales cycle, state of the sales industry, etc. Showcasing this set of slides titled statistical analytics report showing evolution of sales industry diagrams pdf. The topics addressed in these templates are sales, technologies, system. All the content presented in this PPT design is completely editable. Download it and make adjustments in color, background, font etc. as per your unique business setting.
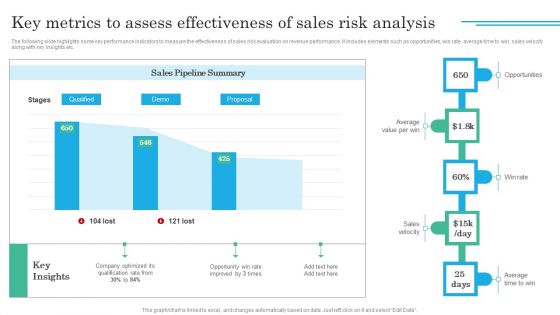
Implementing Sales Volatility Management Techniques Key Metrics To Assess Effectiveness Of Sales Designs PDF
The following slide highlights some key performance indicators to measure the effectiveness of sales risk evaluation on revenue performance. It includes elements such as opportunities, win rate, average time to win, sales velocity along with key insights etc. Do you have an important presentation coming up Are you looking for something that will make your presentation stand out from the rest Look no further than Implementing Sales Volatility Management Techniques Key Metrics To Assess Effectiveness Of Sales Designs PDF. With our professional designs, you can trust that your presentation will pop and make delivering it a smooth process. And with Slidegeeks, you can trust that your presentation will be unique and memorable. So why wait Grab Implementing Sales Volatility Management Techniques Key Metrics To Assess Effectiveness Of Sales Designs PDF today and make your presentation stand out from the rest.

Implementing Sales Volatility Management Techniques Major Factors Contributing Sales Risks Introduction PDF
Make sure to capture your audiences attention in your business displays with our gratis customizable Implementing Sales Volatility Management Techniques Major Factors Contributing Sales Risks Introduction PDF. These are great for business strategies, office conferences, capital raising or task suggestions. If you desire to acquire more customers for your tech business and ensure they stay satisfied, create your own sales presentation with these plain slides.
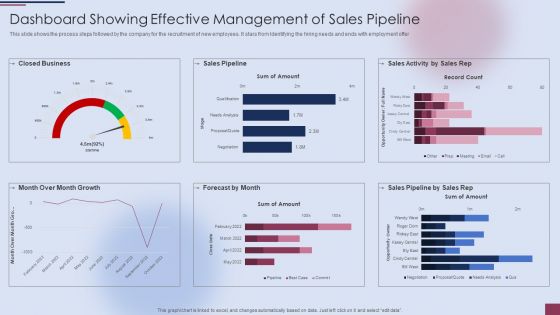
Dashboard Showing Effective Management Of Sales Pipeline Template PDF
This slide shows the process steps followed by the company for the recruitment of new employees. It stars from Identifying the hiring needs and ends with employment offer.Deliver and pitch your topic in the best possible manner with this Dashboard Showing Effective Management Of Sales Pipeline Template PDF. Use them to share invaluable insights on Closed Business, Sales Pipeline, Sales Activity and impress your audience. This template can be altered and modified as per your expectations. So, grab it now.

Property Leasing Dashboard Depicting Sale And Rent Analysis Diagrams PDF
This slide shows real estate leasing dashboard depicting sale and rent analysis which can be referred by property managers to manage various listing. It includes information about monthly stats of rent and sales, total proceeds, monthly target, rental properties, etc.Showcasing this set of slides titled property leasing dashboard depicting sale and rent analysis diagrams pdf The topics addressed in these templates are property leasing dashboard depicting sale and rent analysis All the content presented in this PPT design is completely editable. Download it and make adjustments in color, background, font etc. as per your unique business setting.
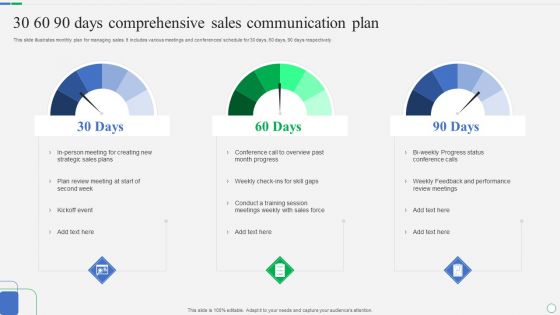
30 60 90 Days Comprehensive Sales Communication Plan Slides PDF
This slide illustrates monthly plan for managing sales. It includes various meetings and conferences schedule for 30 days, 60 days, 90 days respectively. Showcasing this set of slides titled 30 60 90 Days Comprehensive Sales Communication Plan Slides PDF. The topics addressed in these templates are Strategic Sales Plans, Skill Gaps, Review Meetings. All the content presented in this PPT design is completely editable. Download it and make adjustments in color, background, font etc. as per your unique business setting.
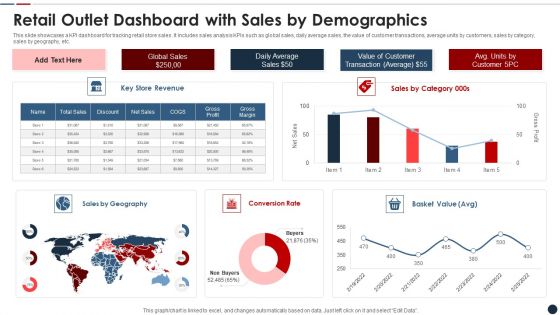
Retail Outlet Dashboard With Sales By Demographics Slides PDF
This slide showcases a KPI dashboard for tracking retail store sales. It includes sales analysis KPIs such as global sales, daily average sales, the value of customer transactions, average units by customers, sales by category, sales by geography, etc. Showcasing this set of slides titled retail outlet dashboard with sales by demographics slides pdf The topics addressed in these templates are Retail outlet dashboard with sales by demographics All the content presented in this PPT design is completely editable. Download it and make adjustments in color, background, font etc. as per your unique business setting.
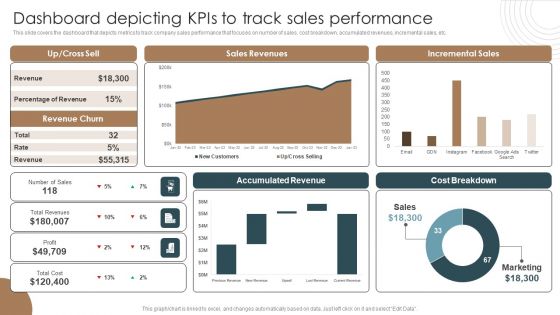
Dashboard Depicting Kpis To Track Sales Performance Integrating Technology To Transform Change Portrait PDF
This slide covers the dashboard that depicts metrics to track company sales performance that focuses on number of sales, cost breakdown, accumulated revenues, incremental sales, etc.If you are looking for a format to display your unique thoughts, then the professionally designed Dashboard Depicting Kpis To Track Sales Performance Integrating Technology To Transform Change Portrait PDF is the one for you. You can use it as a Google Slides template or a PowerPoint template. Incorporate impressive visuals, symbols, images, and other charts. Modify or reorganize the text boxes as you desire. Experiment with shade schemes and font pairings. Alter, share or cooperate with other people on your work. Download Dashboard Depicting Kpis To Track Sales Performance Integrating Technology To Transform Change Portrait PDF and find out how to give a successful presentation. Present a perfect display to your team and make your presentation unforgettable.
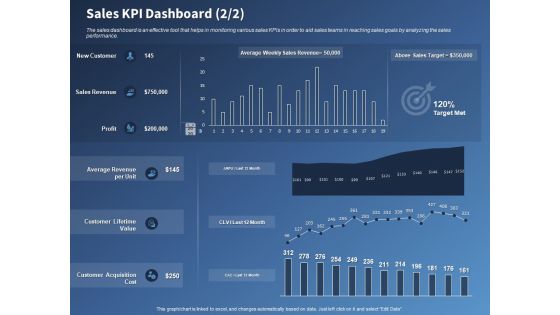
Performance Assessment Sales Initiative Report Sales KPI Dashboard Revenue Ppt Inspiration Slide Portrait PDF
Presenting this set of slides with name performance assessment sales initiative report sales kpi dashboard revenue ppt inspiration slide portrait pdf. The topics discussed in these slides are value, revenue, acquisition, cost. This is a completely editable PowerPoint presentation and is available for immediate download. Download now and impress your audience.
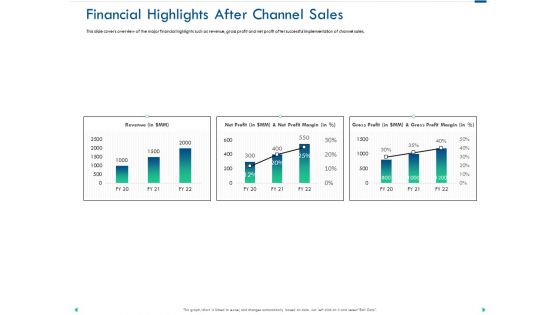
Channel Sales Taking Your Product To Market Financial Highlights After Channel Sales Professional PDF
Presenting this set of slides with name channel sales taking your product to market financial highlights after channel sales professional pdf. The topics discussed in these slides are revenue, profit margin, gross profit. This is a completely editable PowerPoint presentation and is available for immediate download. Download now and impress your audience.

Channel Sales Taking Your Product To Market Financial Highlights From Direct Sales Topics PDF
Presenting this set of slides with name channel sales taking your product to market financial highlights from direct sales topics pdf. The topics discussed in these slides are revenue, profit margin, gross profit. This is a completely editable PowerPoint presentation and is available for immediate download. Download now and impress your audience.

Performance Report With Monthly Sales Data Diagrams PDF
The slide displays a report including sales data for different months to evaluate and manage product performance. The slide includes average sales per month graph with key takeaways. Showcasing this set of slides titled Performance Report With Monthly Sales Data Diagrams PDF. The topics addressed in these templates are Business, Sales, Customization. All the content presented in this PPT design is completely editable. Download it and make adjustments in color, background, font etc. as per your unique business setting.
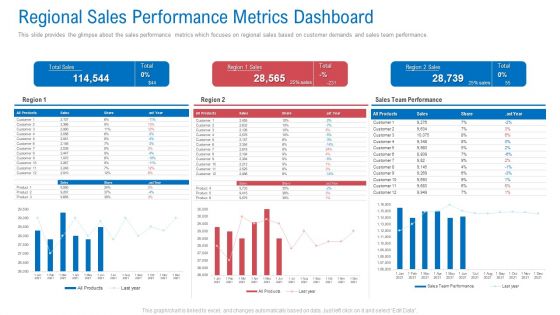
Regional Marketing Planning Regional Sales Performance Metrics Dashboard Information PDF
This slide provides the glimpse about the sales performance metrics which focuses on regional sales based on customer demands and sales team performance. Deliver an awe inspiring pitch with this creative regional marketing planning regional sales performance metrics dashboard information pdf bundle. Topics like regional sales performance metrics dashboard can be discussed with this completely editable template. It is available for immediate download depending on the needs and requirements of the user.

 Home
Home