Waterfall Chart
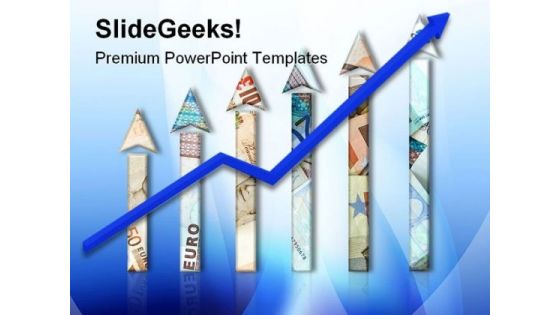
Euro Money Graph Business PowerPoint Background And Template 1210
Microsoft PowerPoint Template and Background with Money growth chart
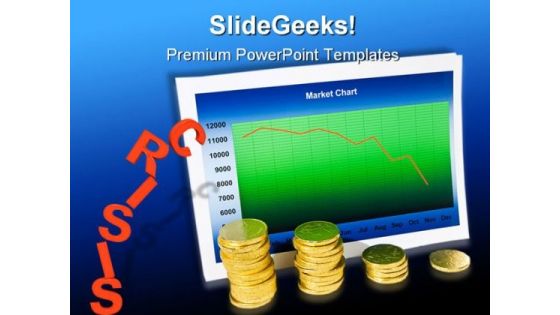
Market Crisis Finance PowerPoint Template 0610
Market chart with graph and stack of money
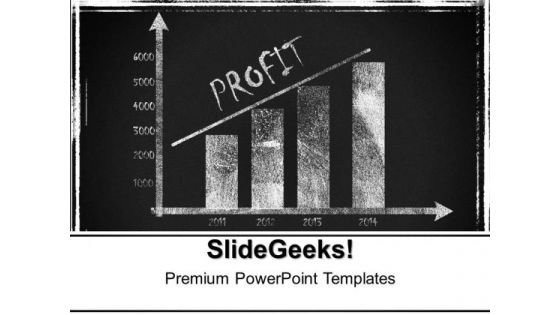
Profit Presentation Success PowerPoint Templates And PowerPoint Themes 0512
Microsoft Powerpoint Templates and Background with business chart on blackboard

Statistical Report For Sales Market Evaluation Clipart Pdf
This slide showcases statistical report for sales market analysis. It covers information about monthly market analysis chart, sales chart, distribution map and line chart. Showcasing this set of slides titled Statistical Report For Sales Market Evaluation Clipart Pdf. The topics addressed in these templates are Monthly Market Analysis Chart, Market Sales Chart, Sales Chart Each Market. All the content presented in this PPT design is completely editable. Download it and make adjustments in color, background, font etc. as per your unique business setting.
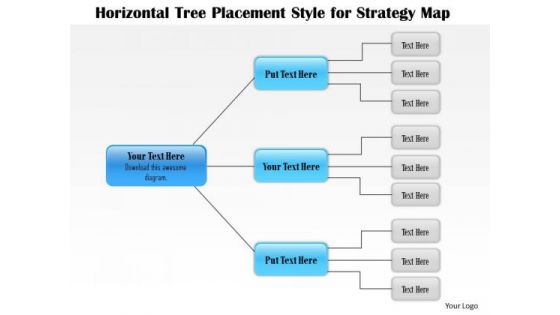
Business Framework Horizontal Tree Placement Style For Strategy Map PowerPoint Presentation
This Power Point diagram template has been designed with graphic of flow chart. This horizontal flow chart has been designed to show strategy. This editable flow chart can be used to display business or marketing strategy related topics.
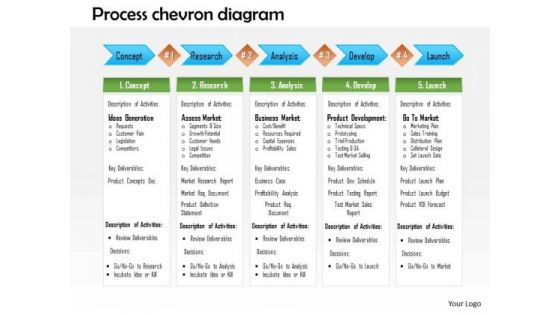
Business Framework Process Chevron Diagram PowerPoint Presentation
This business diagram displays framework for process chevron. This slide contains Linear process chart. This chart depicts steps of chevron process. Use this slide to build unique presentations.

Graph With America Flag Americana PowerPoint Templates And PowerPoint Backgrounds 0711
Microsoft PowerPoint Template and Background with bar chart and rippled american flag with currency
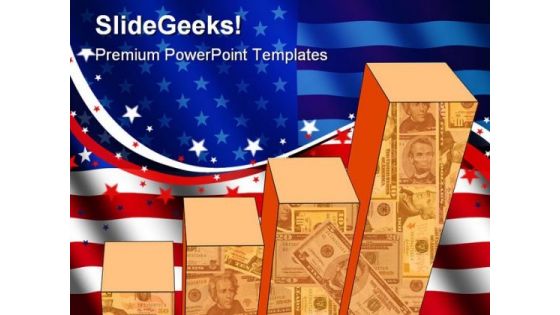
Graph With America Flag Americana PowerPoint Themes And PowerPoint Slides 0711
Microsoft PowerPoint Theme and Slide with bar chart and rippled american flag with currency

Money Graph Business PowerPoint Templates And PowerPoint Backgrounds 0711
Microsoft PowerPoint Template and Background with upward growth chart or graph of arrows made of money
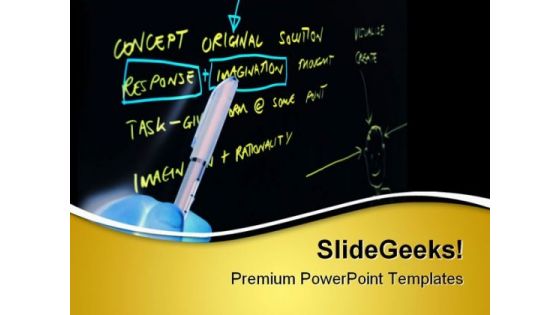
Business Planning Concept Marketing PowerPoint Templates And PowerPoint Backgrounds 0511
Microsoft PowerPoint Template and Background with business planning session on flip chart
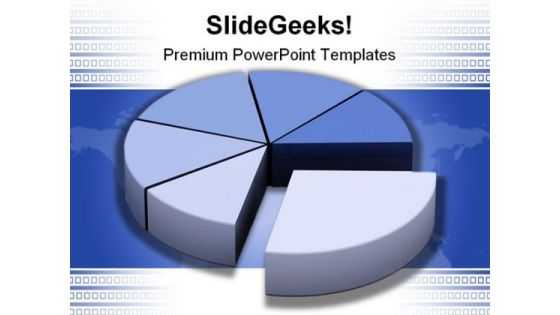
Pie Business PowerPoint Template 0510
Golden pie chart on a white background. Part of a series.

Market Direction Business PowerPoint Templates And PowerPoint Backgrounds 0311
Microsoft PowerPoint Template and Background with compass and a stock chart

Riding The Downturn Business PowerPoint Themes And PowerPoint Slides 0811
Microsoft PowerPoint Theme and Slide with a dollar symbol surfing a downward chart
Adjusting The Data PowerPoint Icon C
3d illustration of a simple wrench turning/adjusting the elements on a multi-colored bar chart
Adjusting The Data PowerPoint Icon Cc
3d illustration of a simple wrench turning/adjusting the elements on a multi-colored bar chart
Adjusting The Data PowerPoint Icon F
3d illustration of a simple wrench turning/adjusting the elements on a multi-colored bar chart
Adjusting The Data PowerPoint Icon R
3d illustration of a simple wrench turning/adjusting the elements on a multi-colored bar chart
Adjusting The Data PowerPoint Icon S
3d illustration of a simple wrench turning/adjusting the elements on a multi-colored bar chart
Analyzing The Data PowerPoint Icon C
3d illustration of a magnifying glass hovering over a three-dimensional multi-colored bar chart
Analyzing The Data PowerPoint Icon Cc
3d illustration of a magnifying glass hovering over a three-dimensional multi-colored bar chart
Analyzing The Data PowerPoint Icon F
3d illustration of a magnifying glass hovering over a three-dimensional multi-colored bar chart
Analyzing The Data PowerPoint Icon R
3d illustration of a magnifying glass hovering over a three-dimensional multi-colored bar chart
Analyzing The Data PowerPoint Icon S
3d illustration of a magnifying glass hovering over a three-dimensional multi-colored bar chart
Business Growth Globe PowerPoint Template 0510
3d illustration of three up arrows on a flat box chart
Accessing The Data Security PowerPoint Template 1010
3d illustration of a large brass key and lock protruding from a simple pie chart
Financial Crisis02 Business PowerPoint Templates And PowerPoint Backgrounds 0711
Microsoft PowerPoint Template and Background with a dollar symbol surfing a downward chart

Riding The Downturn Business PowerPoint Templates And PowerPoint Backgrounds 0811
Microsoft PowerPoint Template and Background with a dollar symbol surfing a downward chart
Positive Earning Business PowerPoint Templates And PowerPoint Backgrounds 1011
Microsoft PowerPoint Template and Background with a pen and a magnifying glass focusing on a chart

Business Calculations Sales PowerPoint Themes And PowerPoint Slides 0411
Microsoft PowerPoint Theme and Slide with business still life with coffee and chart showing success

Business Calculations Sales PowerPoint Templates And PowerPoint Backgrounds 0411
Microsoft PowerPoint Template and Background with business still life with coffee and chart showing success
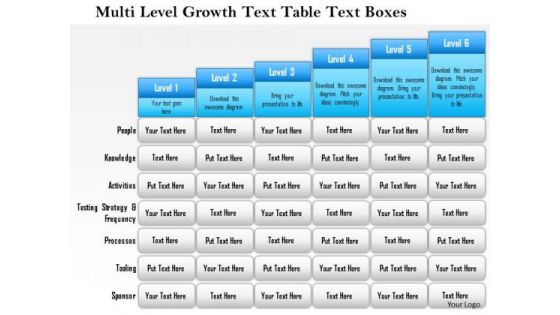
Business Framework Multi Level Growth Text Table Text Boxes 3 PowerPoint Presentation
This Power Point template slide has been crafted with graphic of six staged text box chart. This chart can be used to show the multilevel growth. Use this table diagram in your business presentation and show growth.
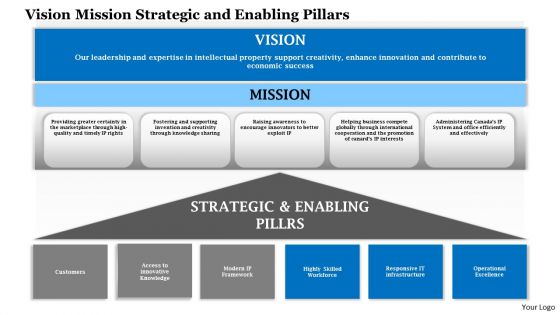
Business Framework Vision Mission Strategic And Enabling Pillars PowerPoint Presentation

Business Framework Performance Review Tools PowerPoint Presentation
This Power Point template slide has been designed with graphic of text box chart. This text box chart contains the performance tools and ratings. This PPT slide can be used for business and individual performance judgment techniques with these tools.
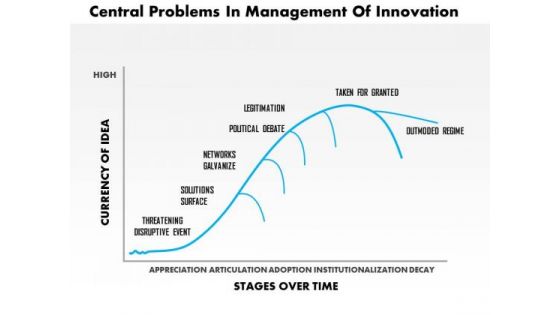
Business Framework Central Problems In Management Of Innovation PowerPoint Presentation
This business framework PPT has been crafted with graphic of analysis chart. This chart is displaying the curve of analysis for central problem in management of innovation. Use this diagram slide and display problems in form of analysis.
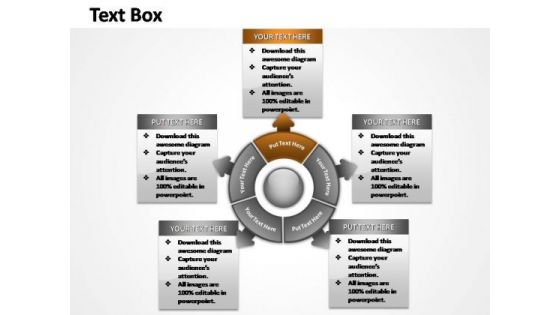
PowerPoint Slides Sales Steps Ppt Process
This chart visualize the of process steps, reoccurrences and components or of your company structure or product features.

PowerPoint Slides Sales Steps Ppt Slide Designs
Circular business process chart assist you in creating your project roadmap with different ways, interim goals and project steps.

Business Education PowerPoint Templates Business Bar Graph Data Driven Ppt Slides
Business Education PowerPoint Templates Business bar graph data driven PPT Slides-This PowerPoint slide is a data driven Columns Chart. The number of columns depend on the data.-Business Editable PowerPoint Templates Business beveled column chart PPT Slides-This ppt can be used for concepts relating to-chart,, graph, growth, investment, , market, percentage, , presentation report, results, statistics, stock, success and business.

Bar Graph With Arrow Business PowerPoint Templates And PowerPoint Themes 0512
Microsoft Powerpoint Templates and Background with bar chart growth-These templates can be used for presentations relating to-Bar chart growth, business, marketing, finance, success, sales-Bar Garph With Arrow Business PowerPoint Templates And PowerPoint Themes 0512

Dashboard To Impact The Performance Powerpoint Slides
This PowerPoint template graphics of meter chart. Download this PPT chart for business performance analysis. This PowerPoint slide is of great help in the business sector to make realistic presentations and provides effective way of presenting your newer thoughts.
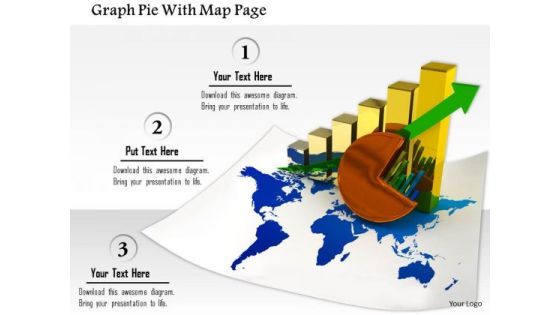
Stock Photo Graph Pie With Map Page PowerPoint Slide
This image slide contains business charts on world map. This image is designed with bar graph and pie chart on world map depicting global economy. Use this image slide to represent financial growth in any business presentation.
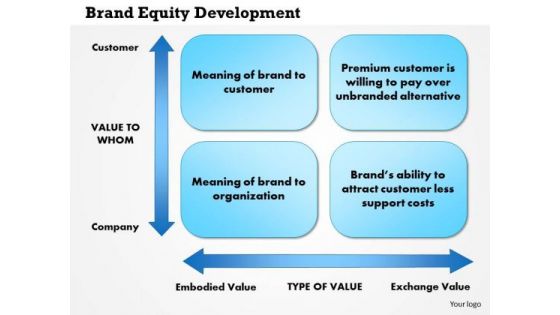
Business Framework Brand Equity Development PowerPoint Presentation
This power point diagram slide has been crafted with graphic of two axial flow chart. This chart refers to the concept of brand equity development. Display this concept in your presentations and get detailed information about brand architecture.
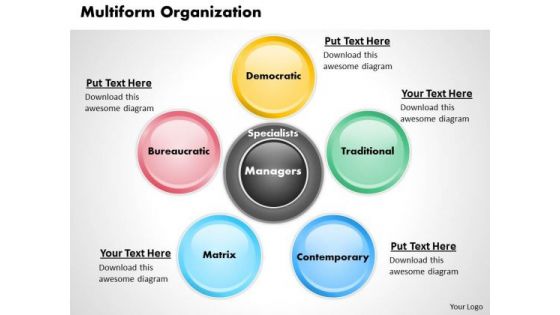
Business Framework Multiform Organization PowerPoint Presentation
This power point template has been crafted with multiform organization chart. This PPT contains five staged multiform organization chart which can be used for various organizational operations. Add this PPT in your business presentations and create an impact on viewers.
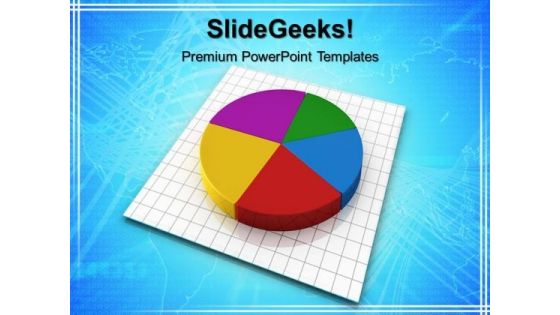
Pie Graph Business PowerPoint Templates And PowerPoint Themes 0612
Pie Graph Business PowerPoint Templates And PowerPoint Themes PPT Slides-Microsoft Powerpoint Templates and Background with pie chart graph
Pie Graph Marketing PowerPoint Templates And PowerPoint Themes 0612
Pie Graph Marketing PowerPoint Templates And PowerPoint Themes PPT Slides-Microsoft Powerpoint Templates and Background with pie chart graph
Business Focus Graph Future PowerPoint Backgrounds And Templates 1210
Microsoft PowerPoint Template and Background with a magnifying glass focusing on a chart in the business section of the newspaper
Products Sale Graph Business PowerPoint Templates And PowerPoint Themes 0812
Products Sale Graph Business PowerPoint Templates And PowerPoint Themes 0812-Microsoft Powerpoint Templates and Background with sales growth business chart

Business Growth Success Finance PowerPoint Background And Template 1210
Microsoft PowerPoint Template and Background with A business man climbs up a pie chart as spiral stairs of growth success.

Software Development Life Cycle Models Applied By Industries Template PDF
This slide depicts the percentage of the software development lifecycle models used by industries in 2021, including the waterfall, spiral, iterative, agile, and RAD models. Deliver an awe inspiring pitch with this creative software development life cycle models applied by industries template pdf bundle. Topics like time usage of software development life cycle models in software development designs pdf can be discussed with this completely editable template. It is available for immediate download depending on the needs and requirements of the user.

Solution Development Process SDLC Models Applied By Industries Rules PDF
This slide depicts the percentage of the software development lifecycle models used by industries in 2022, including the waterfall, spiral, iterative, agile, and RAD models.Deliver and pitch your topic in the best possible manner with this Solution Development Process SDLC Models Applied By Industries Rules PDF. Use them to share invaluable insights on Industries, Choose Methodology, Develop Software and impress your audience. This template can be altered and modified as per your expectations. So, grab it now.
Goal Pie Chat Concept Marketing PowerPoint Templates And PowerPoint Themes 0712
Goal Pie Chat Concept Marketing PowerPoint Templates And PowerPoint Themes Business Power Points-Microsoft Powerpoint Templates and Background with pie chart concept

Bar Graph And Pie Chat Business PowerPoint Templates And PowerPoint Themes 0712
Bar Graph And Pie Chat Business PowerPoint Templates And PowerPoint Themes 0712-Microsoft Powerpoint Templates and Background with bar and pie chart

Business Framework Cash Flow PowerPoint Presentation
This business framework power point template has been crafted with graphic of multistage flowchart. This flow chart displays the concept of cash flow. This cash flow chart contains various decision boxes for explaining the importance of decision. this PPT is designed for business presentations use it and create an impact on viewers.
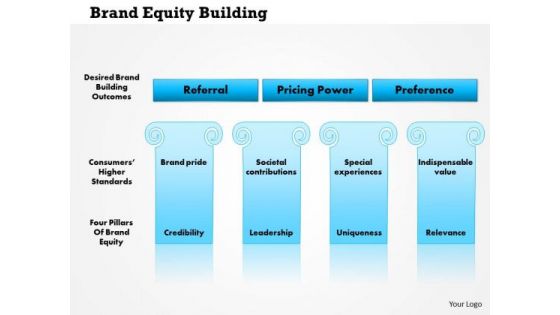
Business Framework Brand Equity Building PowerPoint Presentation
This business power point diagram slide has been crafted with graphic of two level flow chart. This flow chart is used to display brand equity building concept. To display the brand extension and brand strategy, use this exclusive graphic slide in your business presentations.
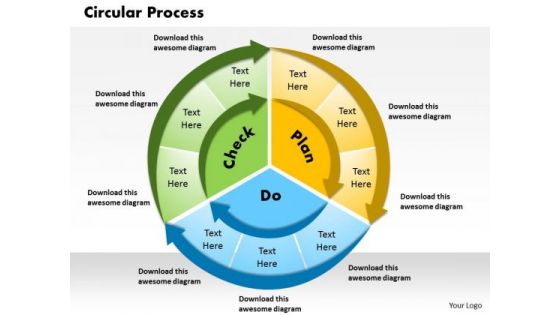
Business Framework Circular Process PowerPoint Presentation
Explain the circular process and its usage in business process flow. To define this we have used the graphic of three colored circular process chart. This chart can be used for various business flow representation. Use this Pot for business and marketing process flow related presentations.
Rescue Statistics PowerPoint Icon C
3d illustration of a multi-segment colorful bar chart placed inside of a large red and white lifesaver on a reflective surface
Rescue Statistics PowerPoint Icon Cc
3d illustration of a multi-segment colorful bar chart placed inside of a large red and white lifesaver on a reflective surface
Rescue Statistics PowerPoint Icon S
3d illustration of a multi-segment colorful bar chart placed inside of a large red and white lifesaver on a reflective surface

Ppt 3d Linear Work Flow Swim Lane Diagram PowerPoint Template Templates
PPT 3d linear work flow swim lane diagram powerpoint template Templates-This 3D Business PowerPoint Diagram Displays the circular arrows connected to each other signifying the continuous flow of steps to be executed. This Diagram can be used to represent Process charts, Business chart, Sales process chart and Finance process etc.-PPT 3d linear work flow swim lane diagram powerpoint template Templates-Abstract, Action, Attention, Business, Chart, Clipart, Commerce, Concept, Conceptual, Corporate, Customer, Design, Desire, Diagram, Flow, Goals, Guide, Icon, Idea, Illustration, Interest, Manage, Management, Map, Marketing, Mind, Mission, Model, Organization, Performance, Planning, Plans, Process

Ppt 7 Linear Curved Arrows PowerPoint 2010 Placed Sequentially Templates
PPT 7 linear curved arrows powerpoint 2010 placed sequentially Templates-This 3D Business PowerPoint Diagram Displays the curved arrows Successive to each other signifying the continuous flow of steps to be executed. This Diagram can be used to represent Process charts, Business chart, and Sales process chart and Finance process etc. An excellent graphic to attract the attention of your audience to improve earnings.-PPT 7 linear curved arrows powerpoint 2010 placed sequentially Templates-Arrow, Background, Process, Business, Chart, Diagram, Financial, Graphic, Gray, Icon, Illustration, Management, Orange, Perspective, Process, Reflection, Stage, Text, Transparency
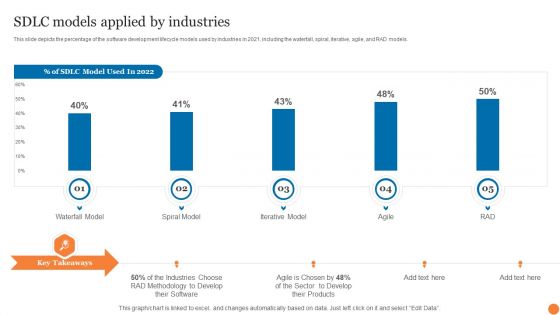
SDLC Models Applied By Industries Phases Of Software Development Procedure Mockup PDF
This slide depicts the percentage of the software development lifecycle models used by industries in 2021, including the waterfall, spiral, iterative, agile, and RAD models.This SDLC Models Applied By Industries Phases Of Software Development Procedure Mockup PDF is perfect for any presentation, be it in front of clients or colleagues. It is a versatile and stylish solution for organizing your meetings. The product features a modern design for your presentation meetings. The adjustable and customizable slides provide unlimited possibilities for acing up your presentation. Slidegeeks has done all the homework before launching the product for you. So, do not wait, grab the presentation templates today.

 Home
Home