Venture Capital Dashboard
Agile Approaches For IT Team Playbook Tracking User Stories Across Agile Project Development Dashboard Topics PDF
This slide provides information regarding dashboard for tracking user stories across agile project development including work items, etc. Boost your pitch with our creative Agile Approaches For IT Team Playbook Tracking User Stories Across Agile Project Development Dashboard Topics PDF. Deliver an awe inspiring pitch that will mesmerize everyone. Using these presentation templates you will surely catch everyones attention. You can browse the ppts collection on our website. We have researchers who are experts at creating the right content for the templates. So you do not have to invest time in any additional work. Just grab the template now and use them.
Playbook For Agile Software Development Teams Tracking User Stories Across Agile Project Development Dashboard Portrait PDF
This slide provides information regarding dashboard for tracking user stories across agile project development including work items, etc. Boost your pitch with our creative Playbook For Agile Software Development Teams Tracking User Stories Across Agile Project Development Dashboard Portrait PDF. Deliver an awe inspiring pitch that will mesmerize everyone. Using these presentation templates you will surely catch everyones attention. You can browse the ppts collection on our website. We have researchers who are experts at creating the right content for the templates. So you do not have to invest time in any additional work. Just grab the template now and use them.
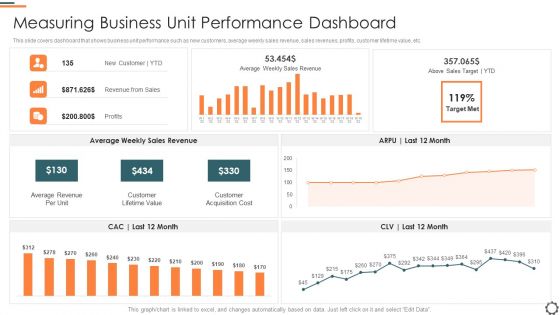
Agile Group For Product Development Measuring Business Unit Performance Dashboard Pictures PDF
This slide covers dashboard that shows business unit performance such as new customers, average weekly sales revenue, sales revenues, profits, customer lifetime value, etc. Deliver and pitch your topic in the best possible manner with this agile group for product development measuring business unit performance dashboard pictures pdf. Use them to share invaluable insights on average revenue per unit, customer lifetime value, customer acquisition cost and impress your audience. This template can be altered and modified as per your expectations. So, grab it now.
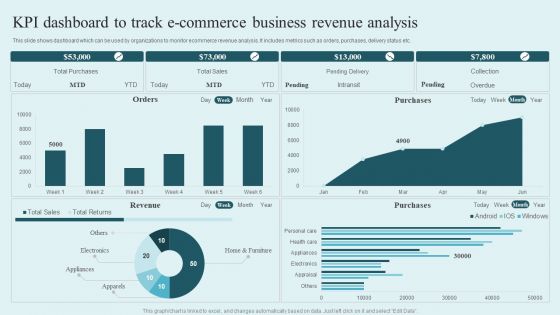
KPI Dashboard To Track E Commerce Business Revenue Analysis Rules PDF
This slide shows dashboard which can be used by organizations to monitor ecommerce revenue analysis. It includes metrics such as orders, purchases, delivery status etc. Pitch your topic with ease and precision using this KPI Dashboard To Track E Commerce Business Revenue Analysis Rules PDF. This layout presents information on Total Purchases, Total Sales, Pending Delivery, Collection. It is also available for immediate download and adjustment. So, changes can be made in the color, design, graphics or any other component to create a unique layout.
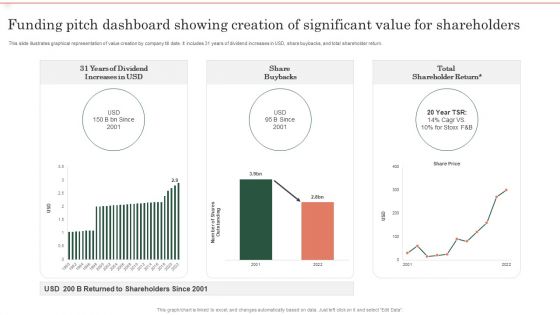
Funding Pitch Dashboard Showing Creation Of Significant Value For Shareholders Themes PDF
This slide illustrates graphical representation of value creation by company till date. It includes 31 years of dividend increases in USD, share buybacks, and total shareholder return. Showcasing this set of slides titled Funding Pitch Dashboard Showing Creation Of Significant Value For Shareholders Themes PDF. The topics addressed in these templates are 31 Years Dividend, Increases USD, Share Buybacks. All the content presented in this PPT design is completely editable. Download it and make adjustments in color, background, font etc. as per your unique business setting.

Sales Performance Monitoring Dashboard With Customer Details Ppt Infographics Themes PDF
This slide illustrates sales performance tracking dashboard with critical information. It provides information about customer details, invoice, earnings, leads, pending delivery, revenue, etc. Pitch your topic with ease and precision using this Sales Performance Monitoring Dashboard With Customer Details Ppt Infographics Themes PDF. This layout presents information on Todays Revenue, Today Delivered, Pending Delivery, Total Leads. It is also available for immediate download and adjustment. So, changes can be made in the color, design, graphics or any other component to create a unique layout.
Designing And Deployment CRM Implementation Dashboard With Sales Pipeline Icons PDF
The following slide showcases the CRM dashboard which includes leads, deals, sales revenue, revenue by products, total leads by source, total leads by status and lead distribution. Deliver and pitch your topic in the best possible manner with this designing and deployment crm implementation dashboard with sales pipeline icons pdf. Use them to share invaluable insights on crm, lead distribution, sales revenue, total leads by source, deals, sales pipeline by stage and impress your audience. This template can be altered and modified as per your expectations. So, grab it now.

Establishing Operational Risk Framework Banking Operational Risk Management KPI Dashboard Brochure PDF
Mentioned slide displays operational risk management dashboard. It includes KPIs such as operational risk name, control performance, open issues, risk by type and risk map. Deliver an awe-inspiring pitch with this creative establishing operational risk framework banking operational risk management kpi dashboard brochure pdf bundle. Topics like operational risk, control performance, risk by map can be discussed with this completely editable template. It is available for immediate download depending on the needs and requirements of the user.
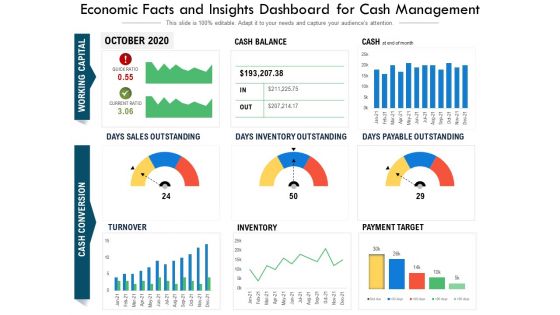
Economic Facts And Insights Dashboard For Cash Management Ppt PowerPoint Presentation Outline Guide PDF
Pitch your topic with ease and precision using this economic facts and insights dashboard for cash management ppt powerpoint presentation outline guide pdf. This layout presents information on days sales outstanding, days inventory outstanding, days payable outstanding, accounts payable by payment target, inventory, ar turnover vs ap turnover. It is also available for immediate download and adjustment. So, changes can be made in the color, design, graphics or any other component to create a unique layout.

Smartphone Application User Acquisition Techniques Application User Acquisition Analysis Dashboard Information PDF
Following slide shows dashboard that help company to track and measure impact of user acquisition strategy on application performance. It include indicators such as lead opportunities, new opportunities, visitors, revenue etc. Boost your pitch with our creative Smartphone Application User Acquisition Techniques Application User Acquisition Analysis Dashboard Information PDF. Deliver an awe inspiring pitch that will mesmerize everyone. Using these presentation templates you will surely catch everyones attention. You can browse the ppts collection on our website. We have researchers who are experts at creating the right content for the templates. So you do not have to invest time in any additional work. Just grab the template now and use them.

How To Implement Cloud Collaboration Dashboard For Monitoring Project Team Workload Portrait PDF
The following slide depicts dashboard for observing project resource utilization. It provides information about billable utilization, company target, project hours, over hours, project allocations, etc. Deliver and pitch your topic in the best possible manner with this How To Implement Cloud Collaboration Dashboard For Monitoring Project Team Workload Portrait PDF. Use them to share invaluable insights on Actual Utilization, Resource Utilization, Planned Utilization and impress your audience. This template can be altered and modified as per your expectations. So, grab it now.
Illustrating Product Leadership Plan Incorporating Innovative Techniques Dashboard Depicting Sales Icons PDF
This slide focuses on dashboard that depicts sales product performance that includes top products in revenues, online verses offline purchases, incremental sales by campaign and cost of goods sold. Deliver an awe inspiring pitch with this creative illustrating product leadership plan incorporating innovative techniques dashboard depicting sales icons pdf bundle. Topics like incremental sales by campaign, top products in revenue, online vs offline purchases, cost of goods sold can be discussed with this completely editable template. It is available for immediate download depending on the needs and requirements of the user.
SAC Planning And Implementation SAP Analytics Cloud Dashboard For Product Sales Analysis Icons PDF
This slide illustrates the SAP Analytics Cloud dashboard to monitor product sales performance. It provides information regarding the gross margin and net revenue earned, product performance state wise and year wise. Deliver and pitch your topic in the best possible manner with this SAC Planning And Implementation SAP Analytics Cloud Dashboard For Product Sales Analysis Icons PDF. Use them to share invaluable insights on Gross Margin, Earned Quarter Wise, Gross Margin, Net Revenue and impress your audience. This template can be altered and modified as per your expectations. So, grab it now.

Sales Department Management To Enhance Performance Monthly Activities Management KPI Dashboard Brochure PDF
This slide represents the dashboard for sales managers to easily check in the progress towards the achievement of sales objectives and targets. It includes KPIs for sales team monthly and daily activities such as outreach, emails sent per day, calls, conversion, revenue per day etc.Pitch your topic with ease and precision using this Sales Department Management To Enhance Performance Monthly Activities Management KPI Dashboard Brochure PDF. This layout presents information on Social Impression, Conversions Past, Outreach Past. It is also available for immediate download and adjustment. So, changes can be made in the color, design, graphics or any other component to create a unique layout.
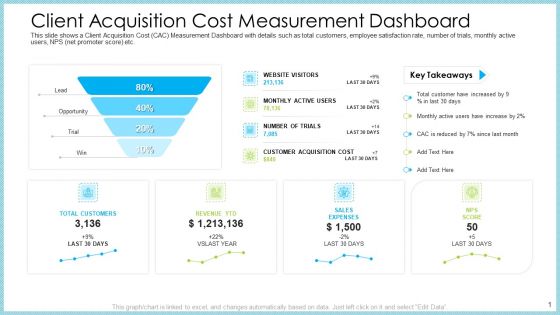
Customer Acquiring Price For Retaining New Clients Client Acquisition Cost Measurement Dashboard Ideas PDF
This slide shows a Client Acquisition Cost CAC Measurement Dashboard with details such as total customers, employee satisfaction rate, number of trials, monthly active users, NPS net promoter score etc. Deliver an awe inspiring pitch with this creative customer acquiring price for retaining new clients client acquisition cost measurement dashboard ideas pdf bundle. Topics like nps score, sales expenses, revenue ytd, total customers can be discussed with this completely editable template. It is available for immediate download depending on the needs and requirements of the user.

Expansion Strategic Plan Dashboard To Analyse Sales Post Global Expansion Clipart PDF
This slide showcase dashboard that can help organization track sales after global expansion. Its key components are sales target, target achievement, sales by channel, inventory days outstanding, sales growth, gross profit, gross profit margin etc. Boost your pitch with our creative Expansion Strategic Plan Dashboard To Analyse Sales Post Global Expansion Clipart PDF. Deliver an awe-inspiring pitch that will mesmerize everyone. Using these presentation templates you will surely catch everyones attention. You can browse the ppts collection on our website. We have researchers who are experts at creating the right content for the templates. So you dont have to invest time in any additional work. Just grab the template now and use them.
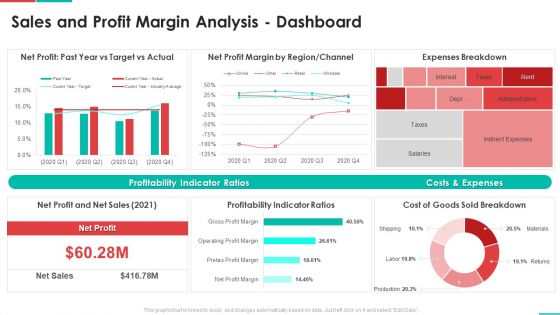
Roadmap For Financial Accounting Transformation Sales And Profit Margin Analysis Dashboard Pictures PDF
Deliver an awe inspiring pitch with this creative roadmap for financial accounting transformation sales and profit margin analysis dashboard pictures pdf bundle. Topics like profitability indicator ratios, costs and expenses, expenses breakdown can be discussed with this completely editable template. It is available for immediate download depending on the needs and requirements of the user.
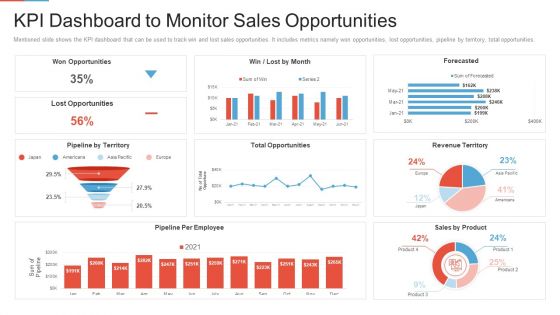
Marketing Outlining Segmentation Initiatives Kpi Dashboard To Monitor Sales Opportunities Information PDF
Mentioned slide shows the KPI dashboard that can be used to track win and lost sales opportunities. It includes metrics namely won opportunities, lost opportunities, pipeline by territory, total opportunities. Deliver an awe inspiring pitch with this creative marketing outlining segmentation initiatives kpi dashboard to monitor sales opportunities information pdf bundle. Topics like opportunities, pipeline by territory, revenue territory, sales by product, pipeline per employee can be discussed with this completely editable template. It is available for immediate download depending on the needs and requirements of the user.
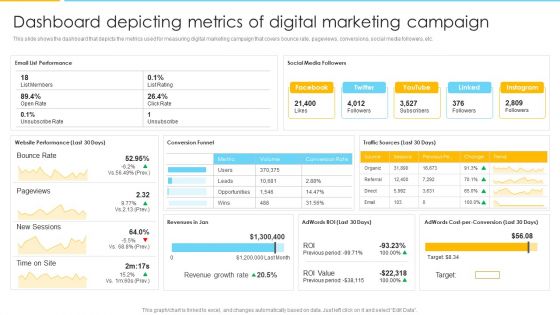
Optimizing Ecommerce Marketing Plan To Improve Sales Dashboard Depicting Metrics Of Digital Marketing Campaign Information PDF
This slide shows the dashboard that depicts the metrics used for measuring digital marketing campaign that covers bounce rate, pageviews, conversions, social media followers, etc. Deliver and pitch your topic in the best possible manner with this Optimizing Ecommerce Marketing Plan To Improve Sales Dashboard Depicting Metrics Of Digital Marketing Campaign Information PDF. Use them to share invaluable insights on Traffic Sources, Conversion Rate, Revenue Growth Rate and impress your audience. This template can be altered and modified as per your expectations. So, grab it now.
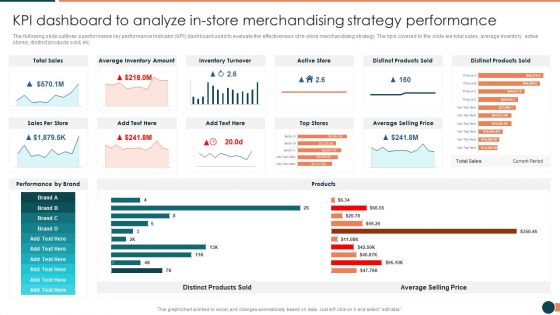
Developing Retail Marketing Strategies To Increase Revenue KPI Dashboard To Analyze Instore Information PDF
The following slide outlines a performance key performance indicator KPI dashboard used to evaluate the effectiveness of in store merchandising strategy. The kpis covered in the slide are total sales, average inventory, active stores, distinct products sold, etc.Deliver an awe inspiring pitch with this creative Developing Retail Marketing Strategies To Increase Revenue KPI Dashboard To Analyze Instore Information PDF bundle. Topics like Inventory Turnover, Distinct Products, Average Inventory can be discussed with this completely editable template. It is available for immediate download depending on the needs and requirements of the user.

Risk Management KPI Dashboard Of Real Estate Company Managing Commercial Property Risks Elements PDF
The following slide exhibits a key performance indicator KPI dashboard which can be used to evaluate the risks involved in real estate business. The KPIs covered in the slide are corporate risk, control performance, open issues etc.Deliver an awe inspiring pitch with this creative Risk Management KPI Dashboard Of Real Estate Company Managing Commercial Property Risks Elements PDF bundle. Topics like Control Performance, Corporate Risk, Effect Medium can be discussed with this completely editable template. It is available for immediate download depending on the needs and requirements of the user.
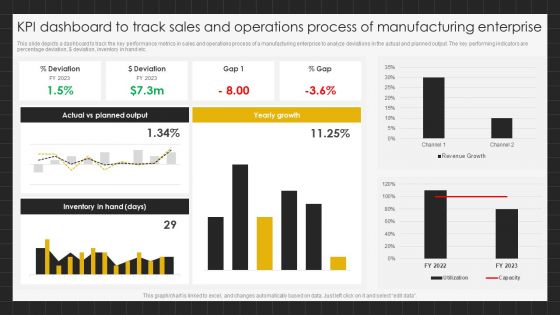
KPI Dashboard To Track Sales And Operations Process Of Manufacturing Enterprise Brochure PDF
This slide depicts a dashboard to track the key performance metrics in sales and operations process of a manufacturing enterprise to analyze deviations in the actual and planned output. The key performing indicators are percentage deviation, dollar deviation, inventory in hand etc.Pitch your topic with ease and precision using this KPI Dashboard To Track Sales And Operations Process Of Manufacturing Enterprise Brochure PDF. This layout presents information on Planned Output, Yearly Growth, Inventory Hand. It is also available for immediate download and adjustment. So, changes can be made in the color, design, graphics or any other component to create a unique layout.

Inventory Stock Out And Decline Of Sales Analysis Dashboard Inspiration PDF
Following slide presents a key performance indicating dashboard that can be used by businesses to track Inventory stock out and lost sales. Major key performance indicators are percentage stockouts, amount of sales, lost sales accountability, etc. Pitch your topic with ease and precision using this Inventory Stock Out And Decline Of Sales Analysis Dashboard Inspiration PDF. This layout presents information on Lost Sales Summary, Stock Out Details It is also available for immediate download and adjustment. So, changes can be made in the color, design, graphics or any other component to create a unique layout.

Digital Approach To Client Loan Processing And Performance Dashboard For Bank
This slide showcases loan performance dashboard for banks which helps in assessing loan terms and funding times. It provides information regarding total no. of loan granted, loan origination trend, loan approval amount per product and per branch etc. Whether you have daily or monthly meetings, a brilliant presentation is necessary. Digital Approach To Client Loan Processing And Performance Dashboard For Bank can be your best option for delivering a presentation. Represent everything in detail using Digital Approach To Client Loan Processing And Performance Dashboard For Bank and make yourself stand out in meetings. The template is versatile and follows a structure that will cater to your requirements. All the templates prepared by Slidegeeks are easy to download and edit. Our research experts have taken care of the corporate themes as well. So, give it a try and see the results.

KPI Dashboard To Measure Ecommerce Sales And Marketing Project Performance Portrait PDF
Following slide showcases performance KPI dashboard used to measure the ecommerce marketing project results. The Key performance indicators mentioned in the slide are new customers, repeat purchase rate, average order value, conversion rate, etc. Pitch your topic with ease and precision using this KPI Dashboard To Measure Ecommerce Sales And Marketing Project Performance Portrait PDF. This layout presents information on Purchase Rate, Average Order Value, Ecommerce Conversion Rate. It is also available for immediate download and adjustment. So, changes can be made in the color, design, graphics or any other component to create a unique layout.

Marketing Techniques Online Offline Commercial Activities E Mail Campaign Dashboard Information PDF
The following slide displays the key metrics for the E-mail marketing campaign of the organization, the following slide highlights the direct sessions, the organic sessions and the frequency oat which e-mail have been sent Deliver an awe inspiring pitch with this creative marketing techniques online offline commercial activities e mail campaign dashboard information pdf bundle. Topics like e mail campaign dashboard can be discussed with this completely editable template. It is available for immediate download depending on the needs and requirements of the user.
Executing Online Solution In Banking Dashboard Tracking Customer Activities And Revenue Generated Information PDF
This slide contains dashboard that will allow bank to track the customer activities in terms of new customer acquired, customer acquisition cost and overall revenue generated. Deliver and pitch your topic in the best possible manner with this executing online solution in banking dashboard tracking customer activities and revenue generated information pdf. Use them to share invaluable insights on compared to previous year, target achievement, customers acquisition, actual revenue and impress your audience. This template can be altered and modified as per your expectations. So, grab it now.
Retail Trading Platform Dashboard Tracking Essential Kpis For Ecommerce Performance Diagrams PDF
This slide provides information regarding essential KPIs for ecommerce performance dashboard tracking average bounce rate, new vs. old customers, channel revenue vs. channel acquisitions costs, channel revenue vs. sales, average conversion rate, etc. Deliver an awe inspiring pitch with this creative retail trading platform dashboard tracking essential kpis for ecommerce performance diagrams pdf bundle. Topics like average bounce rate, average conversion rate, bounce rate, channel revenue sales can be discussed with this completely editable template. It is available for immediate download depending on the needs and requirements of the user.
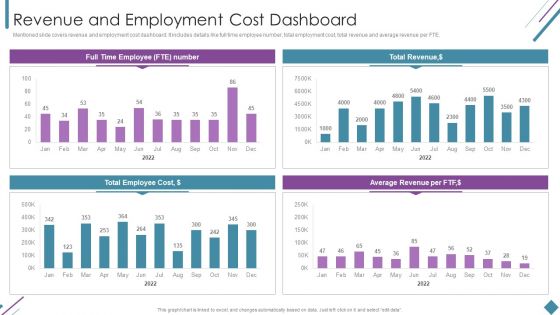
Metrics To Measure Business Performance Revenue And Employment Cost Dashboard Clipart PDF
Mentioned slide covers revenue and employment cost dashboard. It includes details like full time employee number, total employment cost, total revenue and average revenue per FTE. Deliver and pitch your topic in the best possible manner with this Metrics To Measure Business Performance Revenue And Employment Cost Dashboard Clipart PDF. Use them to share invaluable insights on Total Revenue, Average Revenue Per, Total Employee Cost and impress your audience. This template can be altered and modified as per your expectations. So, grab it now.
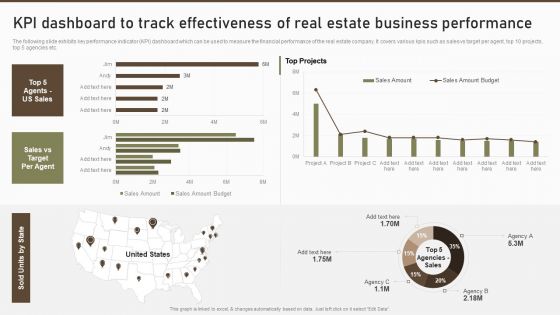
KPI Dashboard To Track Effectiveness Of Real Estate Business Performance Guidelines PDF
The following slide exhibits key performance indicator KPI dashboard which can be used to measure the financial performance of the real estate company. It covers various kpis such as sales vs target per agent, top 10 projects, top 5 agencies etc.Deliver an awe inspiring pitch with this creative KPI Dashboard To Track Effectiveness Of Real Estate Business Performance Guidelines PDF bundle. Topics like Top Projects, Sales Amount, Sales Amount can be discussed with this completely editable template. It is available for immediate download depending on the needs and requirements of the user.

Business Operational Expenditure Dashboard Indicating Revenue And Costs Metrics Pictures PDF
This slide shows operating expenses OPEX dashboard indicating revenue and costs metrics which can be referred by companies to manage various operating expenses of various departments. It contains information about cost center, revenue per company, company code, etc. Pitch your topic with ease and precision using this Business Operational Expenditure Dashboard Indicating Revenue And Costs Metrics Pictures PDF. This layout presents information on Business Operational, Costs Metrics, Revenue. It is also available for immediate download and adjustment. So, changes can be made in the color, design, graphics or any other component to create a unique layout.

Retail KPI Dashboard Showing Total Sales Per Labor Hour Sales By Unit Area Guidelines PDF
Deliver an awe inspiring pitch with this creative retail kpi dashboard showing total sales per labor hour sales by unit area guidelines pdf bundle. Topics like sales per labour hour by location, sales by location for children, sales by unit area can be discussed with this completely editable template. It is available for immediate download depending on the needs and requirements of the user.
Omnichannel Marketing Dashboard With Revenue And Total Spend Revenue Ppt Icon Gridlines PDF
This slide shows an Omnichannel Marketing Dashboard with marketing spend by channel, total spend, revenue, total impressions, cost per impression, weekly social media engagement by channel etc. Deliver an awe inspiring pitch with this creative omnichannel marketing dashboard with revenue and total spend revenue ppt icon gridlines pdf bundle. Topics like marketing spend by channel, weekly engagement by channel, revenue, cost per impression, total spend can be discussed with this completely editable template. It is available for immediate download depending on the needs and requirements of the user.
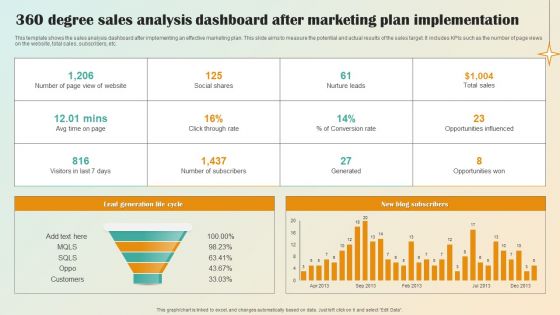
360 Degree Sales Analysis Dashboard After Marketing Plan Implementation Pictures PDF
This template shows the sales analysis dashboard after implementing an effective marketing plan. This slide aims to measure the potential and actual results of the sales target. It includes KPIs such as the number of page views on the website, total sales, subscribers, etc.Pitch your topic with ease and precision using this 360 Degree Sales Analysis Dashboard After Marketing Plan Implementation Pictures PDF. This layout presents information on Lead Generation Life, Conversion Rate. It is also available for immediate download and adjustment. So, changes can be made in the color, design, graphics or any other component to create a unique layout.
Operations Of Commercial Bank Dashboard Tracking Customer Retention Rate Time Summary PDF
This slide contains dashboard that will allow bank to track the retention rate of customer within span of 6 months. Number of accounts that are successfully retained by the bank. It will also bank in tracking accounts that are cancelled. Deliver an awe-inspiring pitch with this creative operations of commercial bank dashboard tracking customer retention rate time summary pdf bundle. Topics like contraction, expansion, partner can be discussed with this completely editable template. It is available for immediate download depending on the needs and requirements of the user.
Operations Of Commercial Bank Dashboard Tracking Customer Retention Rate Icons PDF
This slide contains dashboard that will allow bank to track the retention rate of customer within span of 6 months. Number of accounts that are successfully retained by the bank. It will also bank in tracking accounts that are cancelled. Deliver and pitch your topic in the best possible manner with this operations of commercial bank dashboard tracking customer retention rate icons pdf. Use them to share invaluable insights on road runners, contraction, expansion and impress your audience. This template can be altered and modified as per your expectations. So, grab it now.
Operations Of Commercial Bank Dashboard Tracking Online Banking Activities Topics PDF
This slide contains dashboard that will allow bank to track the online customer activities in terms of new customer connected with bank on online platform, fraud prevention. It will also help the bank in tracking the numbers of employees that are connected to bank through mobile access. Deliver and pitch your topic in the best possible manner with this operations of commercial bank dashboard tracking online banking activities topics pdf. Use them to share invaluable insights on express invoicing, account management, fraud prevention, payroll service and impress your audience. This template can be altered and modified as per your expectations. So, grab it now.

CRM Performance Metrics Dashboard Showing Sales In Real Estate Customer Information PDF
This slide represents the dashboard showing the sales performance of a real estate company. It includes details related top 5 agents US sales, sales vs target per agent, top 5 banks-sold units, sales by top 5 agencies. Pitch your topic with ease and precision using this CRM Performance Metrics Dashboard Showing Sales In Real Estate Customer Information PDF. This layout presents information on Us Sales, Sold Units, Target Per Agent. It is also available for immediate download and adjustment. So, changes can be made in the color, design, graphics or any other component to create a unique layout.

Internal And External Business Environment Analysis Financial Dashboard To Analyze Present Business Scenario Topics PDF
This slide shows finical dashboard to demonstrate current business scenario with KPIs such as quarterly profits, quick, current and debt to equity ratio Deliver and pitch your topic in the best possible manner with this internal and external business environment analysis financial dashboard to analyze present business scenario topics pdf Use them to share invaluable insights on product contribution to quarterly, incremental increase, declining performance and impress your audience. This template can be altered and modified as per your expectations. So, grab it now.
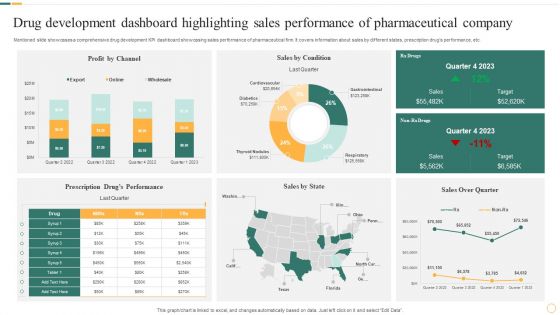
Drug Development Dashboard Highlighting Sales Performance Of Pharmaceutical Company Microsoft PDF
Mentioned slide showcases a comprehensive drug development KPI dashboard showcasing sales performance of pharmaceutical firm. It covers information about sales by different states, prescription drugs performance, etc. Pitch your topic with ease and precision using this Drug Development Dashboard Highlighting Sales Performance Of Pharmaceutical Company Microsoft PDF. This layout presents information on Sales By Condition, Profit By Channel, Sales By State. It is also available for immediate download and adjustment. So, changes can be made in the color, design, graphics or any other component to create a unique layout.
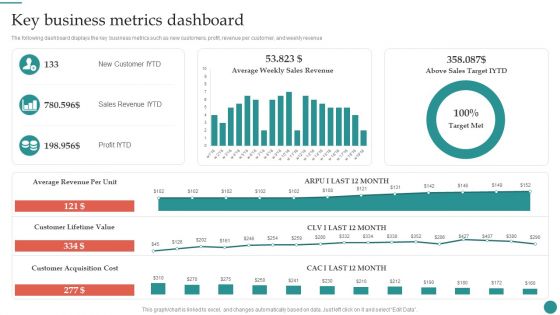
Key Business Metrics Dashboard Company Process Administration And Optimization Playbook Infographics PDF
The following dashboard displays the key business metrics such as new customers, profit, revenue per customer, and weekly revenue. Slidegeeks is here to make your presentations a breeze with Key Business Metrics Dashboard Company Process Administration And Optimization Playbook Infographics PDF With our easy-to-use and customizable templates, you can focus on delivering your ideas rather than worrying about formatting. With a variety of designs to choose from, you are sure to find one that suits your needs. And with animations and unique photos, illustrations, and fonts, you can make your presentation pop. So whether you are giving a sales pitch or presenting to the board, make sure to check out Slidegeeks first.
CRM System Implementation Stages CRM Dashboard For Tracking Sales Pipeline Background PDF
This slide covers the CRM KPI dashboard for monitoring lead status in the sales funnel. It includes metrics such as open pipeline value, open pipeline by product package, pipeline value forecast, etc. Deliver and pitch your topic in the best possible manner with this CRM System Implementation Stages CRM Dashboard For Tracking Sales Pipeline Background PDF. Use them to share invaluable insights on Pipeline Value, Value Forecast, Sales Opportunities and impress your audience. This template can be altered and modified as per your expectations. So, grab it now.

Dashboard For Analyzing Brand Perception Communication Strategy To Enhance Brand Value Topics PDF
This slide covers the dashboard for tracking brand reputation. It also includes metrics such as new customer lifetime value, customer acquisition cost, target met, above sales target, average weekly sales revenue, etc. Boost your pitch with our creative Dashboard For Analyzing Brand Perception Communication Strategy To Enhance Brand Value Topics PDF. Deliver an awe-inspiring pitch that will mesmerize everyone. Using these presentation templates you will surely catch everyones attention. You can browse the ppts collection on our website. We have researchers who are experts at creating the right content for the templates. So you do not have to invest time in any additional work. Just grab the template now and use them.

Logistics Dashboard For XYZ Logistic Company Sales Ppt Inspiration Designs Download PDF
The slide shows the logistic measurement dashboard for measuring inventory turnover ratio, inventory carrying cost, inventory accuracy, percentage of out of stock items etc. Deliver an awe inspiring pitch with this creative logistics dashboard for xyz logistic company sales ppt inspiration designs download pdf bundle. Topics like carrying cost of inventory, inventory accuracy, out of stocks item, inventory to sales, inventory turnover can be discussed with this completely editable template. It is available for immediate download depending on the needs and requirements of the user.
OEM Spare Parts Sales Tracking Dashboard Ppt PowerPoint Presentation Gallery Inspiration PDF
This slide showcases dashboard that can help organization to keep track of aftermarket components sales. Its key elements are sold quantity per spare part and deviation of sold units. Pitch your topic with ease and precision using this oem spare parts sales tracking dashboard ppt powerpoint presentation gallery inspiration pdf. This layout presents information on sold quantity, budgeted quantity, quantity ytd ly. It is also available for immediate download and adjustment. So, changes can be made in the color, design, graphics or any other component to create a unique layout.
Customer Relationship Management Software CRM Dashboard For Tracking Sales Pipeline Background PDF
This slide covers the CRM KPI dashboard for monitoring lead status in the sales funnel. It includes metrics such as open pipeline value, open pipeline by product package, pipeline value forecast, etc. Deliver and pitch your topic in the best possible manner with this Customer Relationship Management Software CRM Dashboard For Tracking Sales Pipeline Background PDF. Use them to share invaluable insights on Product Package, Pipeline Value, Value Forecast and impress your audience. This template can be altered and modified as per your expectations. So, grab it now.
CRM System Deployment Plan CRM Dashboard For Tracking Sales Pipeline Pictures PDF
This slide covers the CRM KPI dashboard for monitoring lead status in the sales funnel. It includes metrics such as open pipeline value, open pipeline by product package, pipeline value forecast, etc. Deliver an awe inspiring pitch with this creative CRM System Deployment Plan CRM Dashboard For Tracking Sales Pipeline Pictures PDF bundle. Topics like Pipeline Value Forecast, Open Pipeline Value, Branding can be discussed with this completely editable template. It is available for immediate download depending on the needs and requirements of the user.
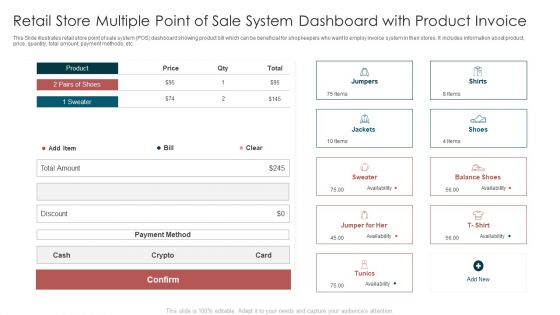
Retail Store Multiple Point Of Sale System Dashboard With Product Invoice Inspiration PDF
This Slide illustrates retail store point of sale system POS dashboard showing product bill which can be beneficial for shopkeepers who want to employ invoice system in their stores. It includes information about product, price, quantity, total amount, payment methods, etc. Pitch your topic with ease and precision using this Retail Store Multiple Point Of Sale System Dashboard With Product Invoice Inspiration PDF. This layout presents information on Payment Method, Product, Availability. It is also available for immediate download and adjustment. So, changes can be made in the color, design, graphics or any other component to create a unique layout.
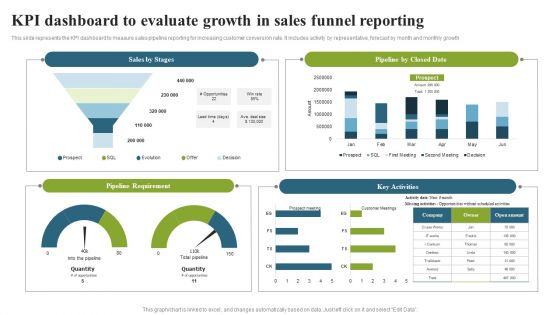
KPI Dashboard To Evaluate Growth In Sales Funnel Reporting Topics PDF
This slide represents the KPI dashboard to measure sales pipeline reporting for increasing customer conversion rate. It includes activity by representative, forecast by month and monthly growth. Pitch your topic with ease and precision using this KPI Dashboard To Evaluate Growth In Sales Funnel Reporting Topics PDF. This layout presents information on Pipeline Requirement, Key Activities, Pipeline Closed Date. It is also available for immediate download and adjustment. So, changes can be made in the color, design, graphics or any other component to create a unique layout.
Banking Dashboard To Determine Total Loans And Deposits Information Icons PDF
Mentioned slide portrays banking dashboard providing information on total loans and deposits by region and by district. Boost your pitch with our creative Banking Dashboard To Determine Total Loans And Deposits Information Icons PDF. Deliver an awe inspiring pitch that will mesmerize everyone. Using these presentation templates you will surely catch everyones attention. You can browse the ppts collection on our website. We have researchers who are experts at creating the right content for the templates. So you do not have to invest time in any additional work. Just grab the template now and use them.
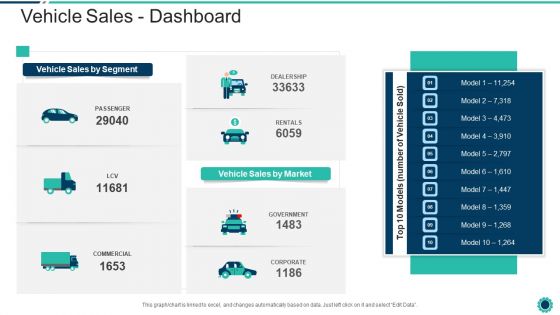
Declining Of A Motor Vehicle Company Vehicle Sales Dashboard Diagrams PDF
Deliver and pitch your topic in the best possible manner with this declining of a motor vehicle company vehicle sales dashboard diagrams pdf. Use them to share invaluable insights on government, corporate, commercial, sales, market and impress your audience. This template can be altered and modified as per your expectations. So, grab it now.
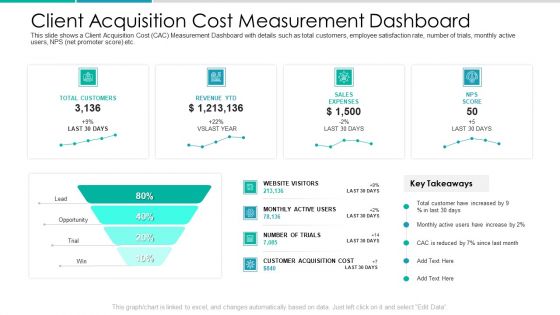
Client Acquisition Cost For Customer Retention Client Acquisition Cost Measurement Dashboard Demonstration PDF
This slide shows a Client Acquisition Cost CAC Measurement Dashboard with details such as total customers, employee satisfaction rate, number of trials, monthly active users, NPS net promoter score etc. Deliver an awe inspiring pitch with this creative client acquisition cost for customer retention client acquisition cost measurement dashboard demonstration pdf bundle. Topics like website visitors, monthly active users, number of trials, customer acquisition cost can be discussed with this completely editable template. It is available for immediate download depending on the needs and requirements of the user.
B2B Marketing Content Administration Playbook Sales Management Activities Tracking Dashboard Brochure PDF
This slide provides information regarding sales meeting plan playing vital role in sales operation effectiveness, motivating sales team and improve overall productivity.Presenting b2b marketing content administration playbook sales management activities tracking dashboard brochure pdf to provide visual cues and insights. Share and navigate important information on three stages that need your due attention. This template can be used to pitch topics like sales management activities tracking dashboard In addtion, this PPT design contains high resolution images, graphics, etc, that are easily editable and available for immediate download.
Robotic Process Automation Metrics Dashboard For Tracking Business Return On Investment Information PDF
This slide illustrates KPI Dashboard for measuring time and money saved after RPA deployment. It also include metrics for analysis such as productivity in robot hours, hours saved per process, money saved per process, etc. Pitch your topic with ease and precision using this Robotic Process Automation Metrics Dashboard For Tracking Business Return On Investment Information PDF. This layout presents information on Management, Goal, Productivity. It is also available for immediate download and adjustment. So, changes can be made in the color, design, graphics or any other component to create a unique layout.

Brand Promotion Communication Strategy Dashboard For Analyzing Brand Perception Introduction PDF
This slide covers the dashboard for tracking brand reputation. It also includes metrics such as new customer lifetime value, customer acquisition cost, target met, above sales target, average weekly sales revenue, etc. Deliver an awe inspiring pitch with this creative Brand Promotion Communication Strategy Dashboard For Analyzing Brand Perception Introduction PDF bundle. Topics like New customer YTD, Sales revenue YTD, Profit YTD can be discussed with this completely editable template. It is available for immediate download depending on the needs and requirements of the user.

Monthly Leads Report And Customer Relationship Management Dashboard With Revenue Information PDF
This slide illustrates graphical representation of CRM leads data. It includes revenue, open leads, won leads, cold leads, monthly leads report and leads dough nut graph etc. Pitch your topic with ease and precision using this Monthly Leads Report And Customer Relationship Management Dashboard With Revenue Information PDF. This layout presents information on Monthly Leads Report, Customer Relationship Management, Dashboard With Revenue. It is also available for immediate download and adjustment. So, changes can be made in the color, design, graphics or any other component to create a unique layout.
Project Portfolio Summary Dashboard Investment Ppt PowerPoint Presentation Icon Graphics Template
Presenting this set of slides with name project portfolio summary dashboard investment ppt powerpoint presentation icon graphics template. The topics discussed in these slides are budget, actual, average cost. This is a completely editable PowerPoint presentation and is available for immediate download. Download now and impress your audience.
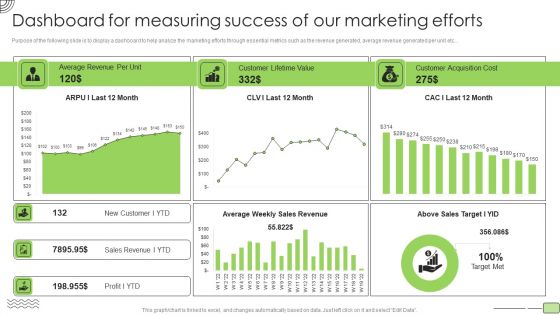
Organic Business Growth Strategies Dashboard For Measuring Success Of Our Marketing Efforts Diagrams PDF
Purpose of the following slide is to display a dashboard to help analyze the marketing efforts through essential metrics such as the revenue generated, average revenue generated per unit etc. Deliver an awe inspiring pitch with this creative Organic Business Growth Strategies Dashboard For Measuring Success Of Our Marketing Efforts Diagrams PDF bundle. Topics like Average Revenue, Customer Lifetime Value, Customer Acquisition Cost can be discussed with this completely editable template. It is available for immediate download depending on the needs and requirements of the user.
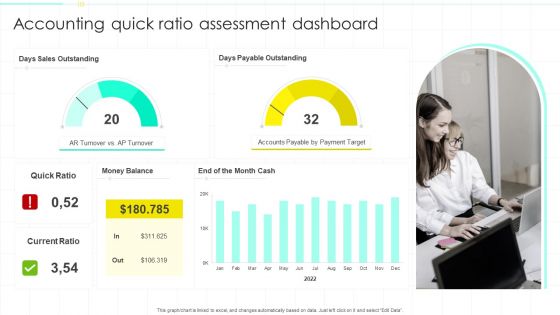
Accounting Quick Ratio Assessment Dashboard Ppt PowerPoint Presentation Show Deck PDF
Pitch your topic with ease and precision using this Accounting Quick Ratio Assessment Dashboard Ppt PowerPoint Presentation Show Deck PDF. This layout presents information on Sales Outstanding, Payable Outstanding, Accounts Payable. It is also available for immediate download and adjustment. So, changes can be made in the color, design, graphics or any other component to create a unique layout.

Marketing Campaign Dashboard To Track Cost And Revenue Kpis Ppt Infographics Good PDF
This slide covers the dashboard for analyzing campaign results. It includes metrics such as revenue, profit, profit per acquisition, cost per acquisition, leads, acquisition, and returns on investment. Formulating a presentation can take up a lot of effort and time, so the content and message should always be the primary focus. The visuals of the PowerPoint can enhance the presenters message, so our Marketing Campaign Dashboard To Track Cost And Revenue Kpis Ppt Infographics Good PDF was created to help save time. Instead of worrying about the design, the presenter can concentrate on the message while our designers work on creating the ideal templates for whatever situation is needed. Slidegeeks has experts for everything from amazing designs to valuable content, we have put everything into Marketing Campaign Dashboard To Track Cost And Revenue Kpis Ppt Infographics Good PDF.

 Home
Home