Variance
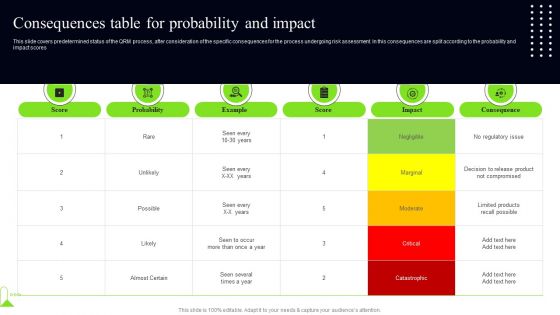
Quality Assessment Consequences Table For Probability And Impact Ideas PDF
This slide covers predetermined status of the QRM process, after consideration of the specific consequences for the process undergoing risk assessment. In this consequences are split according to the probability and impact scores Crafting an eye catching presentation has never been more straightforward. Let your presentation shine with this tasteful yet straightforward Quality Assessment Consequences Table For Probability And Impact Ideas PDF template. It offers a minimalistic and classy look that is great for making a statement. The colors have been employed intelligently to add a bit of playfulness while still remaining professional. Construct the ideal Quality Assessment Consequences Table For Probability And Impact Ideas PDF that effortlessly grabs the attention of your audience. Begin now and be certain to wow your customers.
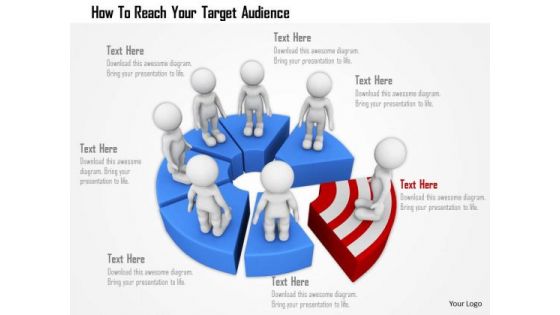
How To Reach Your Target Audience PowerPoint Templates
Concept of target division for teams has been displayed in this 3d diagram. To display this concept we have used graphic of target boards design pie chart and team. Use this business diagram to build quality presentation for your viewers.
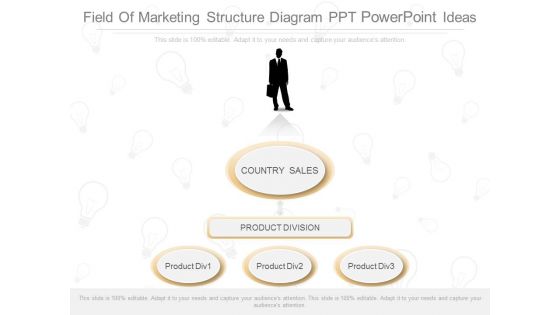
Field Of Marketing Structure Diagram Ppt Powerpoint Ideas
This is a field of marketing structure diagram ppt powerpoint ideas. This is a five stage process. The stages in this process are country sales, product division, product div.
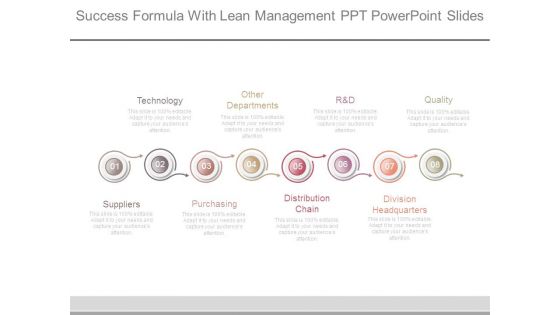
Success Formula With Lean Management Ppt Powerpoint Slides
This is a success formula with lean management ppt powerpoint slides. This is a eight stage process. The stages in this process are technology, other departments, r and d, quality, suppliers, purchasing, distribution chain, division headquarters.
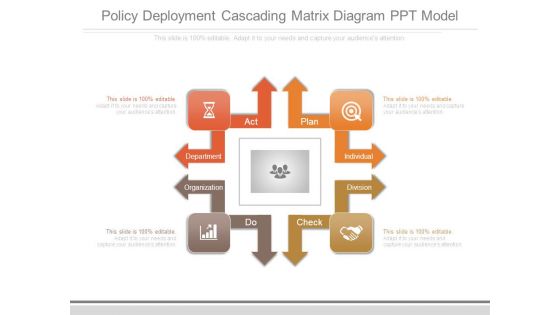
Policy Deployment Cascading Matrix Diagram Ppt Model
This is a policy deployment cascading matrix diagram ppt model. This is a four stage process. The stages in this process are department, organization, do, check, division, individual, plan, act.

Mechanics Finance Progress Diagram Powerpoint Slide Templates Download
This is a mechanics finance progress diagram powerpoint slide templates download. This is a six stage process. The stages in this process are identify customer, contact strategy, contact plan, customer, sales division, year plan.
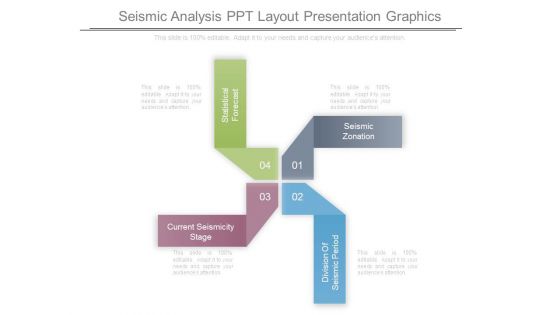
Seismic Analysis Ppt Layout Presentation Graphics
This is a seismic analysis ppt layout presentation graphics. This is a four stage process. The stages in this process are statistical forecast, current seismicity stage, seismic zonation, division of seismic period.
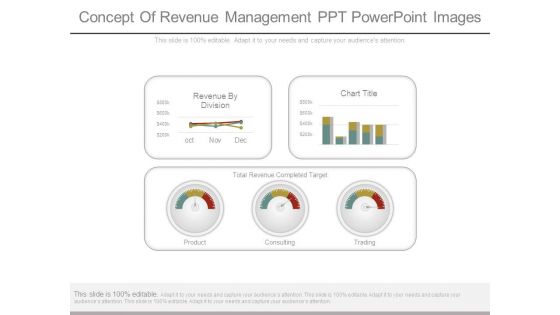
Concept Of Revenue Management Ppt Powerpoint Images
This is a concept of revenue management ppt powerpoint images. This is a five stage process. The stages in this process are revenue by division, chart title, total revenue completed target, product, consulting, trading.
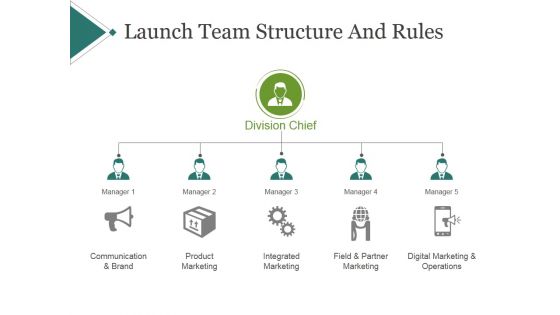
Launch Team Structure And Rules Ppt PowerPoint Presentation Portfolio
This is a launch team structure and rules ppt powerpoint presentation portfolio. This is a two stage process. The stages in this process are division chief, manager, communication and brand, product marketing.

Hr Dashboard Ppt PowerPoint Presentation Shapes
This is a hr dashboard ppt powerpoint presentation shapes. This is a four stage process. The stages in this process are total employees, key metrics, employee churn, open positions by divisions.

Hr Dashboard Template 2 Ppt PowerPoint Presentation Microsoft
This is a hr dashboard template 2 ppt powerpoint presentation microsoft. This is a four stage process. The stages in this process are open positions by divisions, key metrics, total employees, employee churn.

Hr Dashboard Template 1 Ppt PowerPoint Presentation Layouts Slideshow
This is a hr dashboard template 1 ppt powerpoint presentation layouts slideshow. This is a four stage process. The stages in this process are employee churn, key metrics, total employees, open positions by divisions.

Hr Dashboard Template 1 Ppt PowerPoint Presentation Infographic Template Format Ideas
This is a hr dashboard template 1 ppt powerpoint presentation infographic template format ideas. This is a four stage process. The stages in this process are hr management dashboard, key metrics, employee churn, open positions by divisions, total employees.
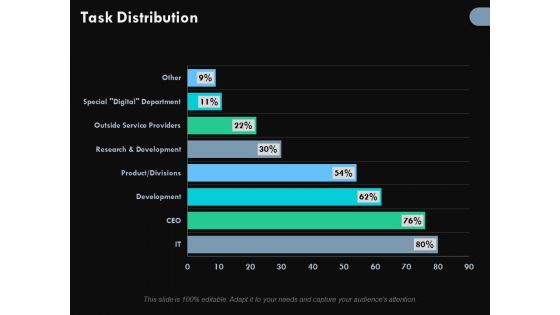
Task Distribution Ppt PowerPoint Presentation Design Ideas
This is a task distribution ppt powerpoint presentation design ideas. This is a eight stage process. The stages in this process are outside service providers, research and development, product, divisions, percentage.

Fission Chain Reaction Neutron And Uranium Ppt PowerPoint Presentation Inspiration Show
This is a fission chain reaction neutron and uranium ppt powerpoint presentation inspiration show. This is a three stage process. The stages in this process are division, fission, parting.

Nuclear Fission And Nuclear Fusion Reactions Ppt PowerPoint Presentation Pictures Gridlines
This is a nuclear fission and nuclear fusion reactions ppt powerpoint presentation pictures gridlines. This is a two stage process. The stages in this process are division, fission, parting.

Nuclear Fission Chain Reaction Neutron And Fission Product Ppt PowerPoint Presentation Layouts Visuals
This is a nuclear fission chain reaction neutron and fission product ppt powerpoint presentation layouts visuals. This is a seven stage process. The stages in this process are division, fission, parting.

Schematic Nuclear Fission Chain Reaction Ppt PowerPoint Presentation Portfolio Slide Portrait
This is a schematic nuclear fission chain reaction ppt powerpoint presentation portfolio slide portrait. This is a five stage process. The stages in this process are division, fission, parting.
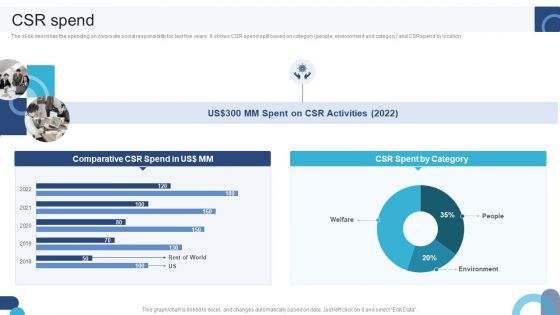
Digital Application Software Development Business Profile CSR Spend Clipart PDF
The slide describes the spending on corporate social responsibility for last five years. It shows CSR spend split based on category people, environment and category and CSRspend by location. Do you have an important presentation coming up Are you looking for something that will make your presentation stand out from the rest Look no further than Digital Application Software Development Business Profile CSR Spend Clipart PDF. With our professional designs, you can trust that your presentation will pop and make delivering it a smooth process. And with Slidegeeks, you can trust that your presentation will be unique and memorable. So why wait Grab Digital Application Software Development Business Profile CSR Spend Clipart PDF today and make your presentation stand out from the rest.
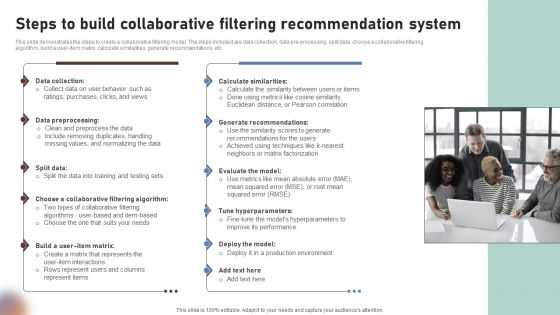
Steps To Build Collaborative Filtering Recommendation System Rules PDF
This slide demonstrates the steps to create a collaborative filtering model. The steps included are data collection, data pre-processing, split data, choose a collaborative filtering algorithm, build a user-item matrix, calculate similarities, generate recommendations, etc.Find highly impressive Steps To Build Collaborative Filtering Recommendation System Rules PDF on Slidegeeks to deliver a meaningful presentation. You can save an ample amount of time using these presentation templates. No need to worry to prepare everything from scratch because Slidegeeks experts have already done a huge research and work for you. You need to download Steps To Build Collaborative Filtering Recommendation System Rules PDF for your upcoming presentation. All the presentation templates are 100 percent editable and you can change the color and personalize the content accordingly. Download now
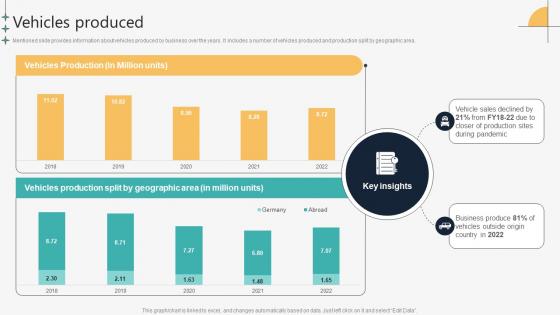
Vehicles Produced Automotive Manufacturing Company Profile CP SS V
Mentioned slide provides information about vehicles produced by business over the years. It includes a number of vehicles produced and production split by geographic area.Do you have an important presentation coming up Are you looking for something that will make your presentation stand out from the rest Look no further than Vehicles Produced Automotive Manufacturing Company Profile CP SS V. With our professional designs, you can trust that your presentation will pop and make delivering it a smooth process. And with Slidegeeks, you can trust that your presentation will be unique and memorable. So why wait Grab Vehicles Produced Automotive Manufacturing Company Profile CP SS V today and make your presentation stand out from the rest

Cost Of Revenue Enterprise Software Solution Providing Company Profile CP SS V
Following slide provides information about company incurrent cost for generating revenue. It includes cost of revenue in percentage , yearly cost of revenue split.Do you have an important presentation coming up Are you looking for something that will make your presentation stand out from the rest Look no further than Cost Of Revenue Enterprise Software Solution Providing Company Profile CP SS V. With our professional designs, you can trust that your presentation will pop and make delivering it a smooth process. And with Slidegeeks, you can trust that your presentation will be unique and memorable. So why wait Grab Cost Of Revenue Enterprise Software Solution Providing Company Profile CP SS V today and make your presentation stand out from the rest

Vehicles Produced Automobile Development Company Profile CP SS V
Mentioned slide provides information about vehicles produced by business over the years. It includes a number of vehicles produced and production split by geographic area.Do you have an important presentation coming up Are you looking for something that will make your presentation stand out from the rest Look no further than Vehicles Produced Automobile Development Company Profile CP SS V. With our professional designs, you can trust that your presentation will pop and make delivering it a smooth process. And with Slidegeeks, you can trust that your presentation will be unique and memorable. So why wait Grab Vehicles Produced Automobile Development Company Profile CP SS V today and make your presentation stand out from the rest
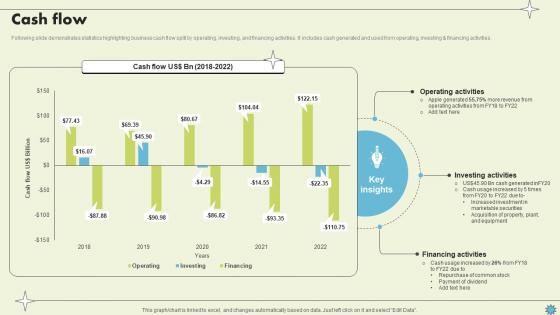
Cash Flow Consumer Electronics Company Profile CP SS V
Following slide demonstrates statistics highlighting business cash flow split by operating, investing, and financing activities. It includes cash generated and used from operating, investing and financing activities. Do you have an important presentation coming up Are you looking for something that will make your presentation stand out from the rest Look no further than Cash Flow Consumer Electronics Company Profile CP SS V. With our professional designs, you can trust that your presentation will pop and make delivering it a smooth process. And with Slidegeeks, you can trust that your presentation will be unique and memorable. So why wait Grab Cash Flow Consumer Electronics Company Profile CP SS V today and make your presentation stand out from the rest
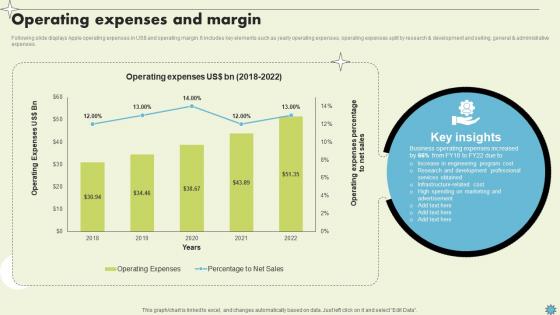
Operating Expenses And Margin Consumer Electronics Company Profile CP SS V
Following slide displays Apple operating expenses in USdollar and operating margin. It includes key elements such as yearly operating expenses, operating expenses split by research and development and selling, general and administrative expenses.Do you have an important presentation coming up Are you looking for something that will make your presentation stand out from the rest Look no further than Operating Expenses And Margin Consumer Electronics Company Profile CP SS V. With our professional designs, you can trust that your presentation will pop and make delivering it a smooth process. And with Slidegeeks, you can trust that your presentation will be unique and memorable. So why wait Grab Operating Expenses And Margin Consumer Electronics Company Profile CP SS V today and make your presentation stand out from the rest

Employee Count FMCG Provider Company Profile CP SS V
This slide represents the employee count of Nestle company for last six years from 2017 to 2022. It further includes employee split by activity and geographic area. Do you have an important presentation coming up Are you looking for something that will make your presentation stand out from the rest Look no further than Employee Count FMCG Provider Company Profile CP SS V. With our professional designs, you can trust that your presentation will pop and make delivering it a smooth process. And with Slidegeeks, you can trust that your presentation will be unique and memorable. So why wait Grab Employee Count FMCG Provider Company Profile CP SS V today and make your presentation stand out from the rest

Pitch Deck For Fundraising From Post Market Financing Financial Highlights Of The Company Microsoft PDF
The slide provides the financials highlight of the company including revenue and net interest income for five years and revenue split by segments and geographic area Deliver and pitch your topic in the best possible manner with this pitch deck for fundraising from post market financing financial highlights of the company microsoft pdf. Use them to share invaluable insights on revenue split by business segments, revenue split by geographic area, net interest income and impress your audience. This template can be altered and modified as per your expectations. So, grab it now.
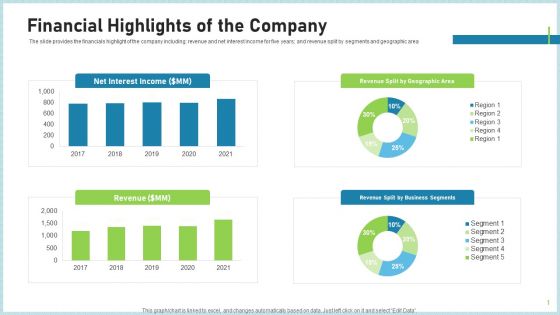
Pitch Deck To Attract Funding After IPO Market Financial Highlights Of The Company Demonstration PDF
The slide provides the financials highlight of the company including revenue and net interest income for five years and revenue split by segments and geographic area Deliver and pitch your topic in the best possible manner with this pitch deck to attract funding after ipo market financial highlights of the company demonstration pdf. Use them to share invaluable insights on revenue split by geographic area, revenue split by business segments, revenue and impress your audience. This template can be altered and modified as per your expectations. So, grab it now.

Investor Deck For Procuring Funds From Money Market Financial Highlights Of The Company Template PDF
The slide provides the financials highlight of the company including revenue and net interest income for five years and revenue split by segments and geographic area. Deliver an awe inspiring pitch with this creative investor deck for procuring funds from money market financial highlights of the company template pdf bundle. Topics like revenue split by business segments, revenue split by geographic area, net interest income, revenue can be discussed with this completely editable template. It is available for immediate download depending on the needs and requirements of the user.
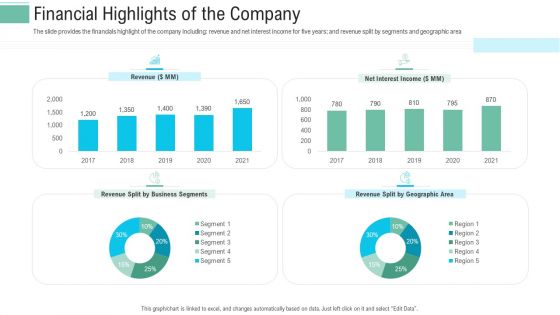
Pitch Presentation Raise Money Spot Market Financial Highlights Of The Company Formats PDF
The slide provides the financials highlight of the company including revenue and net interest income for five years and revenue split by segments and geographic area. Deliver an awe-inspiring pitch with this creative pitch presentation raise money spot market financial highlights of the company formats pdf bundle. Topics like net interest income, revenue split by business segments, revenue split by geographic area can be discussed with this completely editable template. It is available for immediate download depending on the needs and requirements of the user.
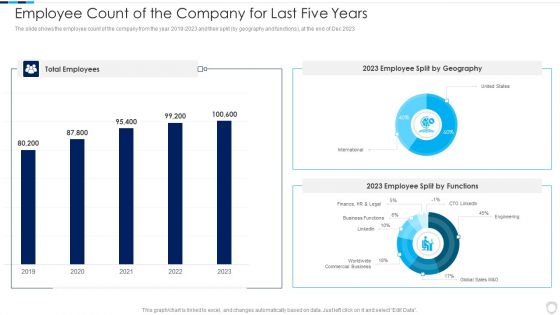
Financial Report Of An IT Firm Employee Count Of The Company For Last Five Years Topics PDF
The slide shows the employee count of the company from the year 2019 to 2023 and their split by geography and functions, at the end of Dec 2023.Deliver an awe inspiring pitch with this creative Financial Report Of An IT Firm Employee Count Of The Company For Last Five Years Topics PDF bundle. Topics like Total Employees, Split Geography, Split Functions can be discussed with this completely editable template. It is available for immediate download depending on the needs and requirements of the user.
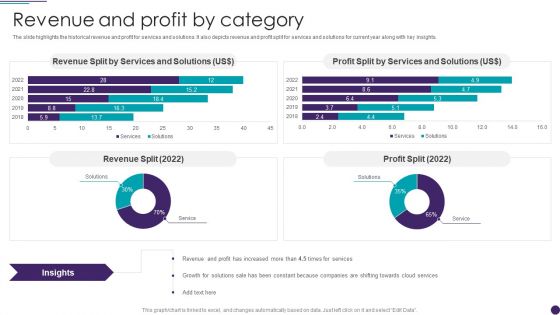
IT Services Business Profile Revenue And Profit By Category Mockup PDF
The slide highlights the historical revenue and profit for services and solutions. It also depicts revenue and profit split for services and solutions for current year along with key insights. Deliver and pitch your topic in the best possible manner with this IT Services Business Profile Revenue And Profit By Category Mockup PDF. Use them to share invaluable insights on Revenue Split, Services And Solutions, Profit Split and impress your audience. This template can be altered and modified as per your expectations. So, grab it now.

Software Services Business Profile Workforce Structure Ppt PowerPoint Presentation Gallery Good PDF
The slide highlights total employee count for five years illustrating diversity in the organization. It showcases employee split based on region, employee split by work experience and gender diversity of employees. Deliver and pitch your topic in the best possible manner with this Software Services Business Profile Workforce Structure Ppt PowerPoint Presentation Gallery Good PDF. Use them to share invaluable insights on Employees Split Region, Historical Employee Strength, Experienced Workforce, 2018 To 2022 and impress your audience. This template can be altered and modified as per your expectations. So, grab it now.
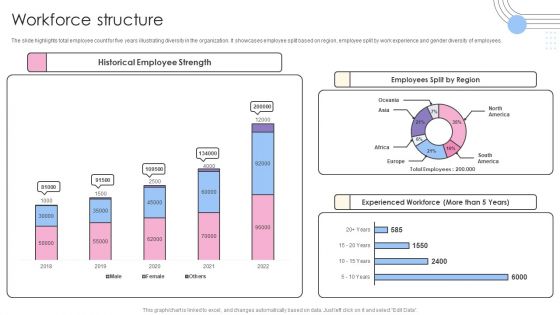
Software Products And Solutions Firm Details Workforce Structure Sample Background PDF
The slide highlights total employee count for five years illustrating diversity in the organization. It showcases employee split based on region, employee split by work experience and gender diversity of employees. Deliver an awe inspiring pitch with this creative Software Products And Solutions Firm Details Workforce Structure Sample Background PDF bundle. Topics like Historical Employee Strength, Employees Split Region, Experienced Workforce can be discussed with this completely editable template. It is available for immediate download depending on the needs and requirements of the user.
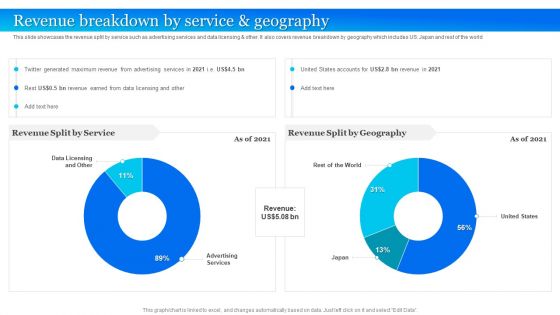
Twitter Company Summary Revenue Breakdown By Service And Geography Mockup PDF
This slide showcases the revenue split by service such as advertising services and data licensing And other. It also covers revenue breakdown by geography which includes US. Japan and rest of the world. Deliver and pitch your topic in the best possible manner with this Twitter Company Summary Revenue Breakdown By Service And Geography Mockup PDF. Use them to share invaluable insights on Revenue Split By Service, Revenue Split By Geography and impress your audience. This template can be altered and modified as per your expectations. So, grab it now.

IT Application Services Company Outline Revenue And Profit By Category Diagrams PDF
The slide highlights the historical revenue and profit for services and solutions. It also depicts revenue and profit split for services and solutions for current year along with key insights. Deliver and pitch your topic in the best possible manner with this IT Application Services Company Outline Revenue And Profit By Category Diagrams PDF. Use them to share invaluable insights on Revenue Split, Profit Split, Services and impress your audience. This template can be altered and modified as per your expectations. So, grab it now.

IT Application Services Company Outline Workforce Structure Introduction PDF
The slide highlights the workforce structure and total employee count for five years. It showcases employee split based on roles, employee split by work experience and gender diversity of employees. Deliver and pitch your topic in the best possible manner with this IT Application Services Company Outline Workforce Structure Introduction PDF. Use them to share invaluable insights on Employee Split By Role, Employee Experience, Historical Employee Strength and impress your audience. This template can be altered and modified as per your expectations. So, grab it now.
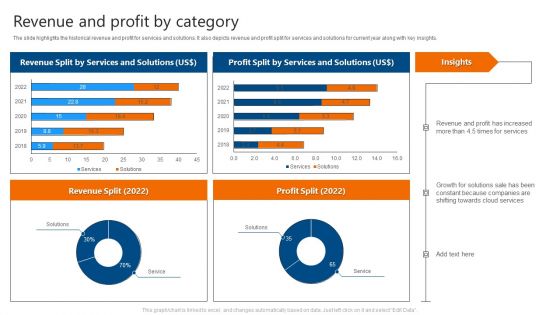
Revenue And Profit By Category IT Software Development Company Profile Graphics PDF
The slide highlights the historical revenue and profit for services and solutions. It also depicts revenue and profit split for services and solutions for current year along with key insights. Deliver an awe inspiring pitch with this creative Revenue And Profit By Category IT Software Development Company Profile Graphics PDF bundle. Topics like Revenue Split By Services, Profit Split By Services can be discussed with this completely editable template. It is available for immediate download depending on the needs and requirements of the user.
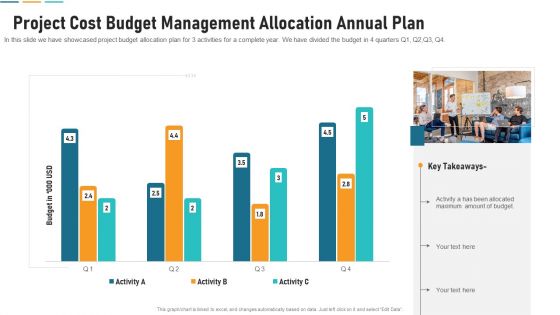
Project Cost Budget Management Allocation Annual Plan Slides PDF
In this slide we have showcased project budget allocation plan for 3 activities for a complete year. We have divided the budget in 4 quarters Q1, Q2,Q3, Q4.Showcasing this set of slides titled project cost budget management allocation annual plan slides pdf. The topics addressed in these templates are project cost budget management allocation annual plan. All the content presented in this PPT design is completely editable. Download it and make adjustments in color, background, font etc. as per your unique business setting.
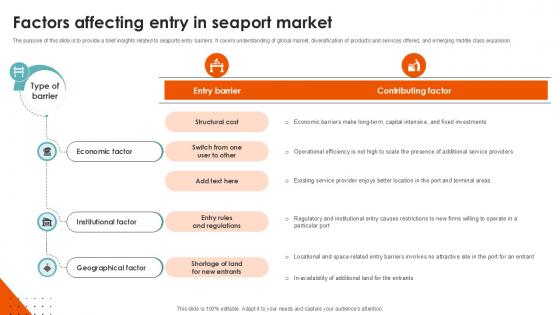
Factors Affecting Entry In Seaport Market Port Terminal Industry Ppt PowerPoint
The purpose of this slide is to provide a brief insights related to seaports entry barriers. It covers understanding of global market, diversification of products and services offered, and emerging middle class expansion.If your project calls for a presentation, then Slidegeeks is your go to partner because we have professionally designed, easy to edit templates that are perfect for any presentation. After downloading, you can easily edit Factors Affecting Entry In Seaport Market Port Terminal Industry Ppt PowerPoint and make the changes accordingly. You can rearrange slides or fill them with different images. Check out all the handy templates

Business Arrows PowerPoint Templates Success Data Mining Process Ppt Slides
Business Arrows PowerPoint Templates Success data mining process PPT Slides-This data mining PowerPoint template can be used for example in presentations where you need to explain data mining algorithms-Business Arrows PowerPoint Templates Success data mining process PPT Slides-This template can be used for presentations relating to Analysis, Anomaly, Artificial, Break, Clean, Computer, Cut, Data, Database, Decision, Detection, Discovery, Divide, Explore, Extract, Hammer, Helmet, Human, Index, Intelligence, Kdd, knowledge, Learning, Light, Mallet, Management, Mining, Model, Movement, Pattern, Predictive, Process, Records, Recycle, Repair, Safety, Science

Pioneer Migrator Settler Pms Map Ppt Slides Layout Ideas PDF
This template covers PMS map for corporate management team pursuing profitable growth and to plot the companys current and planned portfolios. The pioneer-migrator-setter map is divided into three segments pioneers, migrators, and settlers. There are so many reasons you need a Pioneer Migrator Settler Pms Map Ppt Slides Layout Ideas PDF. The first reason is you can not spend time making everything from scratch, Thus, Slidegeeks has made presentation templates for you too. You can easily download these templates from our website easily.

Growing Churn Rate In IT Organization Dashboard Employee Attrition Rate Employee Download PDF
Deliver and pitch your topic in the best possible manner with this growing churn rate in it organization dashboard employee attrition rate employee download pdf. Use them to share invaluable insights on turnover rate year over year, turnover rate by division, actual vs benchmark work time in months per division and impress your audience. This template can be altered and modified as per your expectations. So, grab it now.
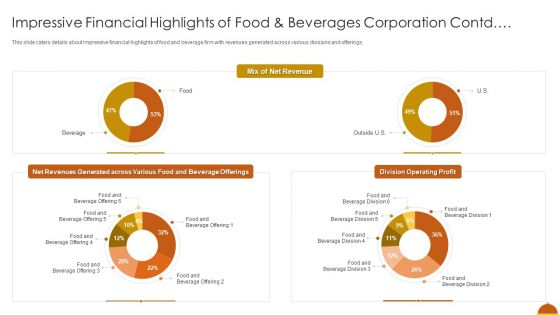
Impressive Financial Highlights Of Food And Beverages Corporation Contd Microsoft PDF
This slide caters details about impressive financial highlights of food and beverage firm with revenues generated across various divisions and offerings. Deliver an awe inspiring pitch with this creative impressive financial highlights of food and beverages corporation contd microsoft pdf bundle. Topics like mix of net revenue, net revenues generated across various food and beverage offerings, division operating profit can be discussed with this completely editable template. It is available for immediate download depending on the needs and requirements of the user.
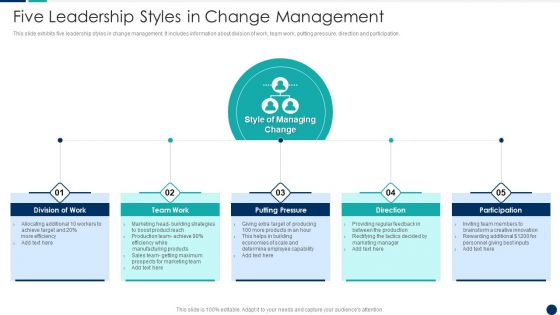
Five Leadership Styles In Change Management Designs PDF
This slide exhibits five leadership styles in change management. It includes information about division of work, team work, putting pressure, direction and participation.Presenting Five Leadership Styles In Change Management Designs PDF to dispense important information. This template comprises five stages. It also presents valuable insights into the topics including Putting Pressure, Participation, Division Work This is a completely customizable PowerPoint theme that can be put to use immediately. So, download it and address the topic impactfully.

Cloud Security Assessment SMB Cloud Security Solutions Diagrams PDF
This slide shows the small and midsized business cloud security solutions, including multi-tenant information division, access control, legitimate data compliance, and cautious scaling of cloud frameworks.Deliver and pitch your topic in the best possible manner with this Cloud Security Assessment SMB Cloud Security Solutions Diagrams PDF. Use them to share invaluable insights on Cloud Frameworks, Information Division, Cautious Scaling and impress your audience. This template can be altered and modified as per your expectations. So, grab it now.

Retail Merchandising Program Dashboard Depicting Sales And Customer Analytics Topics PDF
This slide focuses on dashboard that depicts sales and customer analytics which covers sales revenue, average transaction rate, out of stock items, sales by division, monthly visitors, etc. Deliver an awe inspiring pitch with this creative Retail Merchandising Program Dashboard Depicting Sales And Customer Analytics Topics PDF bundle. Topics like Sales Revenue, Total Customers, Avg Transaction Price, Sales Division can be discussed with this completely editable template. It is available for immediate download depending on the needs and requirements of the user.
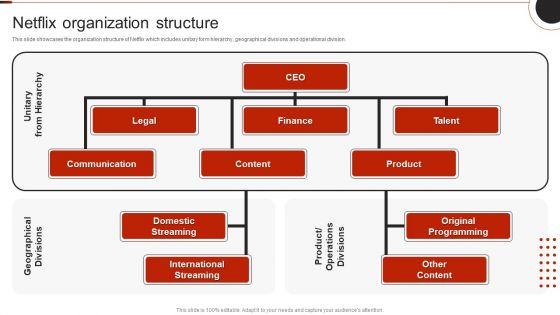
Netflix Company Outline Netflix Organization Structure Rules PDF
This slide showcases the organization structure of Netflix which includes unitary form hierarchy, geographical divisions and operational division.Deliver and pitch your topic in the best possible manner with this Netflix Company Outline Netflix Organization Structure Rules PDF. Use them to share invaluable insights on Communication, Domestic Streaming, International Streaming and impress your audience. This template can be altered and modified as per your expectations. So, grab it now.
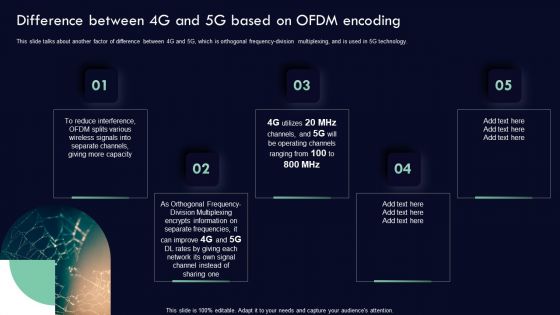
Analyzing 5G Impact Over 4G Difference Between 4G And 5G Based On Ofdm Encoding Graphics PDF
This slide talks about another factor of difference between 4G and 5G, which is orthogonal frequency-division multiplexing, and is used in 5G technology. Deliver and pitch your topic in the best possible manner with this Analyzing 5G Impact Over 4G Difference Between 4G And 5G Based On Ofdm Encoding Graphics PDF. Use them to share invaluable insights on Orthogonal Frequency, Division Multiplexing, Encrypts Information and impress your audience. This template can be altered and modified as per your expectations. So, grab it now.

KPI Dashboard To Measure Commodity Expansionstrategy Performance Mockup PDF
This slide signifies the key performance indicator dashboard to evaluate commodity market growth performance. It covers information about sales revenue, customer, avg transaction price and new sales by division.Showcasing this set of slides titled KPI Dashboard To Measure Commodity Expansionstrategy Performance Mockup PDF. The topics addressed in these templates are Highest Sales, Sales Division, New Collections. All the content presented in this PPT design is completely editable. Download it and make adjustments in color, background, font etc. as per your unique business setting.
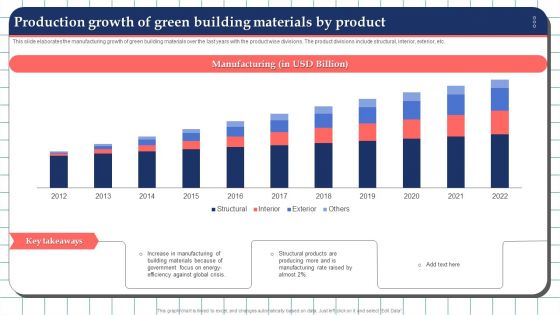
Production Growth Of Green Building Materials By Product Formats PDF
This slide elaborates the manufacturing growth of green building materials over the last years with the product wise divisions. The product divisions include structural, interior, exterior, etc. Pitch your topic with ease and precision using this Production Growth Of Green Building Materials By Product Formats PDF. This layout presents information on Manufacturing, Materials, Global Crisis. It is also available for immediate download and adjustment. So, changes can be made in the color, design, graphics or any other component to create a unique layout.

Human Resource Management Operation Mertrics Dashboard Background PDF
This slide represents HRM operations dashboard. It covers metrics such as employee turnover, headcount in each division, payroll breakdown, salary distribution etc. Pitch your topic with ease and precision using thisHuman Resource Management Operation Mertrics Dashboard Background PDF. This layout presents information on Number Of Employees, Headcount Per Division, Employees By Salary. It is also available for immediate download and adjustment. So, changes can be made in the color, design, graphics or any other component to create a unique layout.
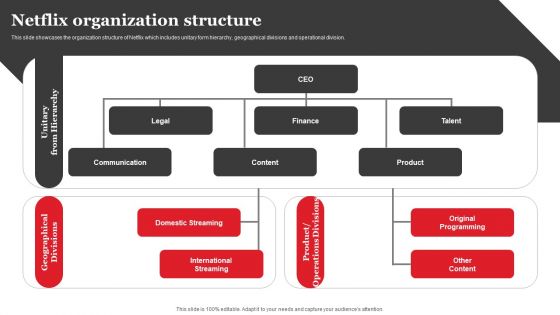
Streaming Platform Company Outline Netflix Organization Structure Microsoft PDF
This slide showcases the organization structure of Netflix which includes unitary form hierarchy, geographical divisions and operational division. Make sure to capture your audiences attention in your business displays with our gratis customizable Streaming Platform Company Outline Netflix Organization Structure Microsoft PDF. These are great for business strategies, office conferences, capital raising or task suggestions. If you desire to acquire more customers for your tech business and ensure they stay satisfied, create your own sales presentation with these plain slides.

Client Registration Planning Steps Activity For Online Subscription Background Pdf
This slide depicts client registration process for online subscription of service. It includes elements such as phase, client, system and registration division. Showcasing this set of slides titled Client Registration Planning Steps Activity For Online Subscription Background Pdf. The topics addressed in these templates are Client, System, Registration Division. All the content presented in this PPT design is completely editable. Download it and make adjustments in color, background, font etc. as per your unique business setting.
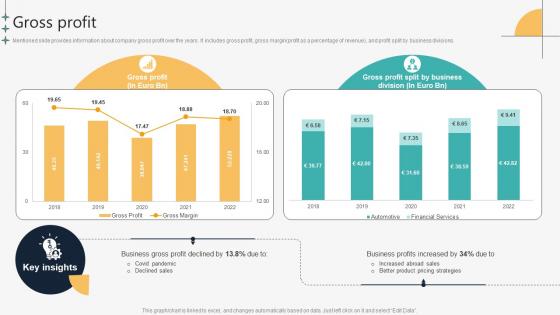
Gross Profit Automotive Manufacturing Company Profile CP SS V
Mentioned slide provides information about company gross profit over the years. It includes gross profit, gross margin profit as a percentage of revenue , and profit split by business divisions.Formulating a presentation can take up a lot of effort and time, so the content and message should always be the primary focus. The visuals of the PowerPoint can enhance the presenters message, so our Gross Profit Automotive Manufacturing Company Profile CP SS V was created to help save time. Instead of worrying about the design, the presenter can concentrate on the message while our designers work on creating the ideal templates for whatever situation is needed. Slidegeeks has experts for everything from amazing designs to valuable content, we have put everything into Gross Profit Automotive Manufacturing Company Profile CP SS V.
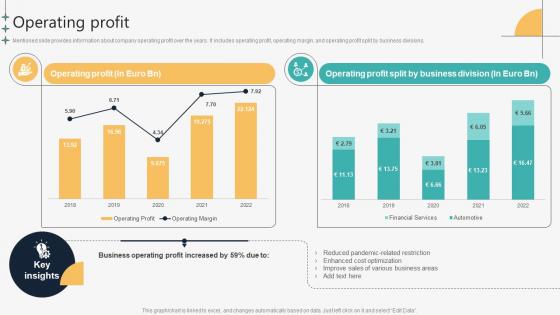
Operating Profit Automotive Manufacturing Company Profile CP SS V
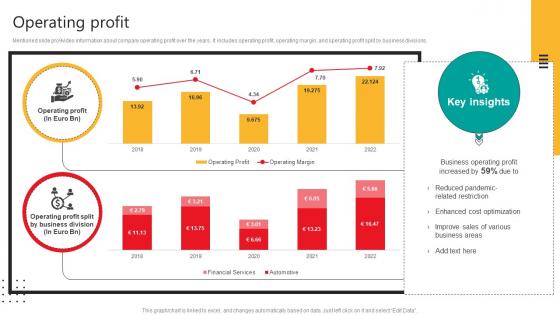
Mentioned slide provides information about company operating profit over the years. It includes operating profit, operating margin, and operating profit split by business divisions.Retrieve professionally designed Operating Profit Automotive Manufacturing Company Profile CP SS V to effectively convey your message and captivate your listeners. Save time by selecting pre-made slideshows that are appropriate for various topics, from business to educational purposes. These themes come in many different styles, from creative to corporate, and all of them are easily adjustable and can be edited quickly. Access them as PowerPoint templates or as Google Slides themes. You do not have to go on a hunt for the perfect presentation because Slidegeeks got you covered from everywhere.
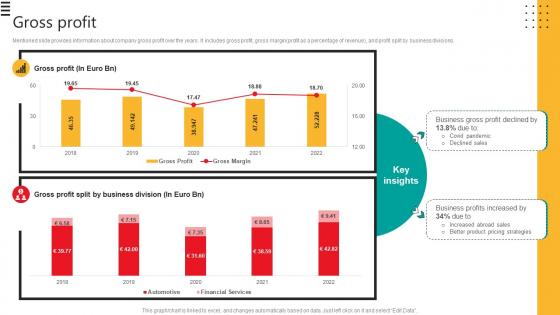
Gross Profit Automobile Development Company Profile CP SS V
Mentioned slide provides information about company gross profit over the years. It includes gross profit, gross marginprofit as a percentage of revenue, and profit split by business divisions.Formulating a presentation can take up a lot of effort and time, so the content and message should always be the primary focus. The visuals of the PowerPoint can enhance the presenters message, so our Gross Profit Automobile Development Company Profile CP SS V was created to help save time. Instead of worrying about the design, the presenter can concentrate on the message while our designers work on creating the ideal templates for whatever situation is needed. Slidegeeks has experts for everything from amazing designs to valuable content, we have put everything into Gross Profit Automobile Development Company Profile CP SS V.
Operating Profit Automobile Development Company Profile CP SS V
Mentioned slide pro9vides information about company operating profit over the years. It includes operating profit, operating margin, and operating profit split by business divisions.Retrieve professionally designed Operating Profit Automobile Development Company Profile CP SS V to effectively convey your message and captivate your listeners. Save time by selecting pre-made slideshows that are appropriate for various topics, from business to educational purposes. These themes come in many different styles, from creative to corporate, and all of them are easily adjustable and can be edited quickly. Access them as PowerPoint templates or as Google Slides themes. You do not have to go on a hunt for the perfect presentation because Slidegeeks got you covered from everywhere.
Lead Application Consultanting Diagram Powerpoint Show
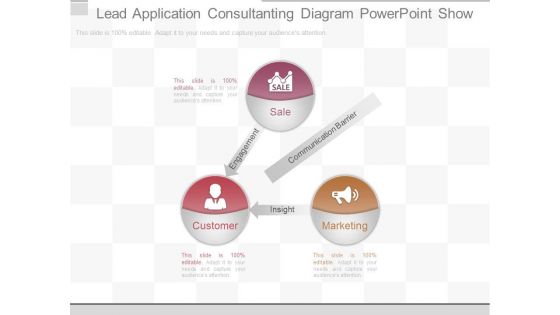
This is a lead application consultanting diagram powerpoint show. This is a three stage process. The stages in this process are sale, customer, marketing, engagement, communication barrier, insight.
Steps To Effective Competitor Benchmarking Presentation Graphics
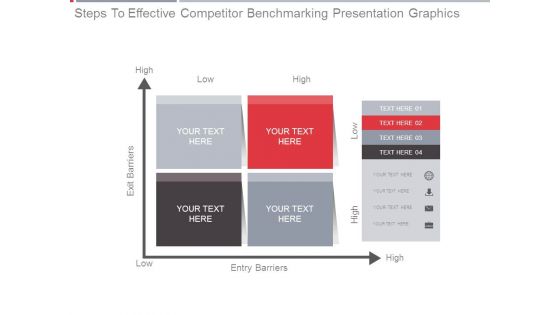
This is a steps to effective competitor benchmarking presentation graphics. This is a four stage process. The stages in this process are exit barriers, high, low.

 Home
Home