Two Phases
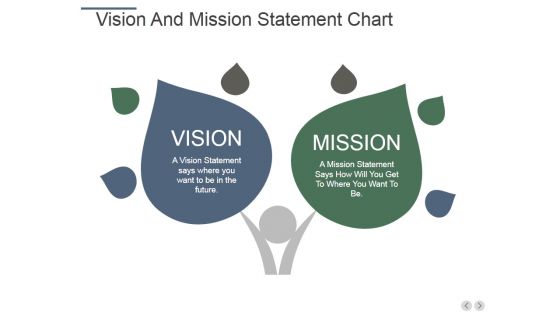
Vision And Mission Statement Chart Ppt PowerPoint Presentation Model Demonstration
This is a vision and mission statement chart ppt powerpoint presentation model demonstration. This is a two stage process. The stages in this process are vision, mission, business, strategy, management.

Line Chart Ppt PowerPoint Presentation File Graphic Images
This is a line chart ppt powerpoint presentation file graphic images. This is a two stage process. The stages in this process are business, strategy, marketing, planning, growth strategy, finance.

Line Chart Ppt Powerpoint Presentation Infographic Template Format
This is a line chart ppt powerpoint presentation infographic template format. This is a two stage process. The stages in this process are jan, feb, mar, apr, may, financial.

Area Chart Ppt PowerPoint Presentation Show Layout Ideas
This is a area chart ppt powerpoint presentation show layout ideas. This is a two stage process. The stages in this process are product, in percentage, financial year, growth.

Line Chart Ppt PowerPoint Presentation Outline Infographic Template
This is a line chart ppt powerpoint presentation outline infographic template. This is a two stage process. The stages in this process are in percentage, product, in year, growth, success.
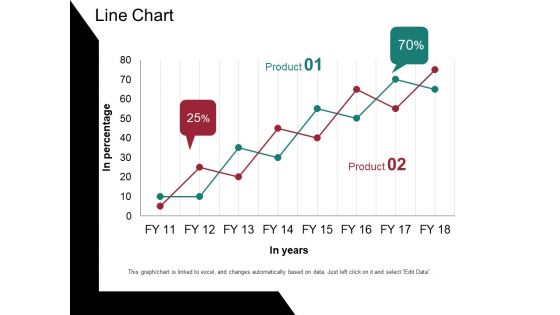
Line Chart Ppt PowerPoint Presentation Portfolio Design Templates
This is a line chart ppt powerpoint presentation portfolio design templates. This is a two stage process. The stages in this process are in percentage, in years, percentage, business, graph.

Bubble Chart Ppt PowerPoint Presentation Layouts Clipart Images
This is a bubble chart ppt powerpoint presentation layouts clipart images. This is a two stage process. The stages in this process are business, marketing, profit, innovation, technology, idea bulb.
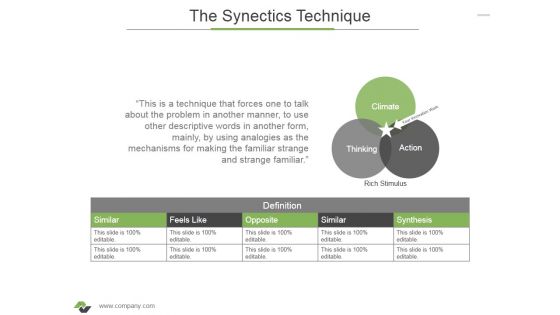
The Synectics Technique Ppt PowerPoint Presentation Visual Aids Outline
This is a the synectics technique ppt powerpoint presentation visual aids outline. This is a two stage process. The stages in this process are climate, thinking, action, rich stimulus, definition.
Clustered Column Template 2 Ppt PowerPoint Presentation Icon
This is a clustered column template 2 ppt powerpoint presentation icon. This is a two stage process. The stages in this process are bar graph, marketing, strategy, analysis, business, success.

Area Chart Finance Ppt PowerPoint Presentation Infographic Template Model
This is a area chart finance ppt powerpoint presentation infographic template model. This is a two stage process. The stages in this process are finance, marketing, management, investment, analysis.
Crm Marketing Dashboard Ppt PowerPoint Presentation Icon Graphic Tips
This is a crm marketing dashboard ppt powerpoint presentation icon graphic tips. This is a two stage process. The stages in this process are leads per week, leads this week.

Benefits Cost Analysis Chart Ppt Powerpoint Presentation Summary Visuals
This is a balance scale with cost and benefits ppt powerpoint presentation show. This is a two stage process. The stages in this process are business, finance, marketing, strategy, compare, management.

Portfolio Selection Allocation Template 2 Ppt PowerPoint Presentation Gallery Themes
This is a portfolio selection allocation template 2 ppt powerpoint presentation gallery themes. This is a two stage process. The stages in this process are cash, bonds, stocks, alternatives, value.
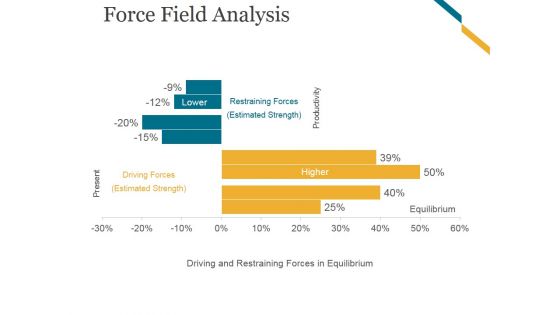
Force Field Analysis Template 2 Ppt PowerPoint Presentation Themes
This is a force field analysis template 2 ppt powerpoint presentation themes. This is a two stage process. The stages in this process are restraining forces, driving forces, estimated strength, equilibrium.

Technology Planning Diagram Ppt Slides
This is a technology planning diagram ppt slides. This is a two stage process. The stages in this process are business mission objectives and gaps, technology plan, technology evaluation, drives, informs.

Business Trading Diagram Ppt Design
This is a business trading diagram ppt design. This is a two stage process. The stages in this process are store, cutting, design, quality, manufacture, the major diff, costs of goods, ending merchandise.
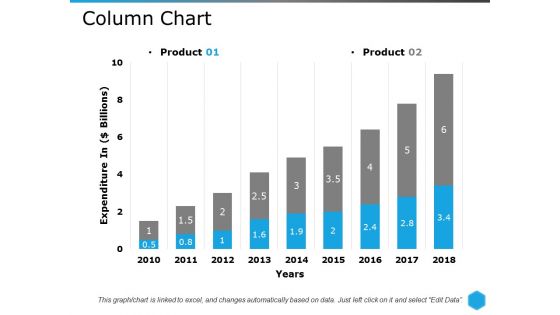
Column Chart Template 2 Ppt PowerPoint Presentation Infographic Template Example Introduction
This is a column chart template 2 ppt powerpoint presentation infographic template example introduction. This is a two stage process. The stages in this process are column chart, finance, analysis, marketing, strategy.
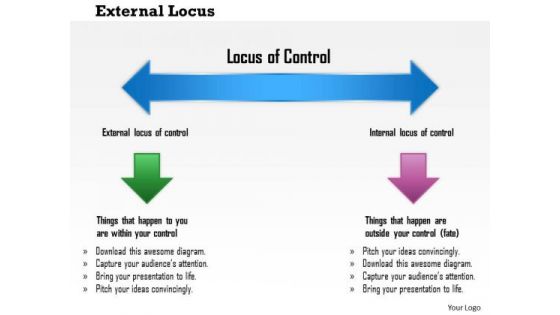
Business Framework External Locus PowerPoint Presentation
This business framework PPT diagram has been crafted with graphic of two directional linear arrow diagram. This PPT diagram contains the linear flow. This PPT diagram may be used for business strategy and finance transformation.
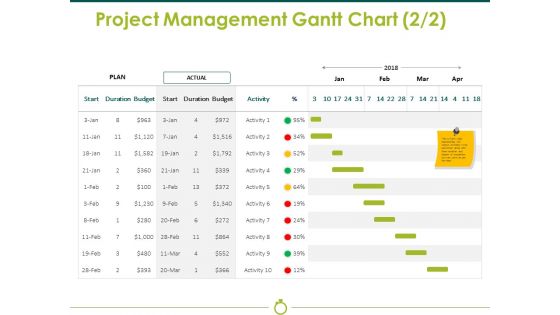
Project Management Gantt Chart Template 2 Ppt PowerPoint Presentation Show Styles
This is a project management gantt chart template 2 ppt powerpoint presentation show styles. This is a two stage process. The stages in this process are plan, actual, budget, duration, start.
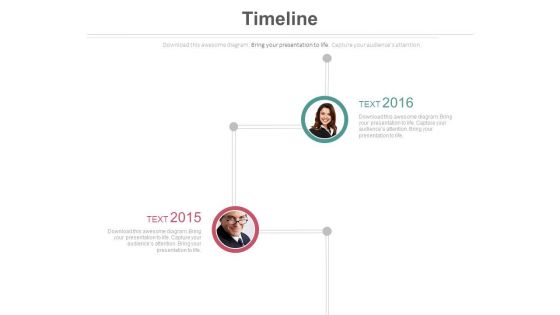
Productive Employees Timeline Diagram Powerpoint Slides
This PowerPoint template has been designed with two employee?s pictures with years. This PPT slide may be helpful to display productive employees. Download this PowerPoint timeline template to make impressive presentations.
Situational Analysis Basic Target Concept Ppt PowerPoint Presentation Icon Master Slide
This is a situational analysis basic target concept ppt powerpoint presentation icon master slide. This is a two stage process. The stages in this process are software support analysis, vulnerability analysis, identify optimization potential, business strategy, formation of project team.
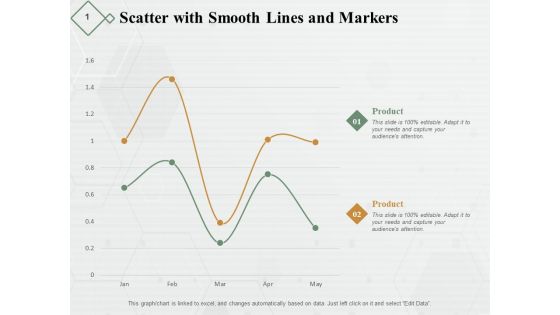
Scatter With Smooth Lines And Markers Ppt PowerPoint Presentation Diagram Lists
This is a scatter with smooth lines and markers ppt powerpoint presentation diagram lists. This is a two stage process. The stages in this process are finance, marketing, analysis, business, investment.
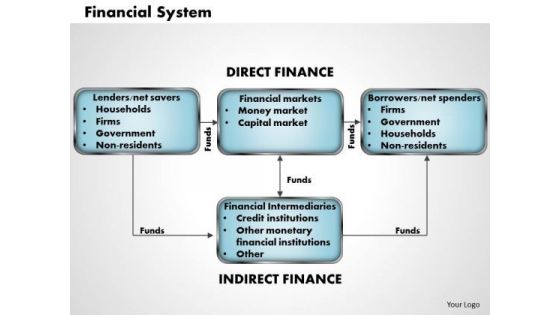
Business Framework Financial System PowerPoint Presentation
Define the financial system in your presentation with this unique diagram. This PPT diagram contain the graphic of two staged linear flow chart. This PPT diagram may be used for finance and business presentations.
Activity Ratios Template 1 Ppt PowerPoint Presentation Icon File Formats
This is a activity ratios template 1 ppt powerpoint presentation icon file formats. This is a two stage process. The stages in this process are finance, analysis, compere, business, marketing.
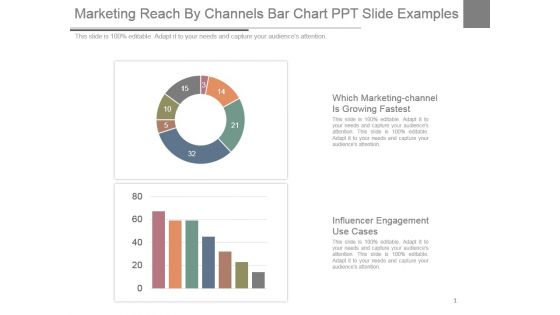
Marketing Reach By Channels Bar Chart Ppt Slide Examples
This is a marketing reach by channels bar chart ppt slide examples. This is a two stage process. The stages in this process are which marketing-channel is growing fastest, influencer engagement use cases.

PowerPoint Theme Gears Process Business Ppt Slides
PowerPoint Theme Gears Process Business PPT Slides-This PowerPoint Template shows you two Gears connected to each other targeting Business aim. This PowerPoint Template imitates the concept of Finance, Business, Team Work etc.-PowerPoint Theme Gears Process Business PPT Slides
Analysis Techniques Pareto Analysis Ppt PowerPoint Presentation Professional Icons
This is a analysis techniques pareto analysis ppt powerpoint presentation professional icons. This is a two stage process. The stages in this process are bar chart, finance, marketing, business, analysis.
Data Collection Histograms Ppt PowerPoint Presentation Icon Slides
This is a data collection histograms ppt powerpoint presentation icon slides. This is a two stage process. The stages in this process are bar chart, finance, marketing, business, analysis.
Monthly Social Media Dashboard Ppt PowerPoint Presentation Icon Gallery
This is a monthly social media dashboard ppt powerpoint presentation icon gallery. This is a two stage process. The stages in this process are facebook, social traffic and conversion, referral traffic, conversions, key social metrics, pinterest, you tube.
Clustered Column Ppt PowerPoint Presentation Icon Design Inspiration
This is a clustered column ppt powerpoint presentation icon design inspiration. This is a two stage process. The stages in this process are product, financial year, sales in percentage, clustered column.
Solvency Ratios Template Ppt PowerPoint Presentation Inspiration Icons
This is a solvency ratios template ppt powerpoint presentation inspiration icons. This is a two stage process. The stages in this process are debt equity ratio, total liabilities total equity, time interest earned ratio, ebit interest expense.
Quarter Track Record Ppt PowerPoint Presentation Icon Files
This is a quarter track record ppt powerpoint presentation icon files. This is a two stage process. The stages in this process are quarter, track record, business, marketing, presentation.
Sales Activities Dashboard Ppt PowerPoint Presentation Icon Graphics
This is a sales activities dashboard ppt powerpoint presentation icon graphics. This is a two stage process. The stages in this process are business, finance, management, analysis, budget, actual.
Addressable Market In Sector Ppt PowerPoint Presentation Icon Infographic Template
This is a addressable market in sector ppt powerpoint presentation icon infographic template. This is a two stage process. The stages in this process are business, marketing, strategy, planning, finance.
Economic Order Quantity Eoq Model Ppt PowerPoint Presentation Icon Deck
This is a economic order quantity eoq model ppt powerpoint presentation icon deck. This is a two stage process. The stages in this process are order quantity, reorder point.
Stacked Bar Template 1 Ppt PowerPoint Presentation Icon Portfolio
This is a stacked bar template 1 ppt powerpoint presentation icon portfolio. This is a two stage process. The stages in this process are business, marketing, finance, graph, strategy.
Clustered Bar Process Analysis Ppt PowerPoint Presentation Icon Influencers
This is a clustered bar process analysis ppt powerpoint presentation icon influencers. This is a two stage process. The stages in this process are clustered bar, profit, product, finance, business.
Open High Low Close Finance Ppt PowerPoint Presentation Icon Deck
This is a open high low close finance ppt powerpoint presentation icon deck. This is a two stage process. The stages in this process are finance, analysis, business, investment, marketing.
Budgeting Planned Actual Comparison Ppt PowerPoint Presentation Icon Shapes
This is a budgeting planned actual comparison ppt powerpoint presentation icon shapes. This is a two stage process. The stages in this process are finance, marketing, management, investment, product, percentage.
Stacked Column Marketing Planning Ppt PowerPoint Presentation Model Icon
This is a stacked column marketing planning ppt powerpoint presentation model icon. This is a two stage process. The stages in this process are finance, analysis, business, investment, marketing.

break even chart showing contribution margin ppt powerpoint presentation professional templates
This is a break even chart showing contribution margin ppt powerpoint presentation professional templates. This is a two stage process. The stages in this process are break even point,break even analysis,break even level.
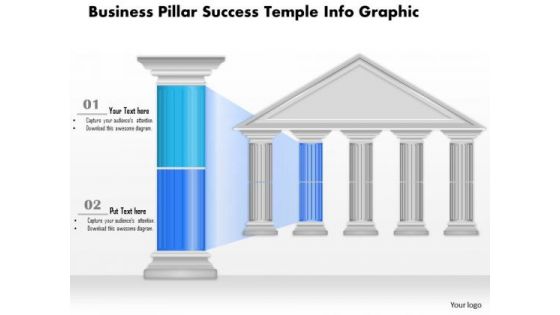
Business Diagram Business Pillar Success Temple Info Graphic Presentation Template
This Power Point template has been designed with business pillars info graphic. This graphic contains the two option pillars to show the success related concepts. Use this pillar diagram in your business presentations.
Market Drivers Global Market Growth Ppt PowerPoint Presentation Slides Icons
This is a market drivers global market growth ppt powerpoint presentation slides icons. This is a two stage process. The stages in this process are global market growth, business, marketing, market drivers, growth.
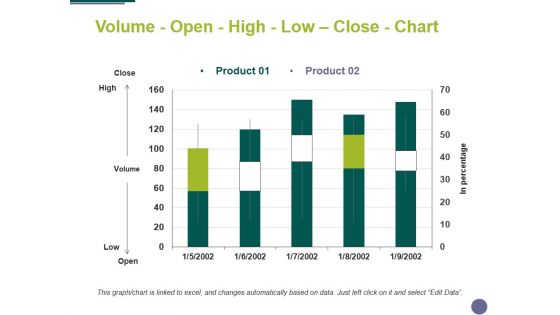
Volume Open High Low Close Chart Ppt PowerPoint Presentation Pictures Slideshow
This is a volume open high low close chart ppt powerpoint presentation pictures slideshow. This is a two stage process. The stages in this process are volume, open, high, low, close, chart.

Volume Open High Low Close Chart Ppt PowerPoint Presentation Infographic Template Guidelines
This is a volume open high low close chart ppt powerpoint presentation infographic template guidelines. This is a two stage process. The stages in this process are volume, open, high, low, close, chart.
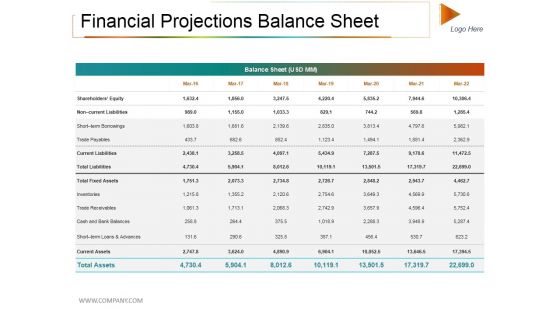
Financial Projections Balance Sheet Ppt PowerPoint Presentation Infographic Template Themes
This is a financial projections balance sheet ppt powerpoint presentation infographic template themes. This is a two stage process. The stages in this process are balance sheet, trade payable, total fixed assets, current assets.

Risk Analysis Complex Ppt PowerPoint Presentation Show Themes
This is a risk analysis complex ppt powerpoint presentation show themes. This is a two stage process. The stages in this process are description of risk, control measures, risk analysis, additional control.

Volume Open High Low Close Chart Ppt PowerPoint Presentation Layouts Background Image
This is a volume open high low close chart ppt powerpoint presentation layouts background image. This is a two stage process. The stages in this process are close, high, volume, low, open.
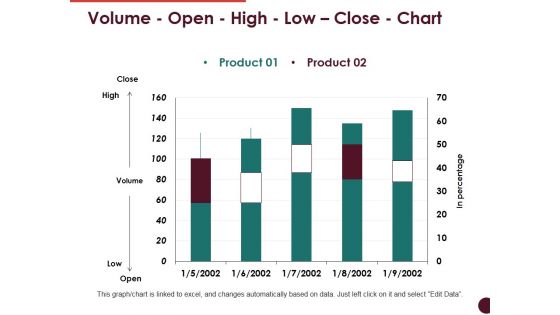
Volume Open High Low Close Chart Ppt PowerPoint Presentation File Graphics Template
This is a volume open high low close chart ppt powerpoint presentation file graphics template. This is a two stage process. The stages in this process are close, high, volume, low, open, product.
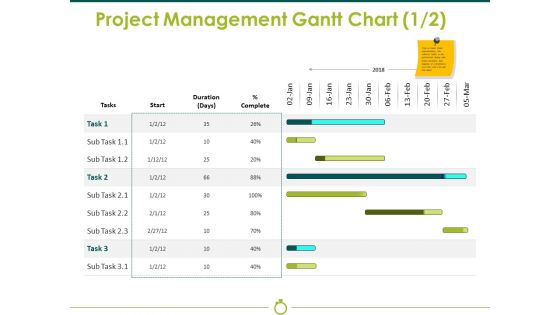
Project Management Gantt Chart Template 1 Ppt PowerPoint Presentation Gallery Graphics Template
This is a project management gantt chart template 1 ppt powerpoint presentation gallery graphics template. This is a two stage process. The stages in this process are start, duration, complete, business, finance.
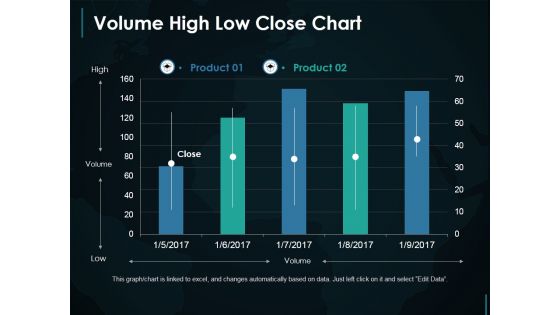
Volume High Low Close Chart Ppt PowerPoint Presentation Slides Example File
This is a volume high low close chart ppt powerpoint presentation slides example file. This is a two stage process. The stages in this process are high, volume, low.

Volume High Low Close Chart Ppt PowerPoint Presentation Visual Aids Slides
This is a volume high low close chart ppt powerpoint presentation visual aids slides. This is a two stage process. The stages in this process are bar graph, marketing, strategy, finance, planning.
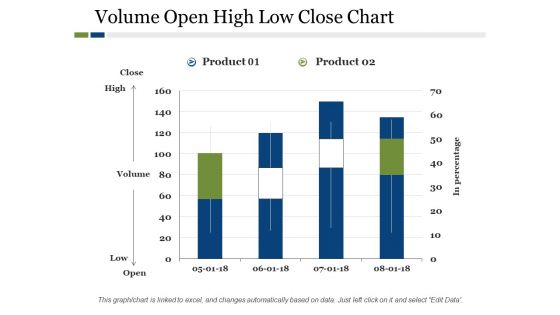
Volume Open High Low Close Chart Ppt PowerPoint Presentation Outline Mockup
This is a volume open high low close chart ppt powerpoint presentation outline mockup. This is a two stage process. The stages in this process are product, high, low, in percentage, volume.

Volume Open High Low Close Chart Finance Ppt PowerPoint Presentation Gallery Graphic Tips
This is a volume open high low close chart finance ppt powerpoint presentation gallery graphic tips. This is a two stage process. The stages in this process are finance, analysis, business, investment, marketing.

Quantitative Bar Chart For Data Analysis Ppt PowerPoint Presentation Model Graphic Tips
This is a quantitative bar chart for data analysis ppt powerpoint presentation model graphic tips. This is a two stage process. The stages in this process are financial analysis, quantitative, statistical modelling.
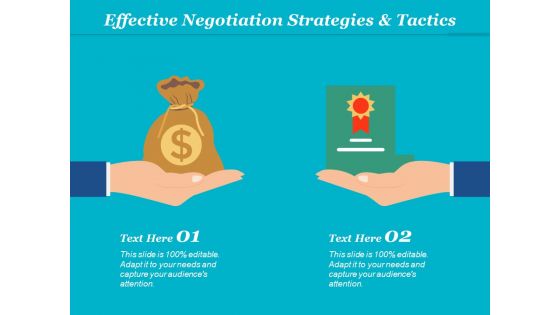
Effective Negotiation Strategies And Tactics Ppt Powerpoint Presentation Themes
This is a effective negotiation strategies and tactics ppt powerpoint presentation themes. This is a two stage process. The stages in this process are contract management, contract negotiation, deal making.

Volume Open High Low Close Chart Ppt PowerPoint Presentation Professional Maker
This is a volume open high low close chart ppt powerpoint presentation professional maker. This is a two stage process. The stages in this process are percentage, product, marketing.

Volume Open High Low Close Chart Product Ppt PowerPoint Presentation Gallery Example
This is a volume open high low close chart product ppt powerpoint presentation gallery example. This is a two stage process. The stages in this process are business, management, strategy, marketing, sales.

Column Chart Employee Value Proposition Ppt PowerPoint Presentation Slides Graphics Design
This is a column chart employee value proposition ppt powerpoint presentation slides graphics design. This is a two stage process. The stages in this process are business, management, strategy, analysis, marketing.

Boys And Girls Participants Details Chart Ppt Powerpoint Presentation Portfolio Layout Ideas
This is a boys and girls participants details chart ppt powerpoint presentation portfolio layout ideas. This is a two stage process. The stages in this process are list of participants, list of members, list of contributors.

 Home
Home