Two Phased Approach

Column Chart Sample Budget Ppt Ppt PowerPoint Presentation Infographics Brochure
This is a column chart sample budget ppt ppt powerpoint presentation infographics brochure. This is a two stage process. The stages in this process are business, management, strategy, analysis, marketing.

Bubble Chart Marketing Business Ppt PowerPoint Presentation Model Sample
This is a bubble chart marketing business ppt powerpoint presentation model sample. This is a two stage process. The stages in this process are finance, business, management, strategy, analysis.

Rader Chart Ppt PowerPoint Presentation Pictures Slide Portrait
This is a rader chart ppt powerpoint presentation pictures slide portrait. This is a two stage process. The stages in this process are rader chart, management, analysis, strategy, business.

Line Chart Ppt PowerPoint Presentation Infographic Template Demonstration
This is a line chart ppt powerpoint presentation infographic template demonstration. This is a two stage process. The stages in this process are line chart, growth, finance, marketing, strategy.
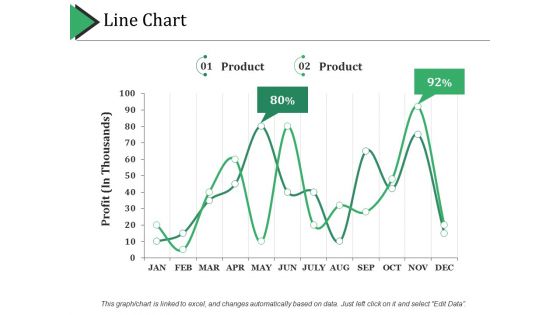
Line Chart Ppt PowerPoint Presentation Portfolio Graphics Pictures
This is a line chart ppt powerpoint presentation portfolio graphics pictures. This is a two stage process. The stages in this process are line chart, finance, growth, strategy, business.

Area Chart Ppt PowerPoint Presentation Visual Aids Example 2015
This is a area chart ppt powerpoint presentation visual aids example 2015. This is a two stage process. The stages in this process are area chart, finance, marketing, strategy, business.

Area Chart Ppt PowerPoint Presentation Infographic Template Guidelines
This is a area chart ppt powerpoint presentation infographic template guidelines. This is a two stage process. The stages in this process are in percentage, chart, business, growth, strategy.
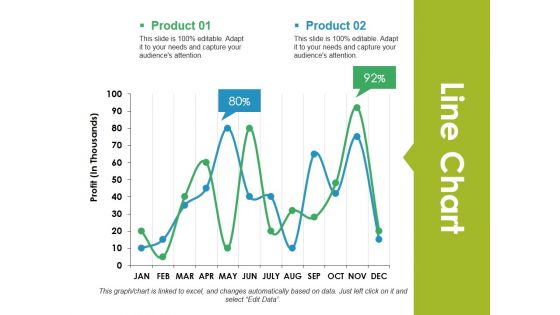
Line Chart Ppt PowerPoint Presentation Ideas Background Designs
This is a line chart ppt powerpoint presentation ideas background designs. This is a two stage process. The stages in this process are line chart, growth, business, marketing, strategy.

Line Chart Ppt PowerPoint Presentation Ideas Graphics Tutorials
This is a line chart ppt powerpoint presentation ideas graphics tutorials. This is a two stage process. The stages in this process are line chart, marketing, strategy, planning, finance.

Data Collection And Analysis Control Chart Ppt PowerPoint Presentation Model Backgrounds
This is a data collection and analysis control chart ppt powerpoint presentation model backgrounds. This is a two stage process. The stages in this process are business, marketing, strategy, finance, analysis.

Area Chart Ppt PowerPoint Presentation Visual Aids Show
This is a area chart ppt powerpoint presentation visual aids show. This is a two stage process. The stages in this process are area chart, growth, strategy, finance, business.
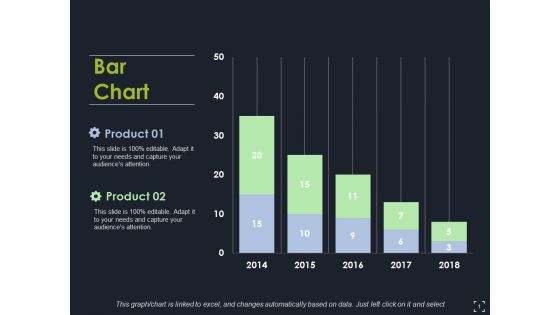
Bar Chart Ppt PowerPoint Presentation Model Clipart Images
This is a bar chart ppt powerpoint presentation model clipart images. This is a two stage process. The stages in this process are bar chart, finance, marketing, strategy, analysis.
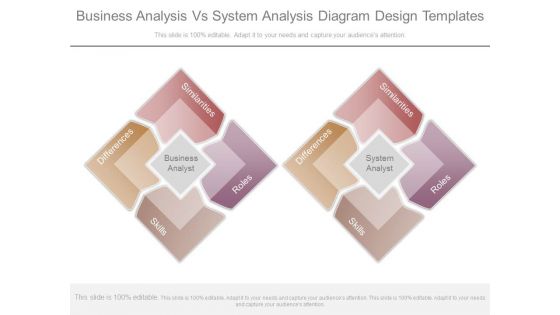
Business Analysis Vs System Analysis Diagram Design Templates
This is a business analysis vs system analysis diagram design templates. This is a two stage process. The stages in this process are differences, skills, business analyst, similarities, roles.
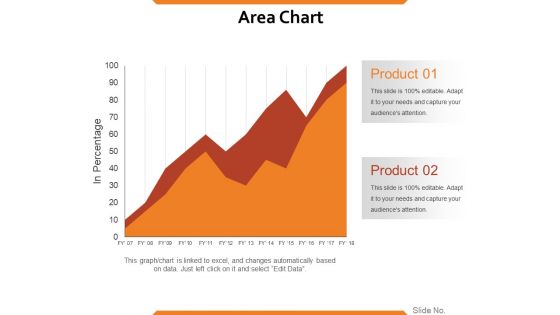
Area Chart Ppt PowerPoint Presentation Inspiration Slide Download
This is a area chart ppt powerpoint presentation inspiration slide download. This is a two stage process. The stages in this process are product, in percentage, business, growth, strategy, finance.

Stacked Line Chart Ppt PowerPoint Presentation File Display
This is a stacked line chart ppt powerpoint presentation file display. This is a two stage process. The stages in this process are business, marketing, graph, strategy, in millions.
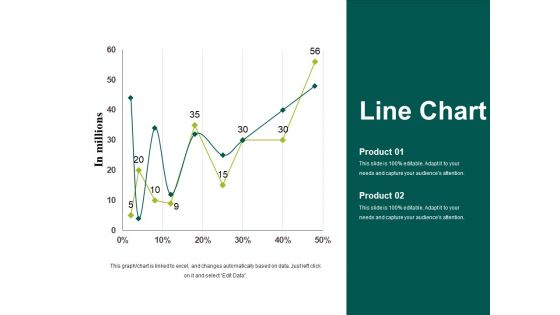
Line Chart Template 1 Ppt PowerPoint Presentation Styles Graphics Tutorials
This is a line chart template 1 ppt powerpoint presentation styles graphics tutorials. This is a two stage process. The stages in this process are in millions, business, marketing, strategy, graph.

Line Chart Ppt PowerPoint Presentation Gallery Example Topics
This is a line chart ppt powerpoint presentation gallery example topics. This is a two stage process. The stages in this process are in millions, business, marketing, strategy, graph.
Clustered Column Template 2 Ppt PowerPoint Presentation Icon
This is a clustered column template 2 ppt powerpoint presentation icon. This is a two stage process. The stages in this process are bar graph, marketing, strategy, analysis, business, success.

x bar and r chart ppt powerpoint presentation portfolio elements
This is a x bar and r chart ppt powerpoint presentation portfolio elements. This is a two stage process. The stages in this process are finance, business, marketing, growth.
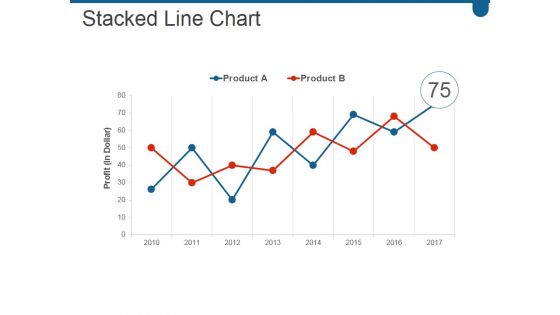
Stacked Line Chart Ppt PowerPoint Presentation Infographic Template Show
This is a stacked line chart ppt powerpoint presentation infographic template show. This is a two stage process. The stages in this process are business, marketing, growth, success, line.
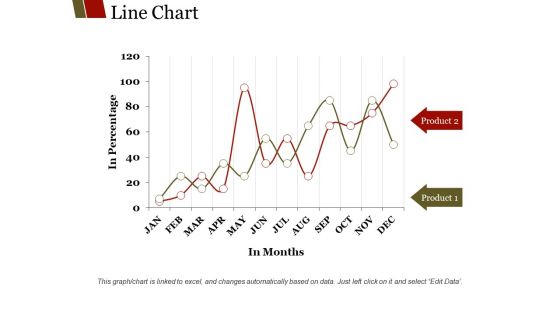
Line Chart Ppt PowerPoint Presentation Show Background Designs
This is a line chart ppt powerpoint presentation show background designs. This is a two stage process. The stages in this process are product, in months, in percentage, business.

Line Chart Ppt PowerPoint Presentation Summary File Formats
This is a line chart ppt powerpoint presentation summary file formats. This is a two stage process. The stages in this process are in percentage, graph, business, marketing, growth.
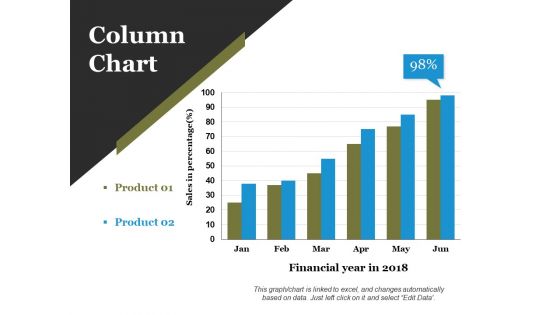
Column Chart Ppt PowerPoint Presentation Infographics Layout Ideas
This is a column chart ppt powerpoint presentation infographics layout ideas. This is a two stage process. The stages in this process are financial year in, business, marketing, growth, graph.

Combo Chart Ppt PowerPoint Presentation File Visual Aids
This is a combo chart ppt powerpoint presentation file visual aids. This is a two stage process. The stages in this process are bar graph, business, marketing, finance, planning.
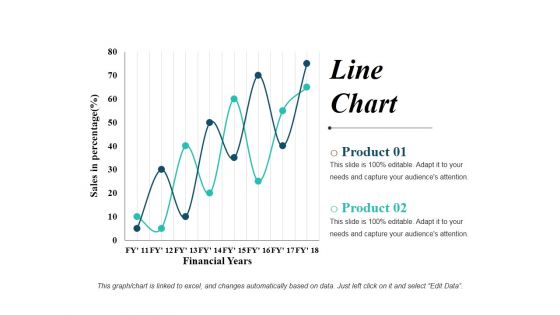
Line Chart Ppt PowerPoint Presentation Show Graphics Design
This is a line chart ppt powerpoint presentation show graphics design. This is a two stage process. The stages in this process are line graph, business, marketing, finance, planning.
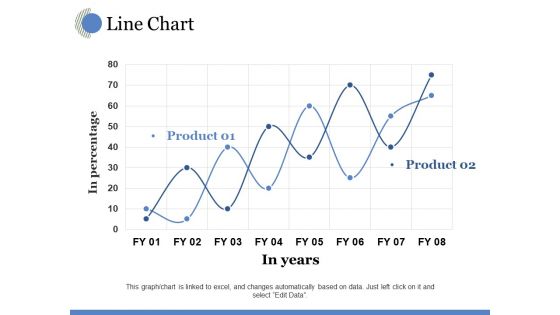
Line Chart Ppt PowerPoint Presentation Model Visual Aids
This is a line chart ppt powerpoint presentation model visual aids. This is a two stage process. The stages in this process are in years, in percentage, growth, business, marketing.

Line Chart Ppt PowerPoint Presentation Infographic Template Slides
This is a line chart ppt powerpoint presentation infographic template slides. This is a two stage process. The stages in this process are sales in percentage, financial years, business, marketing, graph.

Combo Chart Finance Ppt PowerPoint Presentation Infographic Template Graphics
This is a combo chart finance ppt powerpoint presentation infographic template graphics. This is a two stage process. The stages in this process are growth, finance, marketing, management, investment.

Bar Chart Percentage Product Ppt PowerPoint Presentation Layouts Designs Download
This is a bar chart percentage product ppt powerpoint presentation layouts designs download. This is a two stage process. The stages in this process are percentage, product, business, management.

Stock Chart Management Investment Ppt PowerPoint Presentation Infographics Professional
This is a stock chart management investment ppt powerpoint presentation infographics professional. This is a two stage process. The stages in this process are marketing, business, management, percentage, product.

Column Chart Finance Marketing Ppt PowerPoint Presentation Model Example Introduction
This is a column chart finance marketing ppt powerpoint presentation model example introduction. This is a two stage process. The stages in this process are business, management, marketing, percentage, product.
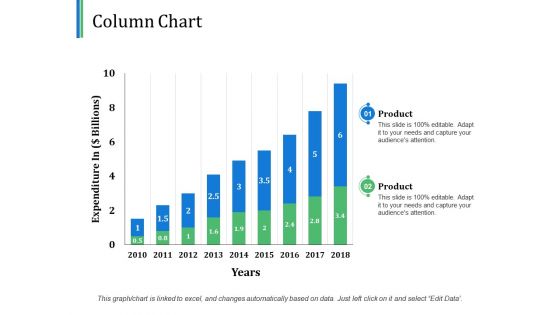
Column Chart Financial Ppt PowerPoint Presentation Outline Design Templates
This is a column chart financial ppt powerpoint presentation outline design templates. This is a two stage process. The stages in this process are financial, business, marketing, planning, strategy.

Competition Competitor Positioning Market Sharing Analysis Powerpoint Slide Themes
This is a competition competitor positioning market sharing analysis powerpoint slide themes. This is a two stage process. The stages in this process are company growth, gaining market share, losing market share, average market growth.
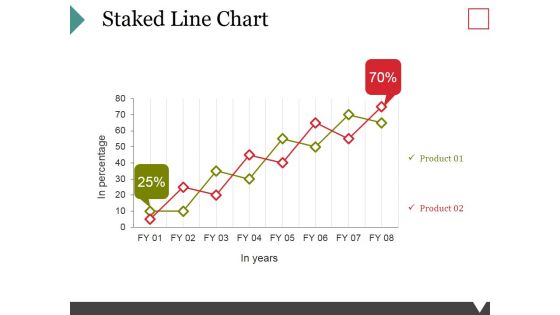
Staked Line Chart Ppt PowerPoint Presentation Model Graphics Download
This is a staked line chart ppt powerpoint presentation model graphics download. This is a two stage process. The stages in this process are business, marketing, growth, finance, management.
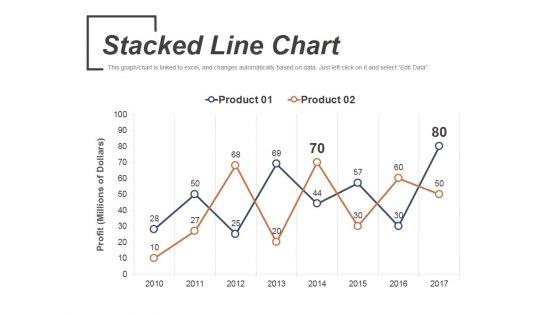
Stacked Line Chart Ppt PowerPoint Presentation Outline Examples
This is a stacked line chart ppt powerpoint presentation outline examples. This is a two stage process. The stages in this process are product, stacked line chart, business, marketing, profit.

Xbar And R Chart Ppt PowerPoint Presentation Example 2015
This is a xbar and r chart ppt powerpoint presentation example 2015. This is a two stage process. The stages in this process are business, strategy, marketing, success, growth strategy.

Column Chart Ppt PowerPoint Presentation Gallery Design Inspiration
This is a column chart ppt powerpoint presentation gallery design inspiration. This is a two stage process. The stages in this process are column chart, product, sales in percentage, financial years.

Radar Chart Ppt PowerPoint Presentation Show Graphic Tips
This is a radar chart ppt powerpoint presentation show graphic tips. This is a two stage process. The stages in this process are radar chart, finance, management, marketing, business, analysis.

Column Chart Ppt PowerPoint Presentation Gallery Graphics Pictures
This is a column chart ppt powerpoint presentation gallery graphics pictures. This is a two stage process. The stages in this process are column chart, finance, planning, analysis, management, growth.

Radar Chart Ppt PowerPoint Presentation Inspiration File Formats
This is a radar chart ppt powerpoint presentation inspiration file formats. This is a two stage process. The stages in this process are radar chart, business, finance, management, analysis.
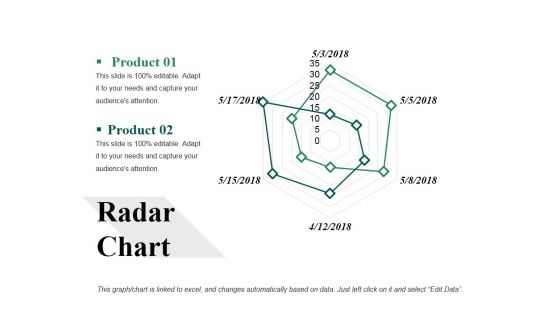
Radar Chart Ppt PowerPoint Presentation File Background Image
This is a radar chart ppt powerpoint presentation file background image. This is a two stage process. The stages in this process are radar chart, finance, analysis, marketing, business.
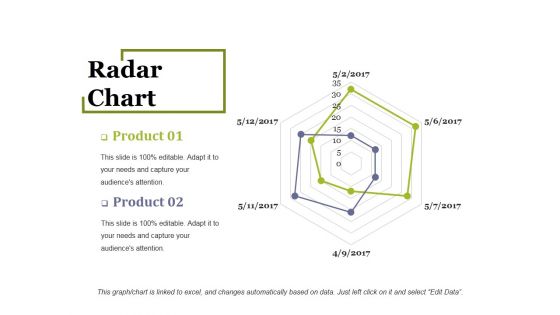
Radar Chart Ppt PowerPoint Presentation Infographic Template Outline
This is a radar chart ppt powerpoint presentation infographic template outline. This is a two stage process. The stages in this process are radar chart, finance, analysis, management, business.
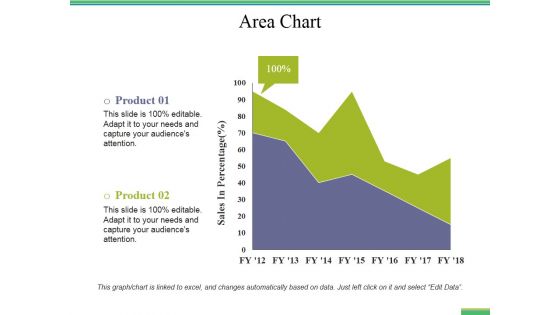
Area Chart Ppt PowerPoint Presentation Portfolio Graphics Template
This is a area chart ppt powerpoint presentation portfolio graphics template. This is a two stage process. The stages in this process are area chart, finance, analysis, business, marketing.
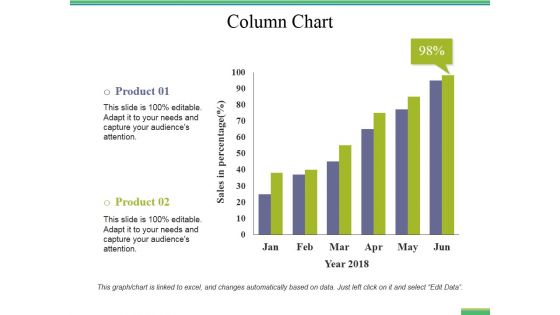
Column Chart Ppt PowerPoint Presentation Pictures Visual Aids
This is a column chart ppt powerpoint presentation pictures visual aids. This is a two stage process. The stages in this process are column chart, business, finance, marketing, analysis, investment.
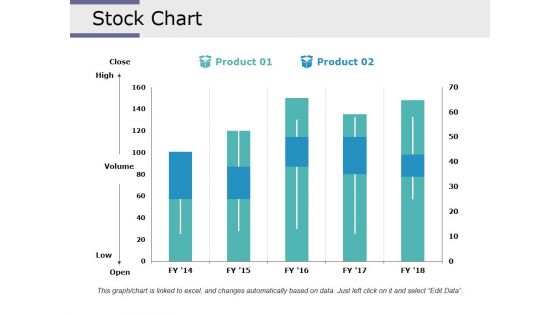
Stock Chart Ppt PowerPoint Presentation Infographic Template Design Inspiration
This is a stock chart ppt powerpoint presentation infographic template design inspiration. This is a two stage process. The stages in this process are stock chart, finance, analysis, business, marketing.

column chart ppt powerpoint presentation portfolio master slide
This is a column chart ppt powerpoint presentation portfolio master slide. This is a two stage process. The stages in this process are column chart, finance, analysis, marketing, business.

Area Chart Ppt PowerPoint Presentation Visual Aids Gallery
This is a area chart ppt powerpoint presentation visual aids gallery. This is a two stage process. The stages in this process are area chart, finance, marketing, analysis, business.
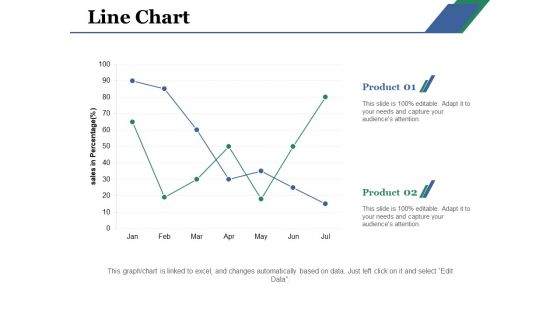
Line Chart Ppt PowerPoint Presentation Layouts Example File
This is a line chart ppt powerpoint presentation layouts example file. This is a two stage process. The stages in this process are line chart, product, business, sales, analysis.

Column Chart Finance Ppt PowerPoint Presentation Infographics Backgrounds
This is a column chart finance ppt powerpoint presentation infographics backgrounds. This is a two stage process. The stages in this process are column chart, investment, marketing, finance, analysis.

Column Chart Finance Ppt PowerPoint Presentation Model Examples
This is a column chart finance ppt powerpoint presentation model examples. This is a two stage process. The stages in this process are column chart, finance, marketing, analysis, investment.
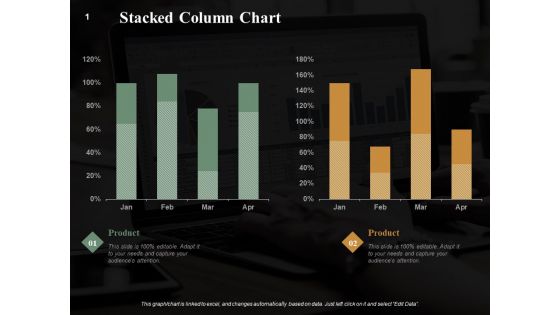
Stacked Column Chart Finance Ppt PowerPoint Presentation Summary Graphics Example
This is a stacked column chart finance ppt powerpoint presentation summary graphics example. This is a two stage process. The stages in this process are stacked column chart, marketing, analysis, business, investment.
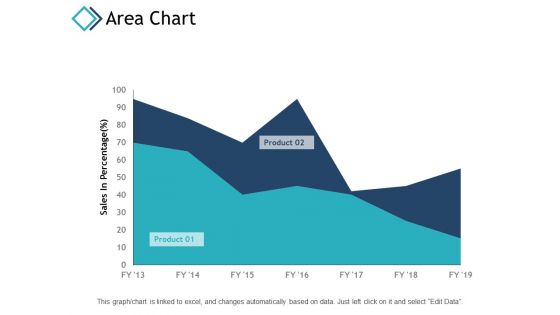
Area Chart Marketing Planning Ppt PowerPoint Presentation Ideas Maker
This is a area chart marketing planning ppt powerpoint presentation ideas maker. This is a two stage process. The stages in this process are area chart, finance, marketing, analysis, investment.

Area Chart Finance Ppt PowerPoint Presentation Pictures Clipart
This is a area chart finance ppt powerpoint presentation pictures clipart. This is a two stage process. The stages in this process are area chart, finance, marketing, analysis, investment.

Quantitative Bar Chart For Data Analysis Ppt PowerPoint Presentation Model Graphic Tips
This is a quantitative bar chart for data analysis ppt powerpoint presentation model graphic tips. This is a two stage process. The stages in this process are financial analysis, quantitative, statistical modelling.
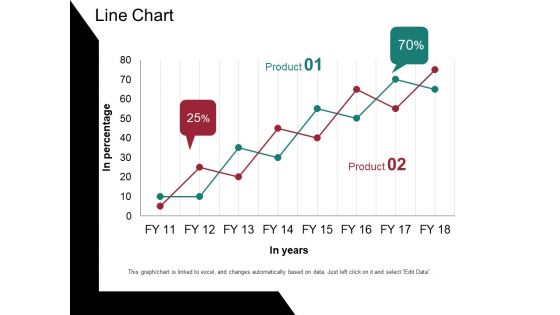
Line Chart Ppt PowerPoint Presentation Portfolio Design Templates
This is a line chart ppt powerpoint presentation portfolio design templates. This is a two stage process. The stages in this process are in percentage, in years, percentage, business, graph.
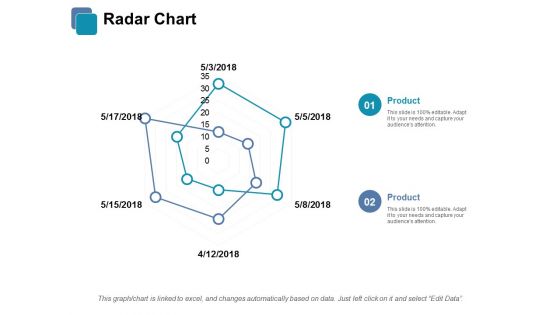
Radar Chart Ppt PowerPoint Presentation Infographic Template Visuals
This is a radar chart ppt powerpoint presentation infographic template visuals. This is a two stage process. The stages in this process are radar chart, finance, business, marketing, analysis.
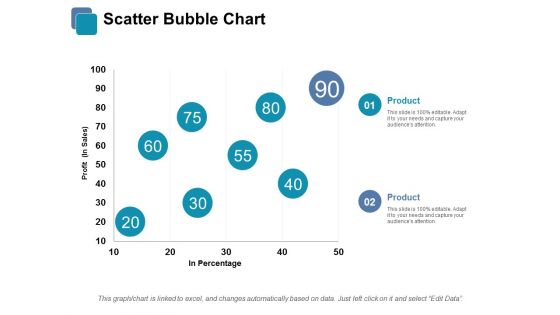
Scatter Bubble Chart Ppt PowerPoint Presentation Infographic Template Infographics
This is a scatter bubble chart ppt powerpoint presentation infographic template infographics. This is a two stage process. The stages in this process are scatter bubble chart, finance, business, marketing, analysis.

Clustered Bar Chart Finance Ppt PowerPoint Presentation Styles Design Inspiration
This is a clustered bar chart finance ppt powerpoint presentation styles design inspiration. This is a two stage process. The stages in this process are clustered bar chart, finance, business, analysis, investment.

Bubble Chart Finance Ppt PowerPoint Presentation File Graphics
This is a bubble chart finance ppt powerpoint presentation file graphics. This is a two stage process. The stages in this process are bubble chart, finance, marketing, analysis, investment.
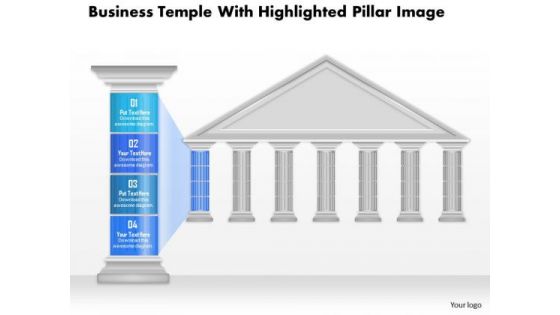
Business Diagram Business Temple With Highlighted Pillar Image Presentation Template
This Power Point template has design of pillars info graphics and temple. This graphic contains the two text pillars to display the business options. Use this pillar diagram in your presentations to display business plans and strategies.

 Home
Home