Turnover Dashboard

Measuring Sales Performance And Productivity Ppt PowerPoint Presentation Infographic Template Sample
This is a measuring sales performance and productivity ppt powerpoint presentation infographic template sample. This is a eight stage process. The stages in this process are sales objectives, sales goal, achieving sales target.

Technology Trends In Online Insurance Impact Of Digital Technologies On Insurers Roi
The following slide highlights impact of transforming business to digital on insurance company ROIs. It also presents various factors that leads to higher returns on investment. It consists of improve product design, enhance sales and marketing efforts, improve services and engagement and minimize costs. Are you searching for a Technology Trends In Online Insurance Impact Of Digital Technologies On Insurers Roi that is uncluttered, straightforward, and original Its easy to edit, and you can change the colors to suit your personal or business branding. For a presentation that expresses how much effort you have put in, this template is ideal With all of its features, including tables, diagrams, statistics, and lists, its perfect for a business plan presentation. Make your ideas more appealing with these professional slides. Download Technology Trends In Online Insurance Impact Of Digital Technologies On Insurers Roi from Slidegeeks today.
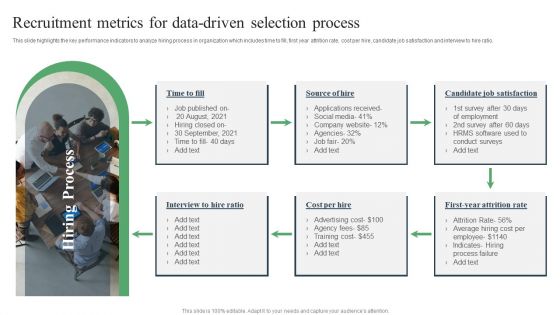
Recruitment Metrics For Data Driven Selection Process Ppt PowerPoint Presentation Inspiration Graphics Download PDF
This slide highlights the key performance indicators to analyze hiring process in organization which includes time to fill, first year attrition rate, cost per hire, candidate job satisfaction and interview to hire ratio. Persuade your audience using this Recruitment Metrics For Data-Driven Selection Process Ppt PowerPoint Presentation Inspiration Graphics Download PDF. This PPT design covers one stage, thus making it a great tool to use. It also caters to a variety of topics including Candidate Job, Satisfaction, Attrition Rate. Download this PPT design now to present a convincing pitch that not only emphasizes the topic but also showcases your presentation skills.
Sales Kpis With Lead Status By Owner Ppt PowerPoint Presentation Icon Shapes PDF
Presenting this set of slides with name sales kpis with lead status by owner ppt powerpoint presentation icon shapes pdf. The topics discussed in these slides are top campaigns, expected revenue by marketing channel, new leads this month, reasons for unqualified leads, lead status by owner. This is a completely editable PowerPoint presentation and is available for immediate download. Download now and impress your audience.
Subordinated Loan Funding Competitive Analysis By Operational And Financial Data Ppt Icon Infographic Template PDF
The slide provides the Competitive landscape of the company on the basis of financial data sales and profit and operational data employee count, locations, year of existence etc.Deliver an awe inspiring pitch with this creative subordinated loan funding competitive analysis by operational and financial data ppt icon infographic template pdf. bundle. Topics like competitive factor, locations major, product service, quality consumer, feedback. can be discussed with this completely editable template. It is available for immediate download depending on the needs and requirements of the user.
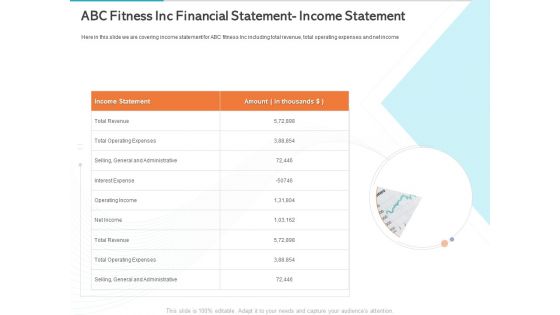
Gym Health And Fitness Market Industry Report Abc Fitness Inc Financial Statement Income Statement Ppt Infographic Template Gallery PDF
Presenting this set of slides with name gym health and fitness market industry report abc fitness inc financial statement income statement ppt infographic template gallery pdf. The topics discussed in these slides are income statement, amount, total revenue, total operating expenses, general and administrative, interest expense, operating income, net income. This is a completely editable PowerPoint presentation and is available for immediate download. Download now and impress your audience.

Big Data Architect Overview Of Big Data Service Provider Company Mockup PDF
This slide represents the overview of the big data company by covering details of their total associates, entire countries they served in, and total income.Deliver an awe inspiring pitch with this creative Big Data Architect Overview Of Big Data Service Provider Company Mockup PDF bundle. Topics like Human Resources, Information Technology, Legal Compliance can be discussed with this completely editable template. It is available for immediate download depending on the needs and requirements of the user.

Comparative Market Analysis Tools For Brand Strengthening Infographics Pdf
The following slide exhibits means of gauging market perception of products or services offered. It helps businesses build brand awareness and increase sales. It includes information related to industry trends, data supplier, competitor engagement, etc.Pitch your topic with ease and precision using this Comparative Market Analysis Tools For Brand Strengthening Infographics Pdf This layout presents information on Engagement Audience, Accurate Data Supplier, Track Competitor It is also available for immediate download and adjustment. So, changes can be made in the color, design, graphics or any other component to create a unique layout.
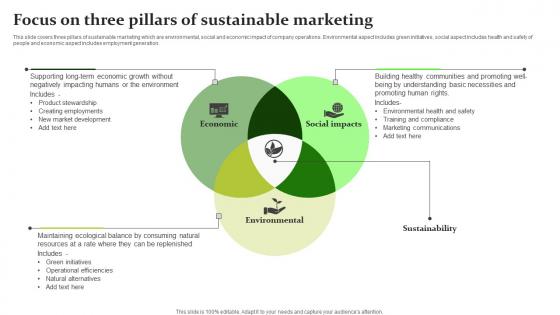
Sustainable Workplace Development Focus On Three Pillars Of Sustainable Marketing Pictures Pdf
This slide covers three pillars of sustainable marketing which are environmental, social and economic impact of company operations. Environmental aspect includes green initiatives, social aspect includes health and safety of people and economic aspect includes employment generation. The Sustainable Workplace Development Focus On Three Pillars Of Sustainable Marketing Pictures Pdf is a compilation of the most recent design trends as a series of slides. It is suitable for any subject or industry presentation, containing attractive visuals and photo spots for businesses to clearly express their messages. This template contains a variety of slides for the user to input data, such as structures to contrast two elements, bullet points, and slides for written information. Slidegeeks is prepared to create an impression.

Strategic Market Insight Implementation Guide Data Evaluation Sample With Conjoint Analysis Background PDF
The following slide showcases sample of data assessment with conjoint analysis method to compare features and identify value. It outlines key components such as attribute, level, all responses and comments. Slidegeeks is here to make your presentations a breeze with Strategic Market Insight Implementation Guide Data Evaluation Sample With Conjoint Analysis Background PDF With our easy to use and customizable templates, you can focus on delivering your ideas rather than worrying about formatting. With a variety of designs to choose from, you are sure to find one that suits your needs. And with animations and unique photos, illustrations, and fonts, you can make your presentation pop. So whether you are giving a sales pitch or presenting to the board, make sure to check out Slidegeeks first.

Analysis Techniques For Sales Growth Sales Target Metrics Pictures PDF
This slide presents multiple techniques to analyse Sales Target Metrics for sales growth helpful to investigate underlying data and look for efficiencies. It includes methods such as net working capital, sales growth, affordable growth rate and break even percentage that can prove to be highly effective. Presenting Analysis Techniques For Sales Growth Sales Target Metrics Pictures PDF to dispense important information. This template comprises four stages. It also presents valuable insights into the topics including Net Working Capital, Affordable Growth Rate, Break Even Percentage. This is a completely customizable PowerPoint theme that can be put to use immediately. So, download it and address the topic impactfully.
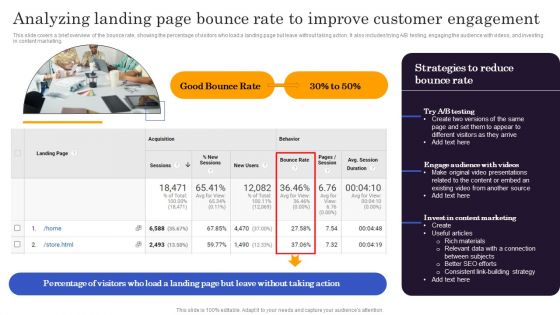
Marketers Guide To Data Analysis Optimization Analyzing Landing Page Bounce Rate To Improve Professional PDF
This slide covers a brief overview of the bounce rate, showing the percentage of visitors who load a landing page but leave without taking action. It also includes trying A B testing, engaging the audience with videos, and investing in content marketing. Slidegeeks is here to make your presentations a breeze with Marketers Guide To Data Analysis Optimization Analyzing Landing Page Bounce Rate To Improve Professional PDF With our easy to use and customizable templates, you can focus on delivering your ideas rather than worrying about formatting. With a variety of designs to choose from, you are sure to find one that suits your needs. And with animations and unique photos, illustrations, and fonts, you can make your presentation pop. So whether you are giving a sales pitch or presenting to the board, make sure to check out Slidegeeks first.
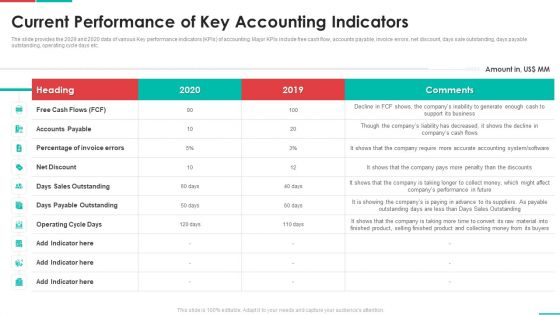
Roadmap For Financial Accounting Transformation Current Performance Of Key Accounting Indicators Elements PDF
The slide provides the 2029 and 2020 data of various Key performance indicators KPIs of accounting. Major KPIs include free cash flow, accounts payable, invoice errors, net discount, days sale outstanding, days payable outstanding, operating cycle days etc. Deliver an awe inspiring pitch with this creative roadmap for financial accounting transformation current performance of key accounting indicators elements pdf bundle. Topics like accounts payable, operating cycle days, days payable outstanding, net discount can be discussed with this completely editable template. It is available for immediate download depending on the needs and requirements of the user.

Most Common Predictive Analytics Software Developing Strategic Insights Using Big Data Analytics SS V
This slide showcases major software providers for predictive analytics based on company revenue. It provides information regarding companies such as microsoft, siemens, IBM corporation, oracle , google cloud and SAS institute inc. Make sure to capture your audiences attention in your business displays with our gratis customizable Most Common Predictive Analytics Software Developing Strategic Insights Using Big Data Analytics SS V. These are great for business strategies, office conferences, capital raising or task suggestions. If you desire to acquire more customers for your tech business and ensure they stay satisfied, create your own sales presentation with these plain slides.
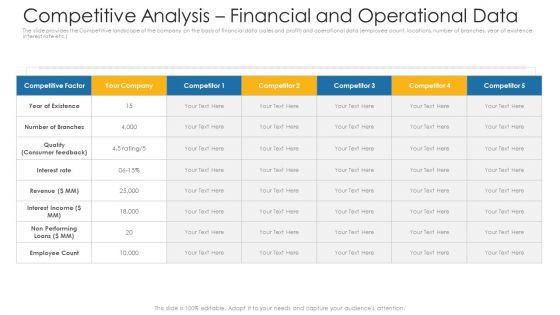
Competitive Analysis Financial And Operational Data Ppt Infographic Template Structure PDF
The slide provides the Competitive landscape of the company on the basis of financial data sales and profit and operational data employee count, locations, number of branches, year of existence, interest rate etc.Deliver an awe-inspiring pitch with this creative competitive analysis financial and operational data ppt infographic template structure pdf. bundle. Topics like revenue, interest income, employee count can be discussed with this completely editable template. It is available for immediate download depending on the needs and requirements of the user.
Annual Sales Performance Gap Assessment Icon Topics PDF
Persuade your audience using this Annual Sales Performance Gap Assessment Icon Topics PDF. This PPT design covers three stages, thus making it a great tool to use. It also caters to a variety of topics including Annual Sales Performance, Gap Assessment Icon. Download this PPT design now to present a convincing pitch that not only emphasizes the topic but also showcases your presentation skills.
Stages To Prevent Revenue Loss Ppt PowerPoint Presentation Icon File Formats PDF
Persuade your audience using this stages to prevent revenue loss ppt powerpoint presentation icon file formats pdf. This PPT design covers one stages, thus making it a great tool to use. It also caters to a variety of topics including encourage higher product registration rate, revaluate how to capture customer data, conduct ongoing installed based data analysis, deliver actionable business intelligence, address low cost contract renewals with automation. Download this PPT design now to present a convincing pitch that not only emphasizes the topic but also showcases your presentation skills.

HR Roles And Responsibilities Employee Performance Improvement Strategies Infographics Pdf
This slide covers roles and responsibilities of HR managers to enhance employee performance at workplace. It involves training and development, designing workplace policies, monitoring performance and rewarding and recognition. Make sure to capture your audiences attention in your business displays with our gratis customizable HR Roles And Responsibilities Employee Performance Improvement Strategies Infographics Pdf. These are great for business strategies, office conferences, capital raising or task suggestions. If you desire to acquire more customers for your tech business and ensure they stay satisfied, create your own sales presentation with these plain slides.
Projection Of Major Kpis Related To Customer Onboarding Ppt Icon Example PDF
This slide provides the projections of key performance indicators KPIs related to customer onboarding. KPIs covered in this slide include number of customers, customer churn rate, customer retention rate etc. Deliver an awe-inspiring pitch with this creative projection of major kpis related to customer onboarding ppt icon example pdf. bundle. Topics like customer churn rate, customer retention rate, indicator, number of customers can be discussed with this completely editable template. It is available for immediate download depending on the needs and requirements of the user.

Stages Of Pie Chart Data Interpretation Business Plan Template PowerPoint Templates
We present our stages of pie chart data interpretation business plan template PowerPoint templates.Download and present our Circle Charts PowerPoint Templates because You can Stir your ideas in the cauldron of our PowerPoint Templates and Slides. Cast a magic spell on your audience. Download our Marketing PowerPoint Templates because Our PowerPoint Templates and Slides will let you Hit the target. Go the full distance with ease and elan. Use our Business PowerPoint Templates because Our PowerPoint Templates and Slides are truly out of this world. Even the MIB duo has been keeping tabs on our team. Download our Shapes PowerPoint Templates because Watching this your Audience will Grab their eyeballs, they wont even blink. Download our Process and Flows PowerPoint Templates because It will Give impetus to the hopes of your colleagues. Our PowerPoint Templates and Slides will aid you in winning their trust.Use these PowerPoint slides for presentations relating to achievement, analysis, background, bank, banking, business, calculation, chart, circle, commerce, commercial, commission, concept, credit, crisis, debt, deposit, design, detail, diagram, earnings, economics, economy, element, finance, goal, gold, golden, graph, graphic, growth, icon, idea, illustration, income, increase, invest, isolated, level, loss, market, marketing, metal, modern, money, new, object, part, percent, percentage, pie, plot, politics, profit, progress, ratio, reflection, reflective. The prominent colors used in the PowerPoint template are Blue, Gray, Black.

Stages Of Pie Chart Data Interpretation Example Business Plan PowerPoint Slides
We present our stages of pie chart data interpretation example business plan PowerPoint Slides.Download and present our Circle Charts PowerPoint Templates because It will let you Set new benchmarks with our PowerPoint Templates and Slides. They will keep your prospects well above par. Download our Marketing PowerPoint Templates because Our PowerPoint Templates and Slides will weave a web of your great ideas. They are gauranteed to attract even the most critical of your colleagues. Use our Business PowerPoint Templates because It will Strengthen your hand with your thoughts. They have all the aces you need to win the day. Present our Shapes PowerPoint Templates because It will get your audience in sync. Present our Process and Flows PowerPoint Templates because Our PowerPoint Templates and Slides will generate and maintain the level of interest you desire. They will create the impression you want to imprint on your audience.Use these PowerPoint slides for presentations relating to achievement, analysis, background, bank, banking, business, calculation, chart, circle, commerce, commercial, commission, concept, credit, crisis, debt, deposit, design, detail, diagram, earnings, economics, economy, element, finance, goal, gold, golden, graph, graphic, growth, icon, idea, illustration, income, increase, invest, isolated, level, loss, market, marketing, metal, modern, money, new, object, part, percent, percentage, pie, plot, politics, profit, progress, ratio, reflection, reflective. The prominent colors used in the PowerPoint template are Blue navy, Gray, Black.
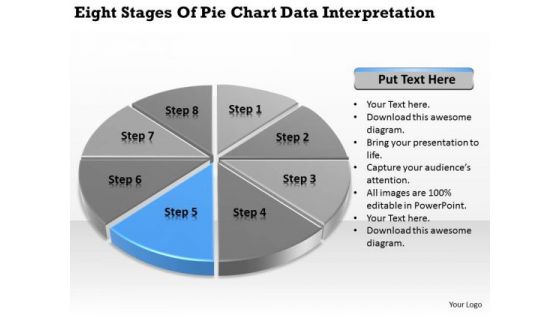
Stages Of Pie Chart Data Interpretation How To Write Business Plan PowerPoint Templates
We present our stages of pie chart data interpretation how to write business plan PowerPoint templates.Present our Circle Charts PowerPoint Templates because Our PowerPoint Templates and Slides will provide you a launch platform. Give a lift off to your ideas and send them into orbit. Present our Marketing PowerPoint Templates because Our PowerPoint Templates and Slides will let you Hit the right notes. Watch your audience start singing to your tune. Use our Business PowerPoint Templates because Our PowerPoint Templates and Slides come in all colours, shades and hues. They help highlight every nuance of your views. Download our Shapes PowerPoint Templates because It can Leverage your style with our PowerPoint Templates and Slides. Charm your audience with your ability. Use our Process and Flows PowerPoint Templates because You can Connect the dots. Fan expectations as the whole picture emerges.Use these PowerPoint slides for presentations relating to achievement, analysis, background, bank, banking, business, calculation, chart, circle, commerce, commercial, commission, concept, credit, crisis, debt, deposit, design, detail, diagram, earnings, economics, economy, element, finance, goal, gold, golden, graph, graphic, growth, icon, idea, illustration, income, increase, invest, isolated, level, loss, market, marketing, metal, modern, money, new, object, part, percent, percentage, pie, plot, politics, profit, progress, ratio, reflection, reflective. The prominent colors used in the PowerPoint template are Blue, Gray, Black.

Stages Of Pie Chart Data Interpretation Vending Machine Business Plan PowerPoint Slides
We present our stages of pie chart data interpretation vending machine business plan PowerPoint Slides.Present our Circle Charts PowerPoint Templates because You should Bet on your luck with our PowerPoint Templates and Slides. Be assured that you will hit the jackpot. Present our Marketing PowerPoint Templates because Our PowerPoint Templates and Slides will provide you the cutting edge. Slice through the doubts in the minds of your listeners. Download our Business PowerPoint Templates because you should Experience excellence with our PowerPoint Templates and Slides. They will take your breath away. Download our Shapes PowerPoint Templates because It will Raise the bar of your Thoughts. They are programmed to take you to the next level. Present our Process and Flows PowerPoint Templates because Our PowerPoint Templates and Slides will give good value for money. They also have respect for the value of your time.Use these PowerPoint slides for presentations relating to achievement, analysis, background, bank, banking, business, calculation, chart, circle, commerce, commercial, commission, concept, credit, crisis, debt, deposit, design, detail, diagram, earnings, economics, economy, element, finance, goal, gold, golden, graph, graphic, growth, icon, idea, illustration, income, increase, invest, isolated, level, loss, market, marketing, metal, modern, money, new, object, part, percent, percentage, pie, plot, politics, profit, progress, ratio, reflection, reflective. The prominent colors used in the PowerPoint template are Blue, Gray, Black.
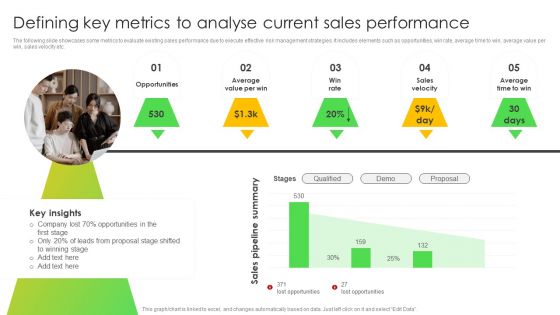
Defining Key Metrics To Analyse Current Sales Performance Background PDF
The following slide showcases some metrics to evaluate existing sales performance due to execute effective risk management strategies. It includes elements such as opportunities, win rate, average time to win, average value per win, sales velocity etc. Want to ace your presentation in front of a live audience Our Defining Key Metrics To Analyse Current Sales Performance Background PDF can help you do that by engaging all the users towards you. Slidegeeks experts have put their efforts and expertise into creating these impeccable powerpoint presentations so that you can communicate your ideas clearly. Moreover, all the templates are customizable, and easy to edit and downloadable. Use these for both personal and commercial use.

Sales Trend Assessment Diagram Powerpoint Slides Show
This is a sales trend assessment diagram powerpoint slides show. This is a four stage process. The stages in this process are relationships, teams, sales productivity, leadership.
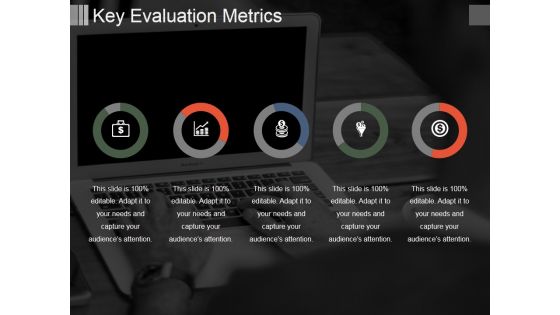
Key Evaluation Metrics Ppt PowerPoint Presentation Show Guide
This is a key evaluation metrics ppt powerpoint presentation show guide. This is a five stage process. The stages in this process are donut, icons, business, strategy, analysis.
Healthcare Equipment Sale Trends Icon Download PDF
Presenting Healthcare Equipment Sale Trends Icon Download PDF to dispense important information. This template comprises three stages. It also presents valuable insights into the topics including Healthcare Equipment, Sale Trends Icon. This is a completely customizable PowerPoint theme that can be put to use immediately. So, download it and address the topic impactfully.
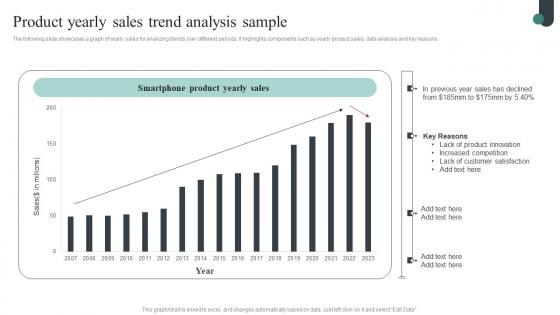
Competitive Intelligence Guide To Determine Market Product Yearly Sales Trend Download Pdf
The following slide showcases a graph of yearly sales for analyzing trends over different periods. It highlights components such as yearly product sales, data analysis and key reasons. This modern and well-arranged Competitive Intelligence Guide To Determine Market Product Yearly Sales Trend Download Pdf provides lots of creative possibilities. It is very simple to customize and edit with the Powerpoint Software. Just drag and drop your pictures into the shapes. All facets of this template can be edited with Powerpoint no extra software is necessary. Add your own material, put your images in the places assigned for them, adjust the colors, and then you can show your slides to the world, with an animated slide included.
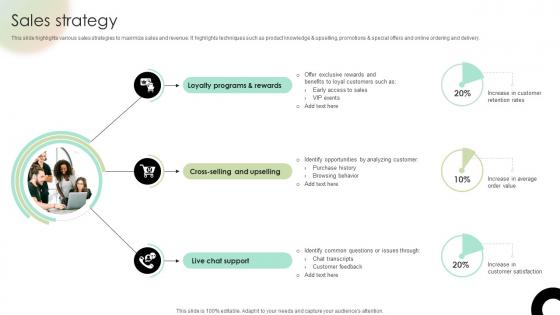
Sales Strategy Digital Fashion Brand Portal Market Entry Plan GTM SS V
This slide highlights various sales strategies to maximize sales and revenue. It highlights techniques such as product knowledge and upselling, promotions and special offers and online ordering and delivery.The Sales Strategy Digital Fashion Brand Portal Market Entry Plan GTM SS V is a compilation of the most recent design trends as a series of slides. It is suitable for any subject or industry presentation, containing attractive visuals and photo spots for businesses to clearly express their messages. This template contains a variety of slides for the user to input data, such as structures to contrast two elements, bullet points, and slides for written information. Slidegeeks is prepared to create an impression.

Big Data Workflow Management Ppt PowerPoint Presentation Introduction
This is a big data workflow management ppt powerpoint presentation introduction. This is a one stage process. The stages in this process are big data, actionable intelligence, database, location, social.
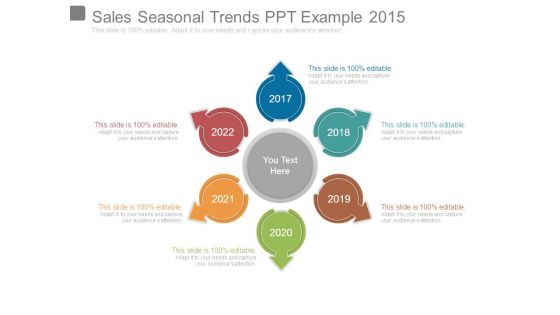
Sales Seasonal Trends Ppt Example 2015
This is a sales seasonal trends ppt example 2015. This is a six stage process. The stages in this process are process, marketing, analysis, management, arrows.

P And L Kpis Template 2 Ppt PowerPoint Presentation Professional Graphics
This is a p and l kpis template 2 ppt powerpoint presentation professional graphics. This is a four stage process. The stages in this process are net sales, other income, total income, expenses, total material consumed.

P And L Kpis Tabular Form Ppt PowerPoint Presentation Outline Aids
This is a p and l kpis tabular form ppt powerpoint presentation outline aids. This is a four stage process. The stages in this process are net sales, other income, total income, expenses, taxes.
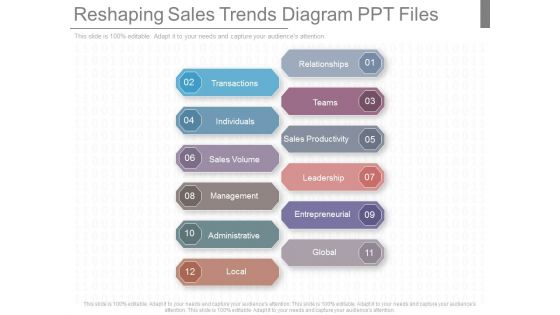
Reshaping Sales Trends Diagram Ppt Files
This is a reshaping sales trends diagram ppt files. This is a twelve stage process. The stages in this process are relationships, transactions, teams, individuals, sales productivity, sales volume, leadership, management, entrepreneurial, administrative, global, local.

Defining Key Metrics To Analyse Current Sales Performance Rules PDF
The following slide showcases some metrics to evaluate existing sales performance due to execute effective risk management strategies. It includes elements such as opportunities, win rate, average time to win, average value per win, sales velocity etc. Do you know about Slidesgeeks Defining Key Metrics To Analyse Current Sales Performance Rules PDF These are perfect for delivering any kind od presentation. Using it, create PowerPoint presentations that communicate your ideas and engage audiences. Save time and effort by using our pre designed presentation templates that are perfect for a wide range of topic. Our vast selection of designs covers a range of styles, from creative to business, and are all highly customizable and easy to edit. Download as a PowerPoint template or use them as Google Slides themes.
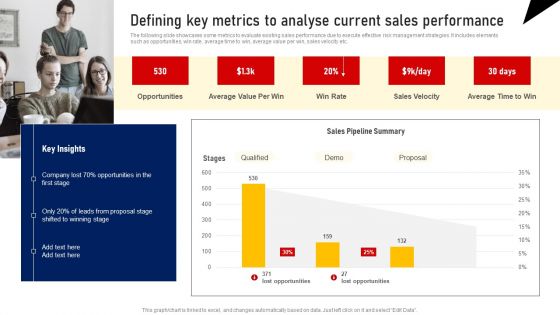
Defining Key Metrics To Analyse Current Sales Performance Summary PDF
The following slide showcases some metrics to evaluate existing sales performance due to execute effective risk management strategies. It includes elements such as opportunities, win rate, average time to win, average value per win, sales velocity etc. Do you know about Slidesgeeks Defining Key Metrics To Analyse Current Sales Performance Summary PDF These are perfect for delivering any kind od presentation. Using it, create PowerPoint presentations that communicate your ideas and engage audiences. Save time and effort by using our pre designed presentation templates that are perfect for a wide range of topic. Our vast selection of designs covers a range of styles, from creative to business, and are all highly customizable and easy to edit. Download as a PowerPoint template or use them as Google Slides themes.
Quantitative Data Analysis Icon For Product Sales Evaluation Ppt Visual Aids Deck PDF
Showcasing this set of slides titled Quantitative Data Analysis Icon For Product Sales Evaluation Ppt Visual Aids Deck PDF. The topics addressed in these templates are Quantitative Data, Analysis Icon, Product Sales Evaluation. All the content presented in this PPT design is completely editable. Download it and make adjustments in color, background, font etc. as per your unique business setting.
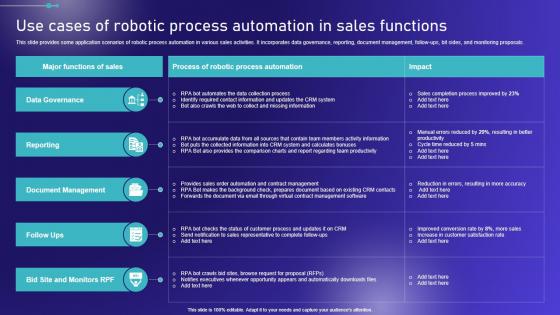
Use Cases Of Robotic Process Automation In Sales Embracing Robotic Process Guidelines PDF
This slide provides some application scenarios of robotic process automation in various sales activities. It incorporates data governance, reporting, document management, follow-ups, bit sides, and monitoring proposals. Slidegeeks is one of the best resources for PowerPoint templates. You can download easily and regulate Use Cases Of Robotic Process Automation In Sales Embracing Robotic Process Guidelines PDF for your personal presentations from our wonderful collection. A few clicks is all it takes to discover and get the most relevant and appropriate templates. Use our Templates to add a unique zing and appeal to your presentation and meetings. All the slides are easy to edit and you can use them even for advertisement purposes.

Business Development Team Sales Enablement Strategy Implementation Roadmap SA SS V
This slide provides a structured timeline showcasing the implementation of the sales enablement strategy including key strategies such as data reporting, content optimization, training and development and technology, and automation. Take your projects to the next level with our ultimate collection of Business Development Team Sales Enablement Strategy Implementation Roadmap SA SS V. Slidegeeks has designed a range of layouts that are perfect for representing task or activity duration, keeping track of all your deadlines at a glance. Tailor these designs to your exact needs and give them a truly corporate look with your own brand colors they will make your projects stand out from the rest
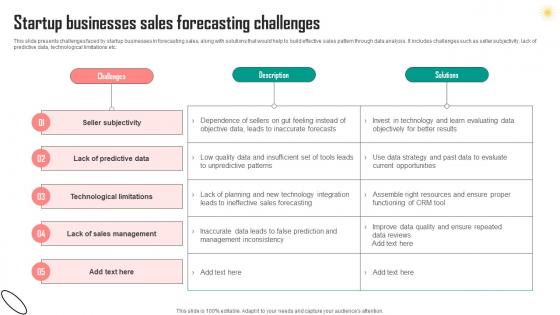
Startup Businesses Sales Forecasting Challenges Information Pdf
This slide presents challenges faced by startup businesses in forecasting sales, along with solutions that would help to build effective sales pattern through data analysis. It includes challenges such as seller subjectivity, lack of predictive data, technological limitations etc. Pitch your topic with ease and precision using this Startup Businesses Sales Forecasting Challenges Information Pdf. This layout presents information on Challenges, Description, Solutions. It is also available for immediate download and adjustment. So, changes can be made in the color, design, graphics or any other component to create a unique layout.

Identify Right Customer Segments Example Ppt Slides Download
This is a identify right customer segments example ppt slides download. This is a five stage process. The stages in this process are other solutions, sales forecasting, churn modeling, customer analysis, measure data.
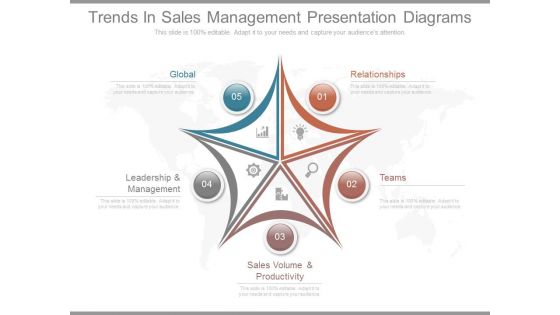
Trends In Sales Management Presentation Diagrams
This is a trends in sales management presentation diagrams. This is a five stage process. The stages in this process are global, leadership and management, sales volume and productivity, relationships, teams.

Key Metrics In Software Sales Strategy Pictures PDF
This slide presents key metrics to be tracked in software sales plan, that helps organisations to keep track of growth and profits generated over time. It includes monthly recurring revenue, average revenue per user, customer lifetime value and lead velocity rate Presenting Key Metrics In Software Sales Strategy Pictures PDF to dispense important information. This template comprises four stages. It also presents valuable insights into the topics including Monthly Recurring Revenue, Customer Lifetime Value, Lead Velocity Rate. This is a completely customizable PowerPoint theme that can be put to use immediately. So, download it and address the topic impactfully.

Data Warehouse Implementation Data Warehouse Is Integrated Download PDF
This slide depicts the integrated feature of the data warehouse and how different subjects are stored within one place in the data warehouse.Deliver an awe inspiring pitch with this creative Data Warehouse Implementation Data Warehouse Is Integrated Download PDF bundle. Topics like Sales Account, Purchase Account, Raw Material can be discussed with this completely editable template. It is available for immediate download depending on the needs and requirements of the user.
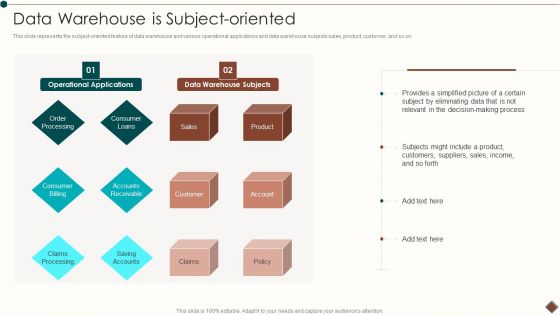
Data Warehouse Implementation Data Warehouse Is Subject Oriented Designs PDF
This slide represents the subject oriented feature of data warehouse and various operational applications and data warehouse subjects sales, product, customer, and so on.Deliver an awe inspiring pitch with this creative Data Warehouse Implementation Data Warehouse Is Subject Oriented Designs PDF bundle. Topics like Order Processing, Consumer Loans, Accounts Receivable can be discussed with this completely editable template. It is available for immediate download depending on the needs and requirements of the user.

Financial Projection And Key Metrics Ppt PowerPoint Presentation Images
This is a financial projection and key metrics ppt powerpoint presentation images. This is a five stage process. The stages in this process are business, strategy, marketing, success, analysis, table.
New Commodity Development Assessment Metrics Icons PDF
The following slide highlights the key metrics to evaluate product performance. It includes elements such as product wise revenue, time to the market etc.Pitch your topic with ease and precision using this New Commodity Development Assessment Metrics Icons PDF. This layout presents information on Annual Product, Wise Revenue, Shown Continuous. It is also available for immediate download and adjustment. So, changes can be made in the color, design, graphics or any other component to create a unique layout.

Customer Data Analysis Matrix For Assessment Of Sales Channel Template PDF
This slide shows the win loss analysis matrix for the assessment of best sales channel in terms of development resources and costs and revenue potential. Presenting customer data analysis matrix for assessment of sales channel template pdf to dispense important information. This template comprises four stages. It also presents valuable insights into the topics including customer data analysis matrix for assessment of sales channel. This is a completely customizable PowerPoint theme that can be put to use immediately. So, download it and address the topic impactfully.
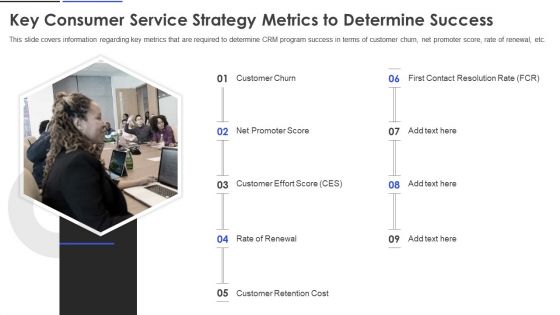
Key Consumer Service Strategy Metrics To Determine Success Portrait PDF
This slide covers information regarding key metrics that are required to determine CRM program success in terms of customer churn, net promoter score, rate of renewal, etc. This is a Key Consumer Service Strategy Metrics To Determine Success Portrait PDF template with various stages. Focus and dispense information on nine stages using this creative set, that comes with editable features. It contains large content boxes to add your information on topics like Net Promoter Score, Customer Churn, Customer Effort Score. You can also showcase facts, figures, and other relevant content using this PPT layout. Grab it now.
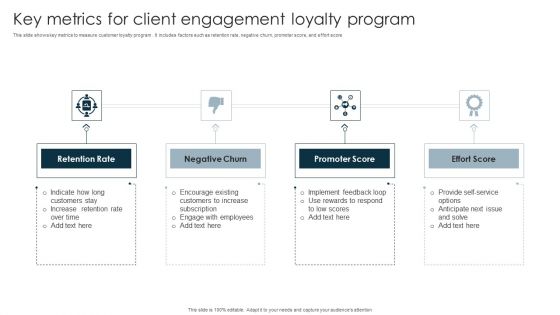
Key Metrics For Client Engagement Loyalty Program Microsoft PDF
This slide shows key metrics to measure customer loyalty program . It includes factors such as retention rate, negative churn, promoter score, and effort score. Persuade your audience using this Key Metrics For Client Engagement Loyalty Program Microsoft PDF. This PPT design covers four stages, thus making it a great tool to use. It also caters to a variety of topics including Retention Rate, Negative Churn, Promoter Score, Effort Score. Download this PPT design now to present a convincing pitch that not only emphasizes the topic but also showcases your presentation skills.
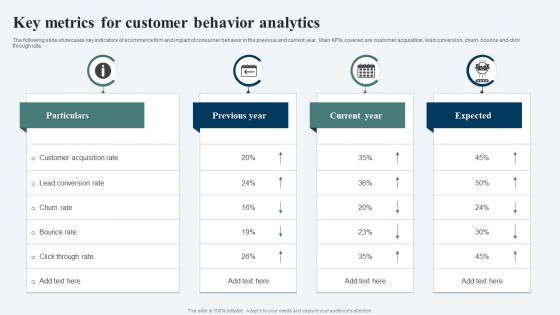
Key Metrics For Customer Behavior Analytics Ppt Model Introduction PDF
The following slide showcases key indicators of ecommerce firm and impact of consumer behavior in the previous and current year. Main KPIs covered are customer acquisition, lead conversion, churn, bounce and click through rate. Showcasing this set of slides titled Key Metrics For Customer Behavior Analytics Ppt Model Introduction PDF. The topics addressed in these templates are Particulars, Previous Year, Current Year. All the content presented in this PPT design is completely editable. Download it and make adjustments in color, background, font etc. as per your unique business setting.
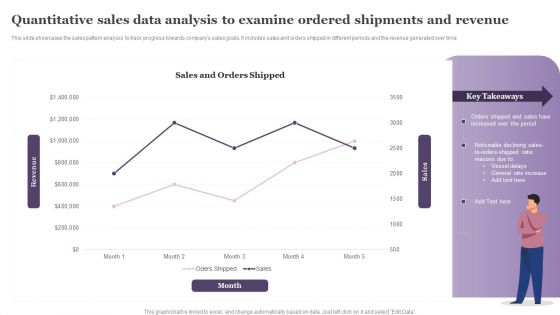
Quantitative Sales Data Analysis To Examine Ordered Shipments And Revenue Information PDF
This slide showcases the sales pattern analysis to track progress towards companys sales goals. It includes sales and orders shipped in different periods and the revenue generated over time. Showcasing this set of slides titled Quantitative Sales Data Analysis To Examine Ordered Shipments And Revenue Information PDF. The topics addressed in these templates are Sales And Orders, Month, Vessel Delays. All the content presented in this PPT design is completely editable. Download it and make adjustments in color, background, font etc. as per your unique business setting.
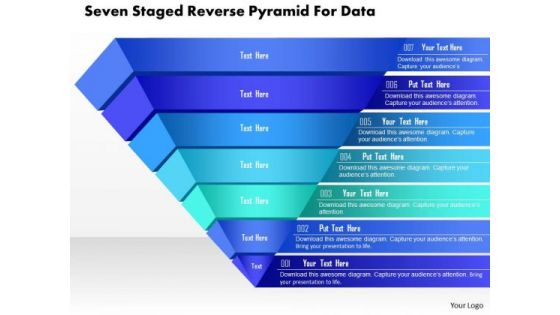
Business Diagram Seven Staged Reverse Pyramid For Data Presentation Template
This business slide is designed with seven staged pyramid diagram. Download this professional slide to depict sales and marketing analysis. This image slide is best to present your newer thoughts.
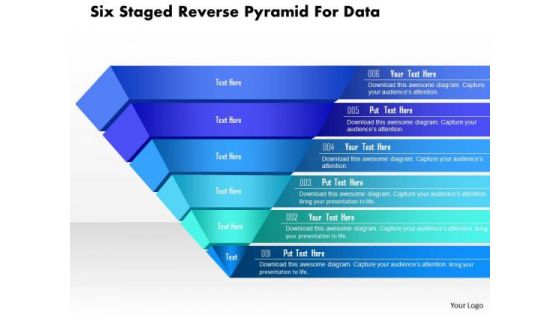
Business Diagram Six Staged Reverse Pyramid For Data Presentation Template
This business slide is designed with six staged pyramid diagram. Download this professional slide to depict sales and marketing analysis. This image slide is best to present your newer thoughts.

Information Security Challenges Businesses Face To Protect Consumers Data Privacy Professional PDF
This slide depicts the challenges faced by businesses to protect consumers data privacy, including communication issues, data breaches, cybercrimes, and threats inside the organization. Make sure to capture your audiences attention in your business displays with our gratis customizable Information Security Challenges Businesses Face To Protect Consumers Data Privacy Professional PDF. These are great for business strategies, office conferences, capital raising or task suggestions. If you desire to acquire more customers for your tech business and ensure they stay satisfied, create your own sales presentation with these plain slides.
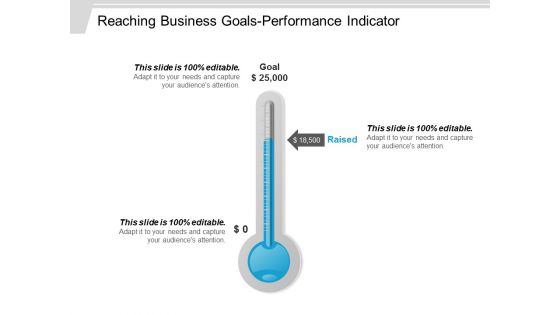
Reaching Business Goals Performance Indicator Ppt PowerPoint Presentation Pictures Infographic Template
This is a reaching business goals performance indicator ppt powerpoint presentation pictures infographic template. This is a one stage process. The stages in this process are sales objectives, sales goal, achieving sales target.

Post Implementation Other Operation And Financial Kpis Summary PDF
The slide provides five years graphs 2022F to 2026F forecasted number of major KPIs key performance indicators, that might help to track the performance of ABC Railway. Covered KPIs include Revenue, Total Passengers, operating income, customer satisfaction rate etc.Deliver and pitch your topic in the best possible manner with this post implementation other operation and financial KPIs summary pdf. Use them to share invaluable insights on total passengers, operating income, revenue, 2022 to 2026 and impress your audience. This template can be altered and modified as per your expectations. So, grab it now.
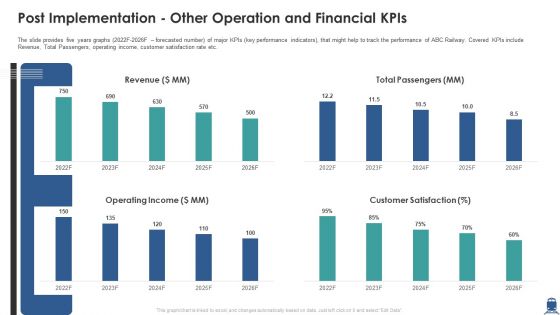
Post Implementation Other Operation And Financial Kpis Inspiration PDF
The slide provides five years graphs 2022F-2026F forecasted number of major KPIs key performance indicators, that might help to track the performance of ABC Railway. Covered KPIs include Revenue, Total Passengers, operating income, customer satisfaction rate etc. Deliver and pitch your topic in the best possible manner with this post implementation other operation and financial kpis inspiration pdf. Use them to share invaluable insights on revenue, operating income, customer satisfaction and impress your audience. This template can be altered and modified as per your expectations. So, grab it now.

Global Market Trends Of Autonomous Vehicles Innovative Tactics For Revving Up Strategy SS
This slide showcases the global market trends of autonomous vehicles. It includes trends such as advancements in technology, electric and autonomous synergy, ride-sharing and mobility and regulatory developments. Make sure to capture your audiences attention in your business displays with our gratis customizable Global Market Trends Of Autonomous Vehicles Innovative Tactics For Revving Up Strategy SS. These are great for business strategies, office conferences, capital raising or task suggestions. If you desire to acquire more customers for your tech business and ensure they stay satisfied, create your own sales presentation with these plain slides.

Data Quality Kpis Metrics Scorecard For Core Business Processes Topics PDF
This slide covers score for data obtained from core business activities and process. It includes quality metrics such as accuracy, completeness, consistency, integrity, timeliness, uniqueness and validity for data from business partners, finance, material management, sales, etc. Showcasing this set of slides titled Data Quality Kpis Metrics Scorecard For Core Business Processes Topics PDF. The topics addressed in these templates are Data Quality, Errors, Reports. All the content presented in this PPT design is completely editable. Download it and make adjustments in color, background, font etc. as per your unique business setting.

 Home
Home