Timeline Dashboard
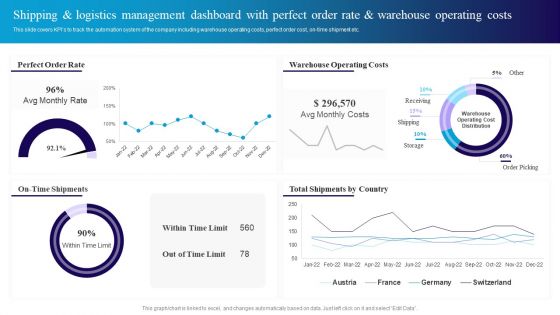
Shipping And Logistics Management Dashboard With Perfect Order Rate And Warehouse Sample PDF
This slide covers KPIs to track the automation system of the company including warehouse operating costs, perfect order cost, ontime shipment etc. This Shipping And Logistics Management Dashboard With Perfect Order Rate And Warehouse Sample PDF from Slidegeeks makes it easy to present information on your topic with precision. It provides customization options, so you can make changes to the colors, design, graphics, or any other component to create a unique layout. It is also available for immediate download, so you can begin using it right away. Slidegeeks has done good research to ensure that you have everything you need to make your presentation stand out. Make a name out there for a brilliant performance.

Mobile Promotion Strategic Guide For Micro Businesses Sms Marketing Result Assessment With Kpi Dashboard Slides PDF
The following slide depicts the key outcomes of SMS promotion strategy to track its effectiveness. It includes elements such as sales graph, metrics, order, marketing subscribers, average order value, SMS sent, revenue per click, conversion rate, return on investment etc. Slidegeeks is here to make your presentations a breeze with Mobile Promotion Strategic Guide For Micro Businesses Sms Marketing Result Assessment With Kpi Dashboard Slides PDF With our easy to use and customizable templates, you can focus on delivering your ideas rather than worrying about formatting. With a variety of designs to choose from, you are sure to find one that suits your needs. And with animations and unique photos, illustrations, and fonts, you can make your presentation pop. So whether you are giving a sales pitch or presenting to the board, make sure to check out Slidegeeks first.

Strategies To Maintain Transportation Shipping And Logistics Management Dashboard With Perfect Ppt Portfolio Slide PDF
This slide covers KPIs to track the automation system of the company including warehouse operating costs, perfect order cost, on-time shipment etc. Retrieve professionally designed Strategies To Maintain Transportation Shipping And Logistics Management Dashboard With Perfect Ppt Portfolio Slide PDF to effectively convey your message and captivate your listeners. Save time by selecting pre-made slideshows that are appropriate for various topics, from business to educational purposes. These themes come in many different styles, from creative to corporate, and all of them are easily adjustable and can be edited quickly. Access them as PowerPoint templates or as Google Slides themes. You do not have to go on a hunt for the perfect presentation because Slidegeeks got you covered from everywhere.
Procurement Automation Strategy End To End Process Tracking Dashboard On Cloud Pictures PDF
This slide covers tool for analysing end to end procurement process. It includes features such as tracking real- time overall business health, checking quotation to order conversion, automated notifications and payments reminders, etc. Do you know about Slidesgeeks Procurement Automation Strategy End To End Process Tracking Dashboard On Cloud Pictures PDF These are perfect for delivering any kind od presentation. Using it, create PowerPoint presentations that communicate your ideas and engage audiences. Save time and effort by using our pre designed presentation templates that are perfect for a wide range of topic. Our vast selection of designs covers a range of styles, from creative to business, and are all highly customizable and easy to edit. Download as a PowerPoint template or use them as Google Slides themes.
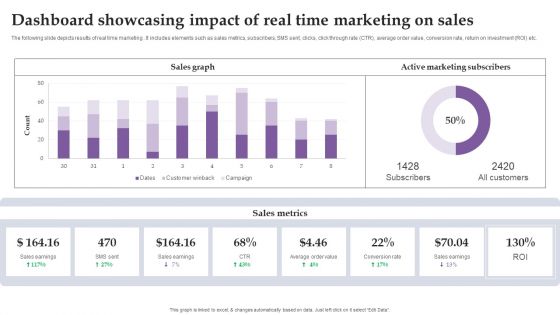
Dashboard Showcasing Impact Of Real Time Marketing On Sales Ppt Gallery Design Templates PDF
The following slide depicts results of real time marketing . It includes elements such as sales metrics, subscribers, SMS sent, clicks, click through rate CTR, average order value, conversion rate, return on investment ROI etc. This modern and well-arranged Dashboard Showcasing Impact Of Real Time Marketing On Sales Ppt Gallery Design Templates PDF provides lots of creative possibilities. It is very simple to customize and edit with the Powerpoint Software. Just drag and drop your pictures into the shapes. All facets of this template can be edited with Powerpoint, no extra software is necessary. Add your own material, put your images in the places assigned for them, adjust the colors, and then you can show your slides to the world, with an animated slide included.

Incorporating Real Time Marketing For Improved Consumer Dashboard Showcasing Impact Of Real Time Sample PDF
The following slide depicts results of real time marketing . It includes elements such as sales metrics, subscribers, SMS sent, clicks, click through rate CTR, average order value, conversion rate, return on investment ROI etc. Are you in need of a template that can accommodate all of your creative concepts This one is crafted professionally and can be altered to fit any style. Use it with Google Slides or PowerPoint. Include striking photographs, symbols, depictions, and other visuals. Fill, move around, or remove text boxes as desired. Test out color palettes and font mixtures. Edit and save your work, or work with colleagues. Download Incorporating Real Time Marketing For Improved Consumer Dashboard Showcasing Impact Of Real Time Sample PDF and observe how to make your presentation outstanding. Give an impeccable presentation to your group and make your presentation unforgettable.

Healthcare Management Overview Trends Stats And Operational Areas Dashboard To Evaluate The Hospital Operations Performance Pictures PDF
The following slide showcases dashboard which can be used by the healthcare professionals to measure the performance of operational department. The KPIs covered in the slide are total patients, operational cost, available staff per division etc. There are so many reasons you need a Healthcare Management Overview Trends Stats And Operational Areas Dashboard To Evaluate The Hospital Operations Performance Pictures PDF. The first reason is you can not spend time making everything from scratch, Thus, Slidegeeks has made presentation templates for you too. You can easily download these templates from our website easily.
Food Processing Industry Latest Insights Trends And Analytics KPI Dashboard For Tracking Supply Chain Costs Demonstration PDF
This slide represents the KPI dashboard to track the multiple cost associated with supply chain in food manufacturing industry. It includes information regarding cash to cash cycle in days, carry cost of inventory along with details of net sales. There are so many reasons you need a Food Processing Industry Latest Insights Trends And Analytics KPI Dashboard For Tracking Supply Chain Costs Demonstration PDF. The first reason is you can not spend time making everything from scratch, Thus, Slidegeeks has made presentation templates for you too. You can easily download these templates from our website easily.
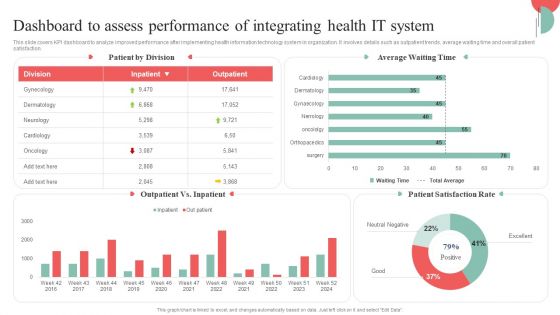
Incorporating HIS To Enhance Healthcare Services Dashboard To Assess Performance Of Integrating Health IT System Diagrams PDF
This slide covers KPI dashboard to analyze improved performance after implementing health information technology system in organization. It involves details such as outpatient trends, average waiting time and overall patient satisfaction. Create an editable Incorporating HIS To Enhance Healthcare Services Dashboard To Assess Performance Of Integrating Health IT System Diagrams PDF that communicates your idea and engages your audience. Whether youre presenting a business or an educational presentation, pre designed presentation templates help save time. Incorporating HIS To Enhance Healthcare Services Dashboard To Assess Performance Of Integrating Health IT System Diagrams PDF is highly customizable and very easy to edit, covering many different styles from creative to business presentations. Slidegeeks has creative team members who have crafted amazing templates. So, go and get them without any delay.
Case Competition Inflated Fuel Price In Logistics Firm Logistics Dashboard For XYZ Logistic Company Product Icons PDF
The slide shows the logistic measurement dashboard for measuring order status, total orders, overdue shipments, global financial performance etc. Deliver and pitch your topic in the best possible manner with this case competition inflated fuel price in logistics firm logistics dashboard for xyz logistic company product icons pdf. Use them to share invaluable insights on overdue to ship, overdue shipments, open pos, late vendor shipments and impress your audience. This template can be altered and modified as per your expectations. So, grab it now.

Building An IT Strategy Plan For Business Expansion Dashboard To Track IT Security Incidents Prevailing Across Firm Infographics PDF
This slide portrays information regarding the dashboard that firm will track various incidents detected. These incidents will be managed in order to avoid security risks. There are so many reasons you need a Building An IT Strategy Plan For Business Expansion Dashboard To Track IT Security Incidents Prevailing Across Firm Infographics PDF. The first reason is you can not spend time making everything from scratch, Thus, Slidegeeks has made presentation templates for you too. You can easily download these templates from our website easily.
Strategies For Successful Customer Base Development In B2b M Commerce B2b Sales Performance Tracking Dashboard Demonstration PDF
This slide represents metric dashboard to track sales performance on e-commerce website. It cover performance indicators such as sales breakdown, order breakdown, recurring sales etc. Make sure to capture your audiences attention in your business displays with our gratis customizable Strategies For Successful Customer Base Development In B2b M Commerce B2b Sales Performance Tracking Dashboard Demonstration PDF. These are great for business strategies, office conferences, capital raising or task suggestions. If you desire to acquire more customers for your tech business and ensure they stay satisfied, create your own sales presentation with these plain slides.
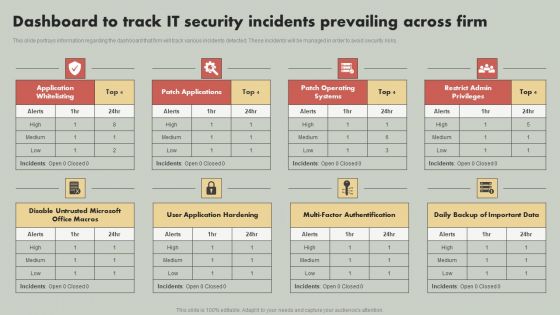
IT Reducing Costs And Management Tips Dashboard To Track IT Security Incidents Prevailing Across Firm Structure PDF
This slide portrays information regarding the dashboard that firm will track various incidents detected. These incidents will be managed in order to avoid security risks. Boost your pitch with our creative IT Reducing Costs And Management Tips Dashboard To Track IT Security Incidents Prevailing Across Firm Structure PDF. Deliver an awe-inspiring pitch that will mesmerize everyone. Using these presentation templates you will surely catch everyones attention. You can browse the ppts collection on our website. We have researchers who are experts at creating the right content for the templates. So you do not have to invest time in any additional work. Just grab the template now and use them.
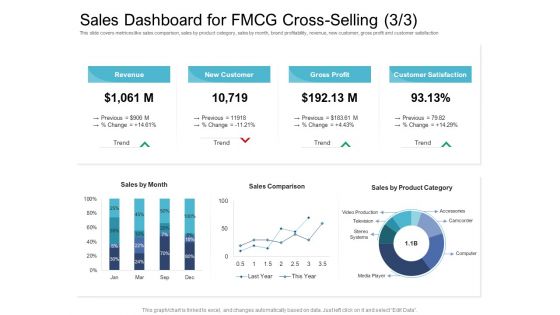
Cross Selling Initiatives For Online And Offline Store Sales Dashboard For FMCG Cross Selling Trend Guidelines PDF
Deliver and pitch your topic in the best possible manner with this cross selling initiatives for online and offline store sales dashboard for fmcg cross selling trend guidelines pdf. Use them to share invaluable insights on revenue, gross profit, customer satisfaction, new customer and impress your audience. This template can be altered and modified as per your expectations. So, grab it now.
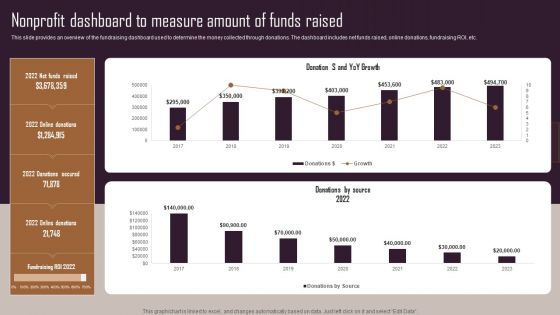
Effective NPO Promotional Strategies For Recruit Volunteers Nonprofit Dashboard To Measure Amount Of Funds Raised Demonstration PDF
This slide provides an overview of the strategies adopted by marketers to reach and attract audience for fundraising. The tactics covered are email, video, social media and event marketing. Create an editable Effective NPO Promotional Strategies For Recruit Volunteers Nonprofit Dashboard To Measure Amount Of Funds Raised Demonstration PDF that communicates your idea and engages your audience. Whether you are presenting a business or an educational presentation, pre-designed presentation templates help save time. Effective NPO Promotional Strategies For Recruit Volunteers Nonprofit Dashboard To Measure Amount Of Funds Raised Demonstration PDF is highly customizable and very easy to edit, covering many different styles from creative to business presentations. Slidegeeks has creative team members who have crafted amazing templates. So, go and get them without any delay.

Adopting Multiple Tactics To Improve Inventory Optimization Dashboard To Track Warehouse Shipments And Operating Cost Template PDF
This slide showcases dashboard that can help organization to track operating cost incurred by organization in different warehousing activities. Its other key elements are - perfect order rate, total shipments by country and on time shipments. Presenting this PowerPoint presentation, titled Adopting Multiple Tactics To Improve Inventory Optimization Dashboard To Track Warehouse Shipments And Operating Cost Template PDF, with topics curated by our researchers after extensive research. This editable presentation is available for immediate download and provides attractive features when used. Download now and captivate your audience. Presenting this Adopting Multiple Tactics To Improve Inventory Optimization Dashboard To Track Warehouse Shipments And Operating Cost Template PDF. Our researchers have carefully researched and created these slides with all aspects taken into consideration. This is a completely customizable Adopting Multiple Tactics To Improve Inventory Optimization Dashboard To Track Warehouse Shipments And Operating Cost Template PDF that is available for immediate downloading. Download now and make an impact on your audience. Highlight the attractive features available with our PPTs.
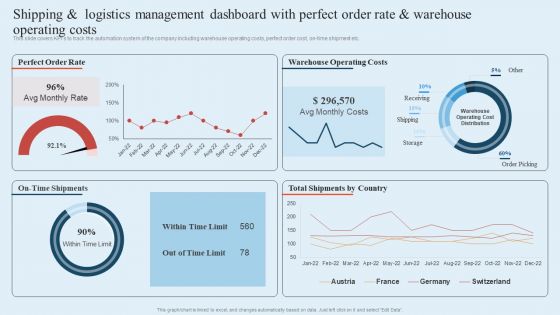
Integrating Logistics Automation Solution Shipping And Logistics Management Dashboard With Perfect Order Rate Ppt Infographics Files PDF
This slide covers KPIs to track the automation system of the company including warehouse operating costs, perfect order cost, on-time shipment etc. Crafting an eye-catching presentation has never been more straightforward. Let your presentation shine with this tasteful yet straightforward Integrating Logistics Automation Solution Shipping And Logistics Management Dashboard With Perfect Order Rate Ppt Infographics Files PDF template. It offers a minimalistic and classy look that is great for making a statement. The colors have been employed intelligently to add a bit of playfulness while still remaining professional. Construct the ideal Integrating Logistics Automation Solution Shipping And Logistics Management Dashboard With Perfect Order Rate Ppt Infographics Files PDF that effortlessly grabs the attention of your audience Begin now and be certain to wow your customers.
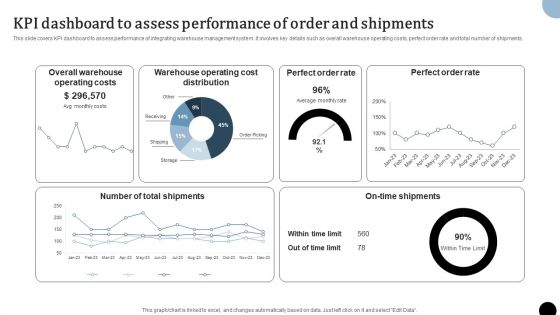
Strategy To Enhance Supply Chain Operations KPI Dashboard To Assess Performance Of Order And Shipments Professional PDF
This slide covers KPI dashboard to assess performance of integrating warehouse management system. It involves key details such as overall warehouse operating costs, perfect order rate and total number of shipments. Slidegeeks has constructed Strategy To Enhance Supply Chain Operations KPI Dashboard To Assess Performance Of Order And Shipments Professional PDF after conducting extensive research and examination. These presentation templates are constantly being generated and modified based on user preferences and critiques from editors. Here, you will find the most attractive templates for a range of purposes while taking into account ratings and remarks from users regarding the content. This is an excellent jumping off point to explore our content and will give new users an insight into our top notch PowerPoint Templates.
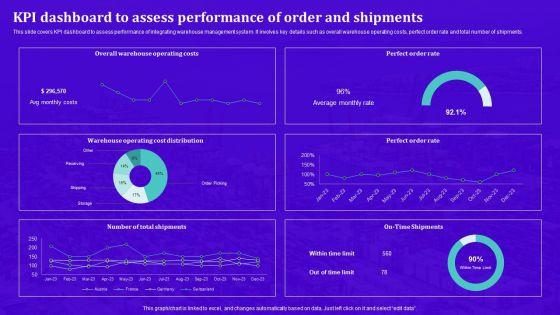
Techniques For Effective Supply Chain Management KPI Dashboard To Assess Performance Of Order And Shipments Structure PDF
This slide covers KPI dashboard to assess performance of integrating warehouse management system. It involves key details such as overall warehouse operating costs, perfect order rate and total number of shipments. Boost your pitch with our creative Techniques For Effective Supply Chain Management KPI Dashboard To Assess Performance Of Order And Shipments Structure PDF. Deliver an awe-inspiring pitch that will mesmerize everyone. Using these presentation templates you will surely catch everyones attention. You can browse the ppts collection on our website. We have researchers who are experts at creating the right content for the templates. So you do not have to invest time in any additional work. Just grab the template now and use them.

SEO Reporting Dashboard To Evaluate Website Rank Performing Mobile SEO Audit To Analyze Web Traffic Inspiration PDF
The purpose of this slide is to outline mobile search engine optimization SEO reporting dashboard. It covers different metrics such as web traffic overview, total views, content overview, goal value and conversion etc. The SEO Reporting Dashboard To Evaluate Website Rank Performing Mobile SEO Audit To Analyze Web Traffic Inspiration PDF is a compilation of the most recent design trends as a series of slides. It is suitable for any subject or industry presentation, containing attractive visuals and photo spots for businesses to clearly express their messages. This template contains a variety of slides for the user to input data, such as structures to contrast two elements, bullet points, and slides for written information. Slidegeeks is prepared to create an impression.
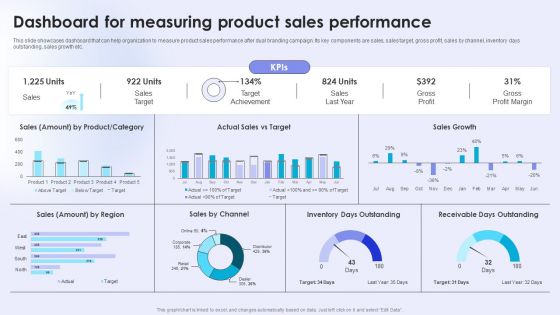
Dual Branding Campaign To Boost Sales Of Product Or Services Dashboard For Measuring Product Sales Elements PDF
This slide showcases dashboard that can help organization to measure product sales performance after dual branding campaign. Its key components are sales, sales target, gross profit, sales by channel, inventory days outstanding, sales growth etc. The Dual Branding Campaign To Boost Sales Of Product Or Services Dashboard For Measuring Product Sales Elements PDF is a compilation of the most recent design trends as a series of slides. It is suitable for any subject or industry presentation, containing attractive visuals and photo spots for businesses to clearly express their messages. This template contains a variety of slides for the user to input data, such as structures to contrast two elements, bullet points, and slides for written information. Slidegeeks is prepared to create an impression.
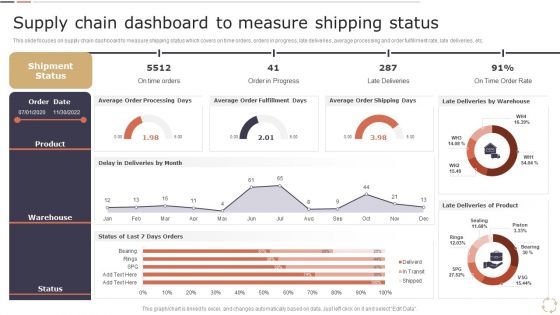
Optimizing Logistics Models To Enhance Supply Chain Management Supply Chain Dashboard To Measure Shipping Status Pictures PDF
This slide focuses on supply chain dashboard to measure shipping status which covers on time orders, orders in progress, late deliveries, average processing and order fulfillment rate, late deliveries, etc. Welcome to our selection of the Optimizing Logistics Models To Enhance Supply Chain Management Supply Chain Dashboard To Measure Shipping Status Pictures PDF. These are designed to help you showcase your creativity and bring your sphere to life. Planning and Innovation are essential for any business that is just starting out. This collection contains the designs that you need for your everyday presentations. All of our PowerPoints are 100 percent editable, so you can customize them to suit your needs. This multi purpose template can be used in various situations. Grab these presentation templates today.

Supply Chain Kpi Dashboard For Effective Financial Analysis Stand Out Digital Supply Chain Tactics Enhancing Graphics PDF
Mentioned slide illustrates KPI dashboard that can be used by managers to assess financial health of supply chain business. KPIs covered are supply chain costs versus sales, cash to order cycle, warehouse operating cost distribution etc.Coming up with a presentation necessitates that the majority of the effort goes into the content and the message you intend to convey. The visuals of a PowerPoint presentation can only be effective if it supplements and supports the story that is being told. Keeping this in mind our experts created Supply Chain Kpi Dashboard For Effective Financial Analysis Stand Out Digital Supply Chain Tactics Enhancing Graphics PDF to reduce the time that goes into designing the presentation. This way, you can concentrate on the message while our designers take care of providing you with the right template for the situation.
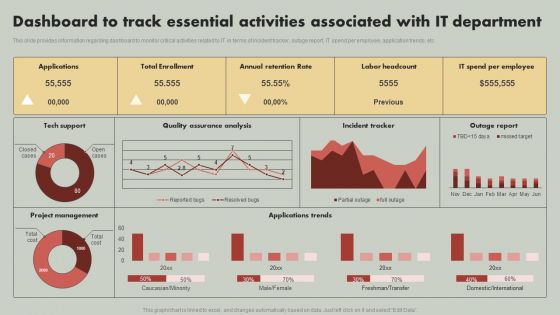
IT Reducing Costs And Management Tips Dashboard To Track Essential Activities Associated With IT Department Summary PDF
This slide provides information regarding dashboard to monitor critical activities related to IT in terms of incident tracker, outage report, IT spend per employee, application trends, etc. Are you in need of a template that can accommodate all of your creative concepts This one is crafted professionally and can be altered to fit any style. Use it with Google Slides or PowerPoint. Include striking photographs, symbols, depictions, and other visuals. Fill, move around, or remove text boxes as desired. Test out color palettes and font mixtures. Edit and save your work, or work with colleagues. Download IT Reducing Costs And Management Tips Dashboard To Track Essential Activities Associated With IT Department Summary PDF and observe how to make your presentation outstanding. Give an impeccable presentation to your group and make your presentation unforgettable.
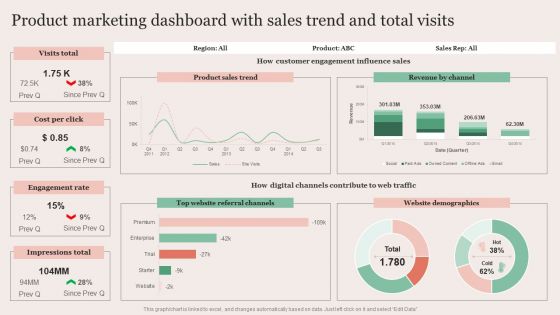
Strategic Brand Promotion For Enhanced Recognition And Revenue Growth Product Marketing Dashboard With Sales Trend Microsoft PDF
Boost your pitch with our creative Strategic Brand Promotion For Enhanced Recognition And Revenue Growth Product Marketing Dashboard With Sales Trend Microsoft PDF. Deliver an awe-inspiring pitch that will mesmerize everyone. Using these presentation templates you will surely catch everyones attention. You can browse the ppts collection on our website. We have researchers who are experts at creating the right content for the templates. So you do not have to invest time in any additional work. Just grab the template now and use them.

Team Forming IT Project Project Management Dashboards Ppt Ideas Clipart PDF
Deliver an awe-inspiring pitch with this creative team forming it project project management dashboards ppt ideas clipart pdf bundle. Topics like project timeline, analysis, development, implement can be discussed with this completely editable template. It is available for immediate download depending on the needs and requirements of the user.
Kpis And Dashboards Vector Icons Ppt Powerpoint Presentation Infographics Outline
This is a kpis and dashboards vector icons ppt powerpoint presentation infographics outline. This is a eight stage process. The stages in this process are dashboard, kpi, metrics.
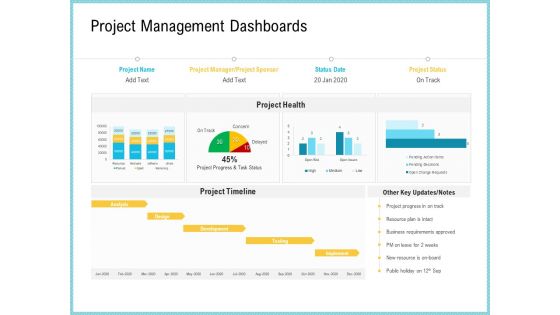
Team Collaboration Of Project Management Dashboards Ppt Inspiration Gallery PDF
Deliver and pitch your topic in the best possible manner with this team collaboration of project management dashboards ppt inspiration gallery pdf. Use them to share invaluable insights on development, analysis, project timeline, business, implement and impress your audience. This template can be altered and modified as per your expectations. So, grab it now.
Reports Dashboards Microservices In Powerpoint And Google Slides Cpb
Presenting our innovatively designed set of slides titled Reports Dashboards Microservices In Powerpoint And Google Slides Cpb. This completely editable PowerPoint graphic exhibits Reports Dashboards Microservices that will help you convey the message impactfully. It can be accessed with Google Slides and is available in both standard screen and widescreen aspect ratios. Apart from this, you can download this well structured PowerPoint template design in different formats like PDF, JPG, and PNG. So, click the download button now to gain full access to this PPT design.
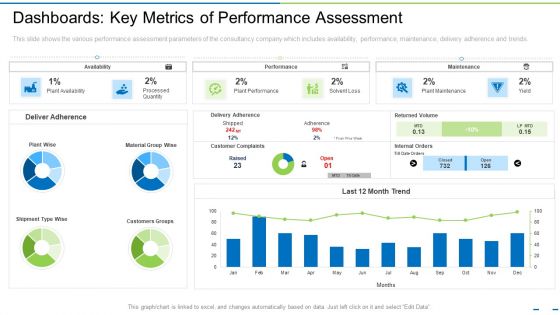
Dashboards Key Metrics Of Performance Assessment Ppt Model Skills PDF
This slide shows the various performance assessment parameters of the consultancy company which includes availability, performance, maintenance, delivery adherence and trends. Deliver and pitch your topic in the best possible manner with this dashboards key metrics of performance assessment ppt model skills pdf. Use them to share invaluable insights on customers groups, performance, customer complaints and impress your audience. This template can be altered and modified as per your expectations. So, grab it now.

Effective Initiation Of Information Technology Project Contd Table Of Contents Themes PDF
This is a effective initiation of information technology project contd table of contents themes pdf template with various stages. Focus and dispense information on eleven stages using this creative set, that comes with editable features. It contains large content boxes to add your information on topics like managing effective communication, project implementation timeline, dashboards to assess project performance. You can also showcase facts, figures, and other relevant content using this PPT layout. Grab it now.

Amusement Event Coordinator Table Of Contents Ppt PowerPoint Presentation Professional Microsoft PDF
Presenting this set of slides with name amusement event coordinator table of contents ppt powerpoint presentation professional microsoft pdf. This is a ten stage process. The stages in this process are introduction, upcoming event, venue logistics, delivery management, asset tracking, event traffic management, choosing appropriate, event package, event timeline, dashboard. This is a completely editable PowerPoint presentation and is available for immediate download. Download now and impress your audience.
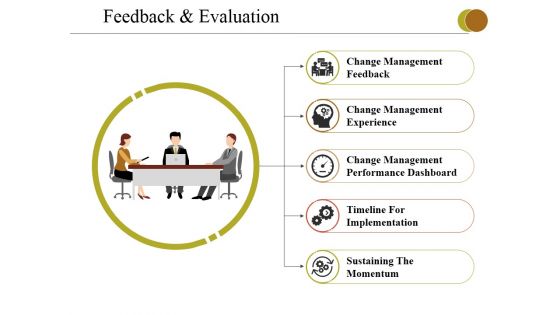
Feedback And Evaluation Ppt PowerPoint Presentation Slides Graphics Example
This is a feedback and evaluation ppt powerpoint presentation slides graphics example. This is a five stage process. The stages in this process are change management feedback, change management experience, change management performance dashboard, timeline for implementation, sustaining the momentum.

Feedback And Evaluation Ppt PowerPoint Presentation File Aids
This is a feedback and evaluation ppt powerpoint presentation file aids. This is a five stage process. The stages in this process are change management feedback , change management experience, change management performance dashboard, timeline for implementation, sustaining the momentum.
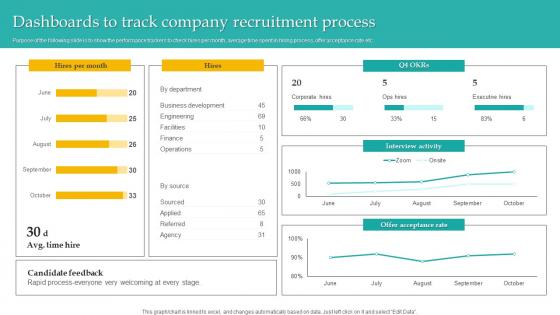
Dashboards To Track Company Administering Diversity And Inclusion At Workplace Mockup Pdf
Purpose of the following slide is to show the performance trackers to check hires per month, average time spent in hiring process, offer acceptance rate etc. From laying roadmaps to briefing everything in detail, our templates are perfect for you. You can set the stage with your presentation slides. All you have to do is download these easy to edit and customizable templates. Dashboards To Track Company Administering Diversity And Inclusion At Workplace Mockup Pdf will help you deliver an outstanding performance that everyone would remember and praise you for. Do download this presentation today.
Sales Lead Tracking Tools Dashboards And Reports Ppt PowerPoint Presentation Model Format
This is a sales lead tracking tools dashboards and reports ppt powerpoint presentation model format. This is a six stage process. The stages in this process are crm sales, crm leads, crm conversion.

Best Practices To Create SAP Cloud Based Business Intelligence Platform Dashboards Summary PDF
This slide includes tips to enhance the overall user experience while making SAP analytics cloud dashboards. It includes tips such as utilize semantic and industry-specific colours, keep visualization clear, group related data, etc. Presenting Best Practices To Create SAP Cloud Based Business Intelligence Platform Dashboards Summary PDF to dispense important information. This template comprises four stages. It also presents valuable insights into the topics including Utilize Semantic Industry Specific, Keep Visualizations Clear, Group Related Data. This is a completely customizable PowerPoint theme that can be put to use immediately. So, download it and address the topic impactfully.

Business Model Of New Consultancy Firm Dashboards Key Metrics Of Performance Assessment Designs PDF
This slide shows the various performance assessment parameters of the consultancy company which includes availability, performance, maintenance, delivery adherence and trends. Deliver an awe inspiring pitch with this creative business model of new consultancy firm dashboards key metrics of performance assessment designs pdf bundle. Topics like availability, performance, maintenance, delivery adherence can be discussed with this completely editable template. It is available for immediate download depending on the needs and requirements of the user.
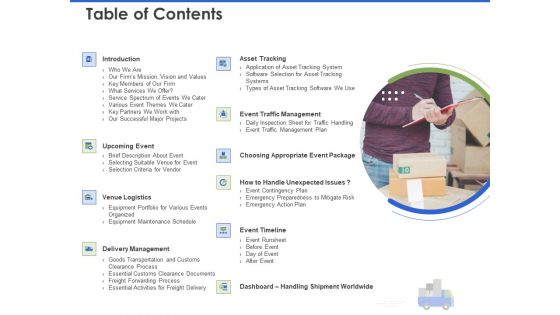
Event Management Services Table Of Contents Ppt PowerPoint Presentation Summary Graphic Tips PDF
This is a event management services table of contents ppt powerpoint presentation summary graphic tips pdf template with various stages. Focus and dispense information on ten stages using this creative set, that comes with editable features. It contains large content boxes to add your information on topics like introduction, upcoming event, venue logistics, delivery management, asset tracking, event traffic management, choosing appropriate event package, how to handle unexpected issues, event timeline, dashboard handling shipment worldwide. You can also showcase facts, figures, and other relevant content using this PPT layout. Grab it now.
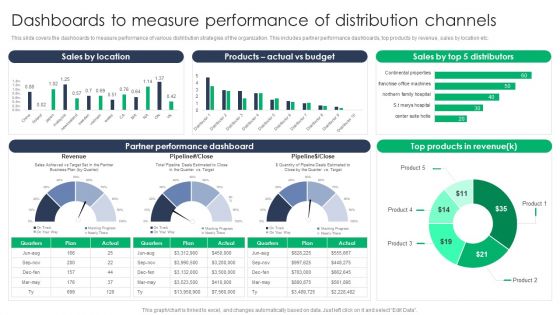
Criterion For Choosing Distribution Channel For Efficient Sales Administration Dashboards To Measure Performance Of Distribution Formats PDF
This slide covers the dashboards to measure performance of various distribution strategies of the organization. This includes partner performance dashboards, top products by revenue, sales by location etc. From laying roadmaps to briefing everything in detail, our templates are perfect for you. You can set the stage with your presentation slides. All you have to do is download these easy-to-edit and customizable templates. Criterion For Choosing Distribution Channel For Efficient Sales Administration Dashboards To Measure Performance Of Distribution Formats PDF will help you deliver an outstanding performance that everyone would remember and praise you for. Do download this presentation today.

Gym Health And Fitness Market Industry Report Content Elements PDF
Presenting this set of slides with name gym health and fitness market industry report content elements pdf. The topics discussed in these slides are industry overview, competitive landscape, return on investment, market segmentation, industry analysis, digital engagement budget, marketing timeline, analytics dashboard, business model. This is a completely editable PowerPoint presentation and is available for immediate download. Download now and impress your audience.

Table Of Remarketing Techniques For Better Customer Conversion Brochure PDF
This is a Table Of Remarketing Techniques For Better Customer Conversion Brochure PDF template with various stages. Focus and dispense information on nine stages using this creative set, that comes with editable features. It contains large content boxes to add your information on topics like Retargeting Campaign, Responsibility Assignment, Campaign Timeline, Tracking Dashboards, KPIS. You can also showcase facts, figures, and other relevant content using this PPT layout. Grab it now.

Global Cyber Terrorism Incidents On The Rise IT Table Of Global Cyber Terrorism Summary PDF
Deliver an awe inspiring pitch with this creative global cyber terrorism incidents on the rise it table of global cyber terrorism summary pdf bundle. Topics like implementation, measures, dashboard, timeline, roadmap can be discussed with this completely editable template. It is available for immediate download depending on the needs and requirements of the user.

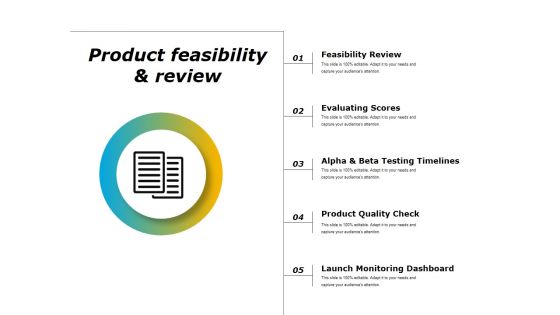
Product Feasibility And Review Ppt PowerPoint Presentation File Slideshow
This is a product feasibility and review ppt powerpoint presentation file slideshow. This is a five stage process. The stages in this process are feasibility review, evaluating scores, alpha and beta testing timelines, product quality check, launch monitoring dashboard.
Product Feasibility And Review Ppt PowerPoint Presentation File Icons
This is a product feasibility and review ppt powerpoint presentation file icons. This is a five stage process. The stages in this process are feasibility review, evaluating scores, alpha and beta testing timelines, product quality check, launch monitoring dashboard.

Product Feasibility And Review Ppt PowerPoint Presentation Model Aids
This is a product feasibility and review ppt powerpoint presentation model aids. This is a five stage process. The stages in this process are feasibility review, evaluating scores, alpha and beta testing timelines, product quality check, launch monitoring dashboard.

Product Feasibility And Review Ppt PowerPoint Presentation Pictures Backgrounds
This is a product feasibility and review ppt powerpoint presentation pictures backgrounds. This is a five stage process. The stages in this process are feasibility review, evaluating scores, alpha and beta testing timelines, product quality check, launch monitoring dashboard.
Product Feasibility And Review Ppt PowerPoint Presentation Infographics Design Inspiration
This is a product feasibility and review ppt powerpoint presentation infographics design inspiration. This is a five stage process. The stages in this process are feasibility review, evaluating scores, alpha and beta testing timelines, product quality check, launch monitoring dashboard.

Product Feasibility And Review Ppt PowerPoint Presentation Portfolio Slide Portrait
This is a product feasibility and review ppt powerpoint presentation portfolio slide portrait. This is a five stage process. The stages in this process are repositioning a product, evaluating scores, alpha and beta testing timelines, product quality check, launch monitoring dashboard.

Quarterly Data Management Roadmap With Monitoring And Reporting Infographics
We present our quarterly data management roadmap with monitoring and reporting infographics. This PowerPoint layout is easy-to-edit so you can change the font size, font type, color, and shape conveniently. In addition to this, the PowerPoint layout is Google Slides compatible, so you can share it with your audience and give them access to edit it. Therefore, download and save this well-researched quarterly data management roadmap with monitoring and reporting infographics in different formats like PDF, PNG, and JPG to smoothly execute your business plan.
Three Months Data Analysis Procedure Roadmap Icons
We present our three months data analysis procedure roadmap icons. This PowerPoint layout is easy to edit so you can change the font size, font type, color, and shape conveniently. In addition to this, the PowerPoint layout is Google Slides compatible, so you can share it with your audience and give them access to edit it. Therefore, download and save this well researched three months data analysis procedure roadmap icons in different formats like PDF, PNG, and JPG to smoothly execute your business plan.

Quarterly Big Data Analysis Strategy Roadmap Infographics
Presenting our jaw-dropping quarterly big data analysis strategy roadmap infographics. You can alternate the color, font size, font type, and shapes of this PPT layout according to your strategic process. This PPT presentation is compatible with Google Slides and is available in both standard screen and widescreen aspect ratios. You can also download this well-researched PowerPoint template design in different formats like PDF, JPG, and PNG. So utilize this visually-appealing design by clicking the download button given below.
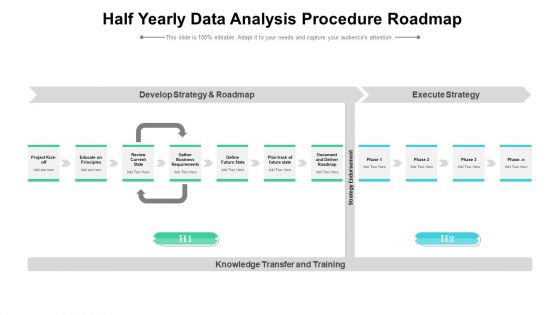
Half Yearly Data Analysis Procedure Roadmap Formats
Presenting our innovatively structured half yearly data analysis procedure roadmap formats Template. Showcase your roadmap process in different formats like PDF, PNG, and JPG by clicking the download button below. This PPT design is available in both Standard Screen and Widescreen aspect ratios. It can also be easily personalized and presented with modified font size, font type, color, and shapes to measure your progress in a clear way.

Six Months Data Analysis Procedure Roadmap Topics
Presenting our innovatively structured six months data analysis procedure roadmap topics Template. Showcase your roadmap process in different formats like PDF, PNG, and JPG by clicking the download button below. This PPT design is available in both Standard Screen and Widescreen aspect ratios. It can also be easily personalized and presented with modified font size, font type, color, and shapes to measure your progress in a clear way.
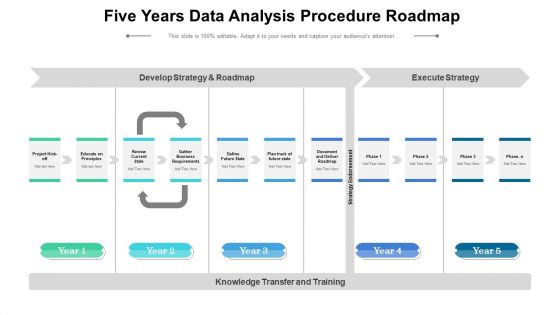
Five Years Data Analysis Procedure Roadmap Infographics
Introducing our five years data analysis procedure roadmap infographics. This PPT presentation is Google Slides compatible, therefore, you can share it easily with the collaborators for measuring the progress. Also, the presentation is available in both standard screen and widescreen aspect ratios. So edit the template design by modifying the font size, font type, color, and shapes as per your requirements. As this PPT design is fully editable it can be presented in PDF, JPG and PNG formats.
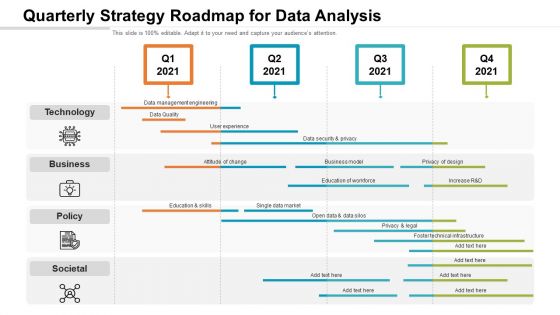
Quarterly Strategy Roadmap For Data Analysis Microsoft
Introducing our quarterly strategy roadmap for data analysis microsoft. This PPT presentation is Google Slides compatible, therefore, you can share it easily with the collaborators for measuring the progress. Also, the presentation is available in both standard screen and widescreen aspect ratios. So edit the template design by modifying the font size, font type, color, and shapes as per your requirements. As this PPT design is fully editable it can be presented in PDF, JPG and PNG formats.

Half Yearly Big Data Analysis Strategy Roadmap Infographics
We present our half yearly big data analysis strategy roadmap infographics. This PowerPoint layout is easy-to-edit so you can change the font size, font type, color, and shape conveniently. In addition to this, the PowerPoint layout is Google Slides compatible, so you can share it with your audience and give them access to edit it. Therefore, download and save this well-researched half yearly big data analysis strategy roadmap infographics in different formats like PDF, PNG, and JPG to smoothly execute your business plan.

3 Months Big Data Analysis Strategy Roadmap Sample
We present our 3 months big data analysis strategy roadmap sample. This PowerPoint layout is easy-to-edit so you can change the font size, font type, color, and shape conveniently. In addition to this, the PowerPoint layout is Google Slides compatible, so you can share it with your audience and give them access to edit it. Therefore, download and save this well-researched 3 months big data analysis strategy roadmap sample in different formats like PDF, PNG, and JPG to smoothly execute your business plan.
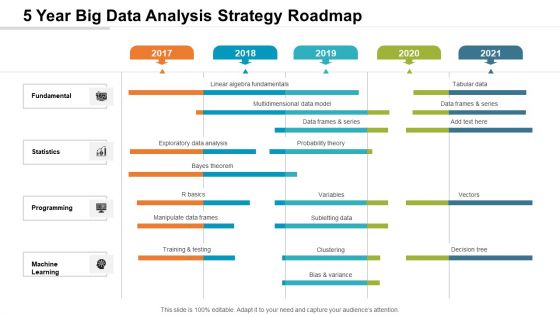
5 Year Big Data Analysis Strategy Roadmap Brochure
We present our 5 year big data analysis strategy roadmap brochure. This PowerPoint layout is easy-to-edit so you can change the font size, font type, color, and shape conveniently. In addition to this, the PowerPoint layout is Google Slides compatible, so you can share it with your audience and give them access to edit it. Therefore, download and save this well-researched 5 year big data analysis strategy roadmap brochure in different formats like PDF, PNG, and JPG to smoothly execute your business plan.
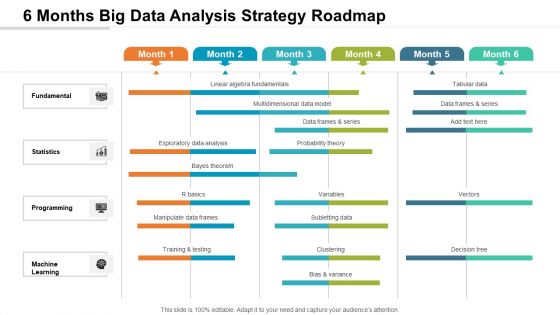
6 Months Big Data Analysis Strategy Roadmap Diagrams
We present our 6 months big data analysis strategy roadmap diagrams. This PowerPoint layout is easy-to-edit so you can change the font size, font type, color, and shape conveniently. In addition to this, the PowerPoint layout is Google Slides compatible, so you can share it with your audience and give them access to edit it. Therefore, download and save this well-researched 6 months big data analysis strategy roadmap diagrams in different formats like PDF, PNG, and JPG to smoothly execute your business plan.

 Home
Home