Survey Infographic
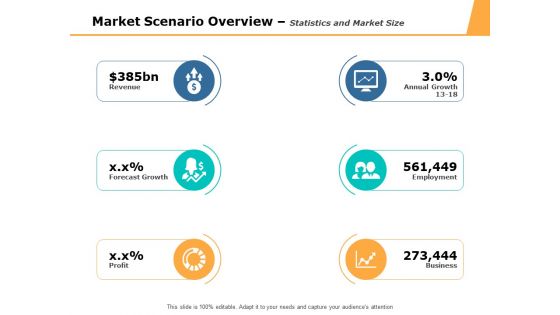
Market Scenario Overview Statistics And Market Size Ppt PowerPoint Presentation Infographic Template Objects
This is a market scenario overview statistics and market size ppt powerpoint presentation infographic template objects. This is a six stage process. The stages in this process are business, management, marketing.

Data Analysis Chart For Funds Management Ppt PowerPoint Presentation Infographic Template Files
This is a data analysis chart for funds management ppt powerpoint presentation infographic template files. This is a five stage process. The stages in this process are financial analysis, quantitative, statistical modelling.
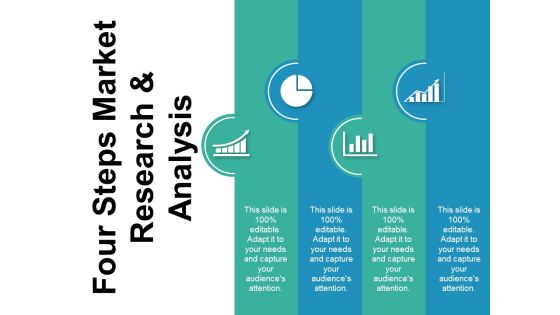
Four Steps Market Reasrch And Analysis Ppt PowerPoint Presentation Infographic Template Maker
This is a four steps market reasrch and analysis ppt powerpoint presentation infographic template maker. This is a four stage process. The stages in this process are metrics icon, kpis icon, statistics icon.
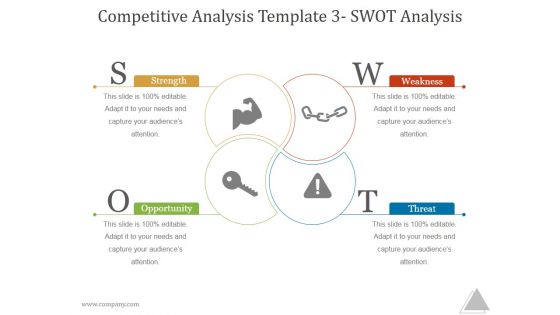
Competitive Analysis Template 3 Swot Analysis Ppt PowerPoint Presentation Infographic Template
This is a competitive analysis template 3 swot analysis ppt powerpoint presentation infographic template. This is a four stage process. The stages in this process are strength, opportunity, weakness, threat.
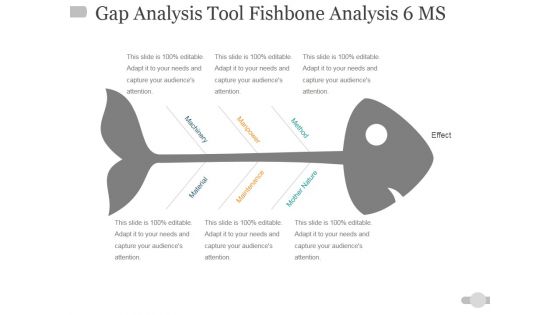
Gap Analysis Tool Fishbone Analysis 6 Ms Ppt PowerPoint Presentation Infographic Template Information
This is a gap analysis tool fishbone analysis 6 ms ppt powerpoint presentation infographic template information. This is a one stage process. The stages in this process are material, maintenance, mother nature, machinery, manpower, method, effect.
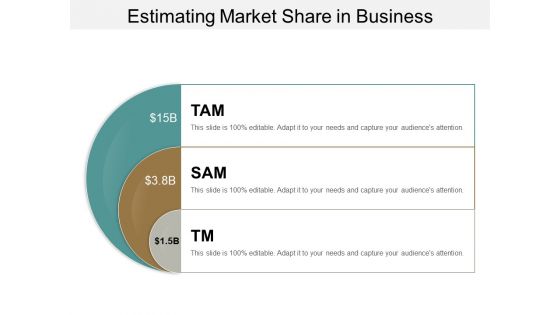
Estimating Market Share In Business Ppt PowerPoint Presentation Infographic Template Introduction
This is a estimating market share in business ppt powerpoint presentation infographic template introduction. This is a three stage process. The stages in this process are market size, market forecast, market potential.
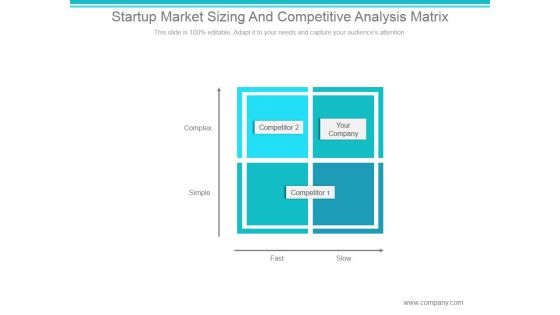
Startup Market Sizing And Competitive Analysis Matrix Ppt PowerPoint Presentation Infographic Template
This is a startup market sizing and competitive analysis matrix ppt powerpoint presentation infographic template. This is a four stage process. The stages in this process are complex, simple, fast, slow, competitor, your company.
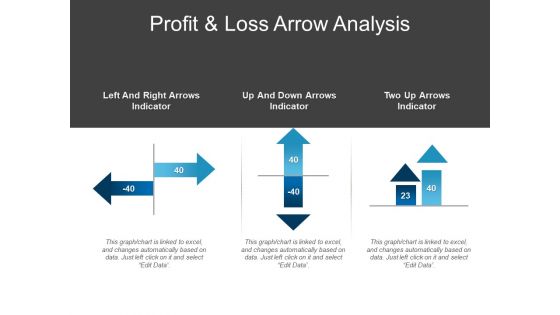
Profit And Loss Arrow Analysis Ppt PowerPoint Presentation Infographic Template Model
This is a profit and loss arrow analysis ppt powerpoint presentation infographic template model. This is a three stage process. The stages in this process are comparison chart, comparison table, comparison matrix.

Competitor Analysis At Broad Level Ppt PowerPoint Presentation Summary Infographic Template
This is a competitor analysis at broad level ppt powerpoint presentation summary infographic template. This is a six stage process. The stages in this process are product quality, main activity, market share, profit, criteria.

Competitive Analysis Report On Key Success Factors Ppt PowerPoint Presentation Infographic Template
This is a competitive analysis report on key success factors ppt powerpoint presentation infographic template. This is a five stage process. The stages in this process are key industry success factors, extensive distribution, customer focus, economies of scale, product innovation.

Production And Operation Cost Analysis Ppt PowerPoint Presentation Infographic Template Display
This is a production and operation cost analysis ppt powerpoint presentation infographic template display. This is a one stage process. The stages in this process are raw materials, labor dependent, equipment dependent, consumables, utilities.
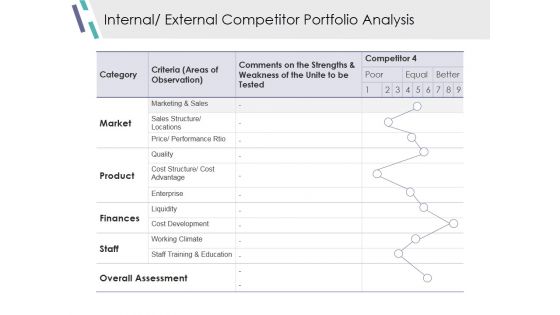
Internal External Competitor Portfolio Analysis Ppt PowerPoint Presentation Model Infographic Template
This is a internal external competitor portfolio analysis ppt powerpoint presentation model infographic template. This is a five stage process. The stages in this process are market, product, finances, staff, overall assessment.
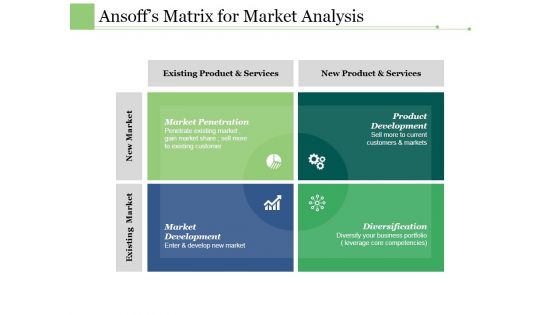
Ansoffs Matrix For Market Analysis Ppt PowerPoint Presentation Layouts Infographic Template
This is a ansoffs matrix for market analysis ppt powerpoint presentation layouts infographic template. This is a four stage process. The stages in this process are market penetration, product development, market development, diversification.
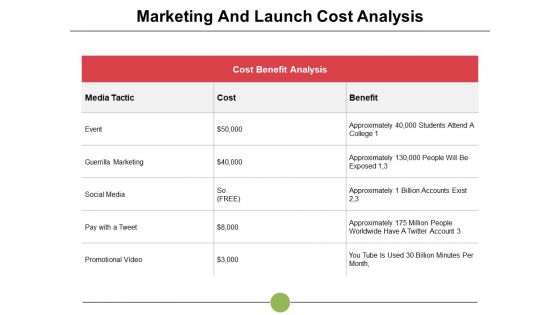
Marketing And Launch Cost Analysis Event Ppt PowerPoint Presentation Infographic Template Show
This is a marketing and launch cost analysis event ppt powerpoint presentation infographic template show. This is a three stage process. The stages in this process are event, marketing, social media, cost analysis, table.

Product Process Patent Investment Analysis Programs Leadership Development Ppt PowerPoint Presentation Infographic Template Shapes
This is a product process patent investment analysis programs leadership development ppt powerpoint presentation infographic template shapes. This is a five stage process. The stages in this process are product process patent, investment analysis programs, leadership development.

Business Trend Analysis Branding Positioning Employee Employer Relationships Ppt PowerPoint Presentation Infographic Template Templates
This is a business trend analysis branding positioning employee employer relationships ppt powerpoint presentation infographic template templates. This is a five stage process. The stages in this process are business trend analysis, branding positioning, employee employer relationships.
Five Stages Classification Analysis Ppt PowerPoint Presentation Infographic Template Slide Download
This is a five stages classification analysis ppt powerpoint presentation infographic template slide download. This is a five stage process. The stages in this process are cluster analysis, cluster examination, cluster investigation.
Market Trend Analysis Ppt PowerPoint Presentation Infographic Template Master Slide Cpb
This is a market trend analysis ppt powerpoint presentation infographic template master slide cpb. This is a six stage process. The stages in this process are market trend analysis.
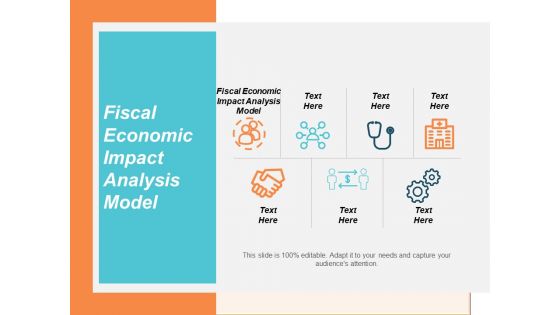
Fiscal Economic Impact Analysis Model Ppt PowerPoint Presentation Ideas Infographic Template Cpb
This is a fiscal economic impact analysis model ppt powerpoint presentation ideas infographic template cpb. This is a seven stage process. The stages in this process are fiscal economic impact analysis model.

Business Plan Summary Identification And Analysis Ppt Powerpoint Presentation Infographic Template Portfolio
This is a business plan summary identification and analysis ppt powerpoint presentation infographic template portfolio. This is a five stage process. The stages in this process are executive summary, analysis summary, review summary.

Data Analysis Process Reviews And Comparison Of Factors Ppt PowerPoint Presentation Infographic Template Graphics Template
This is a data analysis process reviews and comparison of factors ppt powerpoint presentation infographic template graphics template. This is a seven stage process. The stages in this process are data analysis, data review, data evaluation.
Report Icon Audit And Analysis Ppt PowerPoint Presentation Portfolio Infographic Template
This is a report icon audit and analysis ppt powerpoint presentation portfolio infographic template. This is a four stage process. The stages in this process are document review, document analysis, document evaluation.
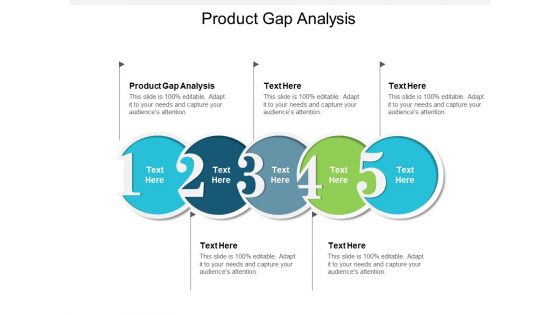
Product Gap Analysis Ppt PowerPoint Presentation Infographic Template Slide Portrait Cpb
This is a product gap analysis ppt powerpoint presentation infographic template slide portrait cpb. This is a five stage process. The stages in this process are product gap analysis.
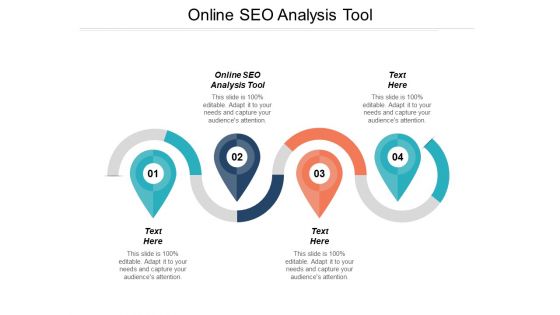
Online Seo Analysis Tool Ppt PowerPoint Presentation Infographic Template Slides Cpb
This is a online seo analysis tool ppt powerpoint presentation infographic template slides cpb. This is a four stage process. The stages in this process are online seo analysis tool.

Strength Weakness Opportunity And Threat Analysis Infographic Layout Ppt PowerPoint Presentation Layouts
This is a strength weakness opportunity and threat analysis infographic layout ppt powerpoint presentation layouts. This is a four stage process. The stages in this process are due diligence, value gap analysis, value maximization process.

Strategic Planning Analysis Recruitment And Selection Ppt Powerpoint Presentation Infographic Template Templates
This is a strategic planning analysis recruitment and selection ppt powerpoint presentation infographic template templates. This is a four stage process. The stages in this process are human resources management, hr swot, human resources swot analysis.

Circular Diagram To Show Phases Of Big Data Analysis Ppt PowerPoint Presentation Infographic Template
This is a circular diagram to show phases of big data analysis ppt powerpoint presentation infographic template. This is a five stage process. The stages in this process are big data, icons, management, strategy, business.
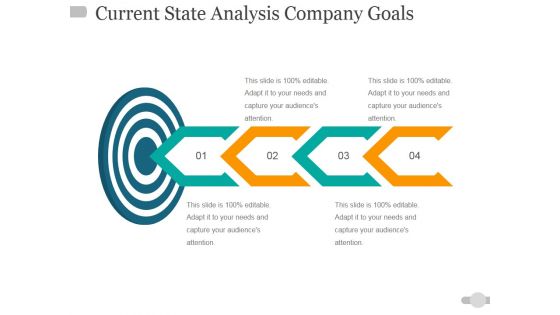
Current State Analysis Company Goals Ppt PowerPoint Presentation Infographic Template Rules
This is a current state analysis company goals ppt powerpoint presentation infographic template rules. This is a four stage process. The stages in this process are business, arrow, target, strategy, competition, marketing, success.
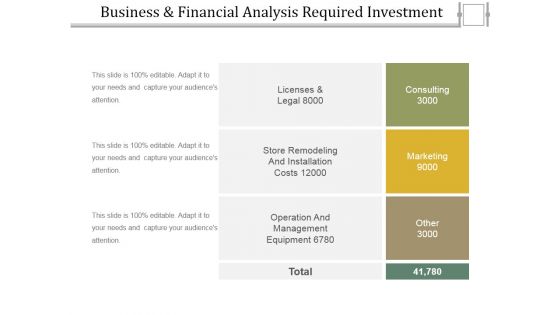
Business And Financial Analysis Required Investment Ppt PowerPoint Presentation Infographic Template Templates
This is a business and financial analysis required investment ppt powerpoint presentation infographic template templates. This is a three stage process. The stages in this process are consulting, marketing, other.

Risk Tolerance Analysis Template 1 Ppt Powerpoint Presentation File Infographic Template
This is a risk tolerance analysis template 1 ppt powerpoint presentation file infographic template. This is a three stage process. The stages in this process are dashboard, marketing, measure, business.

Risk Tolerance Analysis Template 2 Ppt PowerPoint Presentation Infographic Template Picture
This is a risk tolerance analysis template 2 ppt powerpoint presentation infographic template picture. This is a two stage process. The stages in this process are low level, high level, compare.

Workforce Gap Analysis Results Ppt PowerPoint Presentation Infographic Template Graphics Tutorials
This is a workforce gap analysis results ppt powerpoint presentation infographic template graphics tutorials. This is a five stage process. The stages in this process are staff type, current, required, gap, ratio.
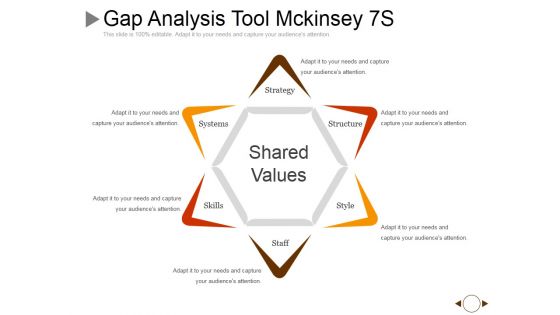
Gap Analysis Tool Mckinsey 7S Ppt PowerPoint Presentation Infographic Template Example
This is a gap analysis tool mckinsey 7s ppt powerpoint presentation infographic template example. This is a six stage process. The stages in this process are strategy, structure, style, staff, skills.
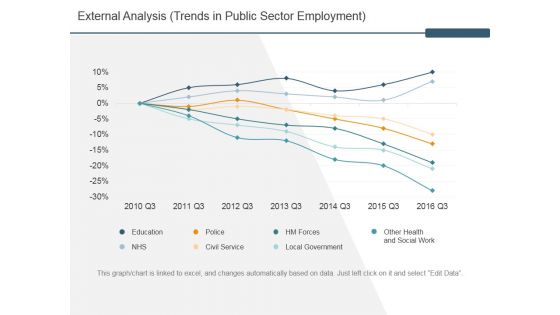
External Analysis Trends In Public Sector Employment Ppt PowerPoint Presentation Infographic Template Clipart Images
This is a external analysis trends in public sector employment ppt powerpoint presentation infographic template clipart images. This is a two stage process. The stages in this process are ethnicity, gender, other, black, hispanic.
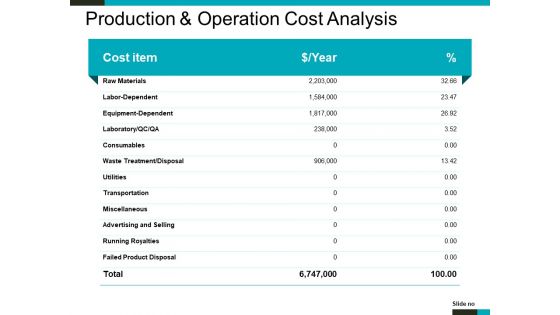
Production And Operation Cost Analysis Ppt PowerPoint Presentation Infographic Template Graphics
This is a production and operation cost analysis ppt powerpoint presentation infographic template graphics. This is a three stage process. The stages in this process are raw materials, consumables, utilities, transportation, miscellaneous.

Risk Analysis Simplified Format Ppt PowerPoint Presentation Infographic Template Slide Download
This is a risk analysis simplified format ppt powerpoint presentation infographic template slide download. This is a three stage process. The stages in this process are likelihood of risk item occurring, priority, risk items.
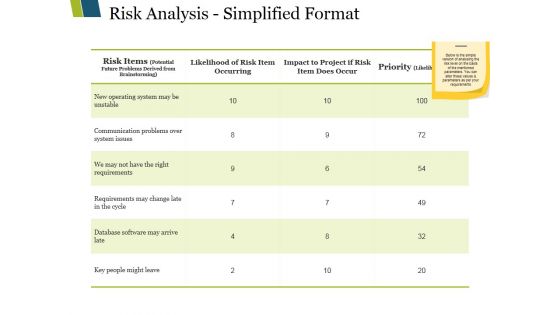
Risk Analysis Simplified Format Ppt PowerPoint Presentation Infographic Template Graphics Template
This is a risk analysis simplified format ppt powerpoint presentation infographic template graphics template. This is a three stage process. The stages in this process are likelihood of risk item occurring, impact to project if risk item does occur, priority.
Master Budget Vs Actual Variance Analysis Template 2 Ppt PowerPoint Presentation Infographic Template Icon
This is a master budget vs actual variance analysis template 2 ppt powerpoint presentation infographic template icon. This is a two stage process. The stages in this process are variable costs, variances, actual, budget, insurance.
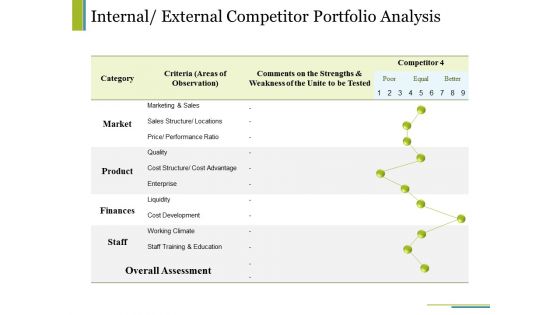
Internal External Competitor Portfolio Analysis Ppt PowerPoint Presentation Infographic Template Example
This is a internal external competitor portfolio analysis ppt powerpoint presentation infographic template example. This is a three stage process. The stages in this process are market, product, finances, staff, category.

Master Budget Vs Actual Variance Analysis Ppt PowerPoint Presentation Infographic Template Graphics Template
This is a master budget vs actual variance analysis ppt powerpoint presentation infographic template graphics template. This is a three stage process. The stages in this process are quarterly budget, actual, variances.
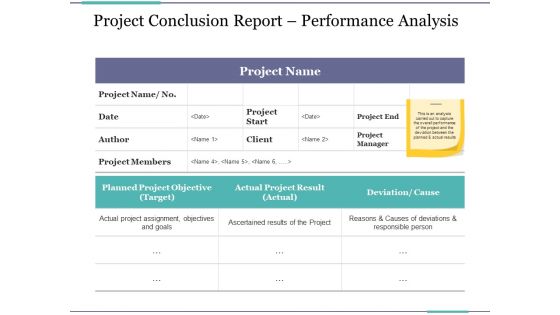
Project Conclusion Report Performance Analysis Ppt PowerPoint Presentation Infographic Template Files
This is a project conclusion report performance analysis ppt powerpoint presentation infographic template files. This is a two stage process. The stages in this process are business, marketing, author, project manager, planned project objective.
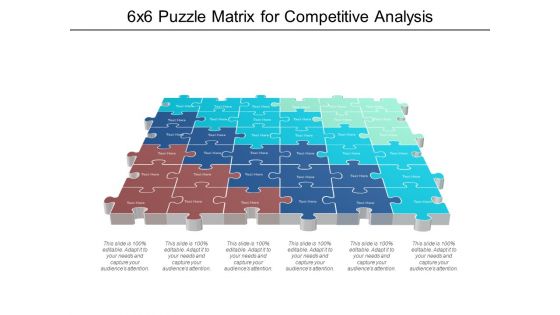
6X6 Puzzle Matrix For Competitive Analysis Ppt PowerPoint Presentation Infographic Template Format
This is a 6x6 puzzle matrix for competitive analysis ppt powerpoint presentation infographic template format. This is a six stage process. The stages in this process are 2x2 matrix, 2x2 table.

Effective Facilitation For Business Analysis Custom End To End Requirements Ppt Powerpoint Presentation Infographic Template Inspiration
This is a effective facilitation for business analysis custom end to end requirements ppt powerpoint presentation infographic template inspiration. This is a eight stage process. The stages in this process are business requirements, business needs, company requirements, organization requirements.
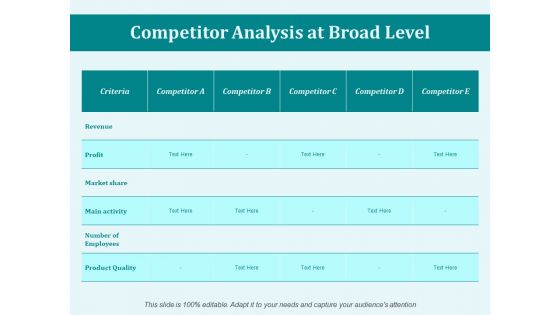
Competitor Analysis At Broad Level Ppt PowerPoint Presentation Infographic Template Example
This is a competitor analysis at broad level ppt powerpoint presentation infographic template example. This is a six stage process. The stages in this process are business, management, marketing, compare.

Year End Performance Analysis Economic Development And Growth Ppt PowerPoint Presentation Infographic Template Shapes
This is a year end performance analysis economic development and growth ppt powerpoint presentation infographic template shapes. This is a seven stage process. The stages in this process are year in review, yearly highlights, countdowns.

Four Concentric Circles For Social Media Audience Analysis Ppt PowerPoint Presentation Infographic Template Graphics
This is a Four Concentric Circles For Social Media Audience Analysis Ppt PowerPoint Presentation Infographic Template Graphics. This is a stage process. The stages in this process are 7 concentric circles, 7 circular cycle, 7 circular diagram.
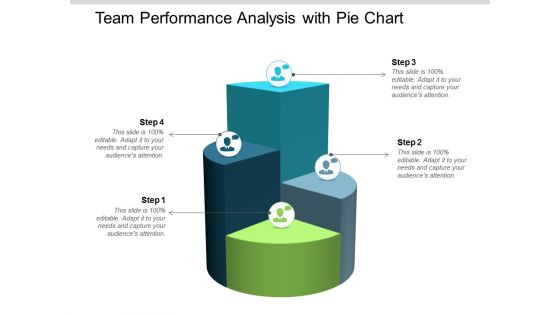
Team Performance Analysis With Pie Chart Ppt Powerpoint Presentation Infographic Template Slideshow
This is a team performance analysis with pie chart ppt powerpoint presentation infographic template slideshow. This is a four stage process. The stages in this process are team performance, member performance, group performance.

Before And After Project Analysis Ppt PowerPoint Presentation Infographic Template Topics
This is a before and after project analysis ppt powerpoint presentation infographic template topics. This is a two stage process. The stages in this process are before vs after, comparison, compare.

Business Operations Management Transformation Architecture Process Analysis Ppt Powerpoint Presentation Infographic Template Show
This is a business operations management transformation architecture process analysis ppt powerpoint presentation infographic template show. This is a five stage process. The stages in this process are context diagram, context shapes, context visuals.

Funnel Analysis Finding And Fixing Conversions Ppt PowerPoint Presentation Infographic Template Good
This is a funnel analysis finding and fixing conversions ppt powerpoint presentation infographic template good. This is a four stage process. The stages in this process are leaky funnel, dripping funnel, holed funnel.
Portfolio Analysis Icons Slide Business Ppt PowerPoint Presentation Infographic Template Influencers
This is a portfolio analysis icons slide business ppt powerpoint presentation infographic template influencers. The topics discussed in this diagram are business, marketing, management, icons. This is a completely editable PowerPoint presentation, and is available for immediate download.
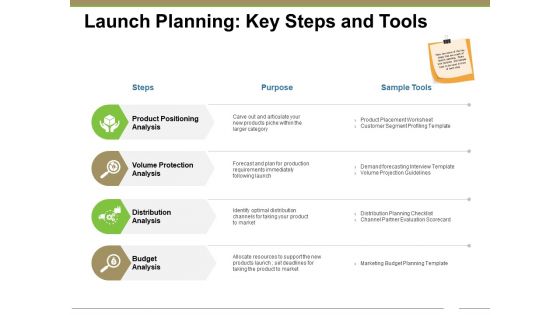
Launch Planning Key Steps And Tools Ppt PowerPoint Presentation Infographic Template Inspiration
This is a launch planning key steps and tools ppt powerpoint presentation infographic template inspiration. This is a four stage process. The stages in this process are product positioning analysis, volume protection analysis, distribution analysis, budget analysis, business.
Laptop With Gears Software Testing Ppt PowerPoint Presentation Infographic Template Sample
This is a laptop with gears software testing ppt powerpoint presentation infographic template sample. This is a two stage process. The stages in this process are metrics icon, kpis icon, statistics icon.
Seven Steps Of Business Workflow With Icons Ppt PowerPoint Presentation Infographic Template Diagrams
This is a seven steps of business workflow with icons ppt powerpoint presentation infographic template diagrams. This is a seven stage process. The stages in this process are metrics icon, kpis icon, statistics icon.
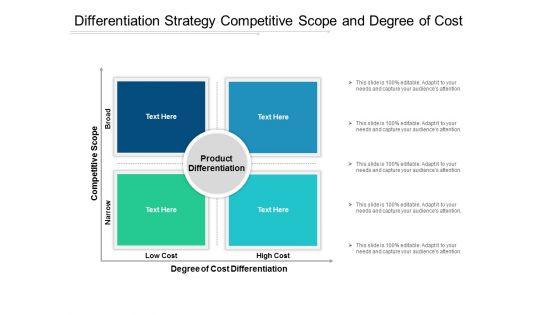
Differentiation Strategy Competitive Scope And Degree Of Cost Ppt Powerpoint Presentation Pictures Infographic Template
This is a differentiation strategy competitive scope and degree of cost ppt powerpoint presentation pictures infographic template. This is a four stage process. The stages in this process are competitive analysis, product differentiation, product competition.
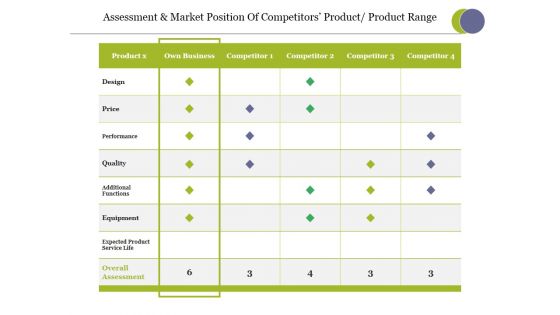
Assessment And Market Position Of Competitors Product Product Range Ppt PowerPoint Presentation Infographic Template Summary
This is a assessment and market position of competitors product product range ppt powerpoint presentation infographic template summary. This is a four stage process. The stages in this process are design, price, performance, quality, additional functions, equipment.
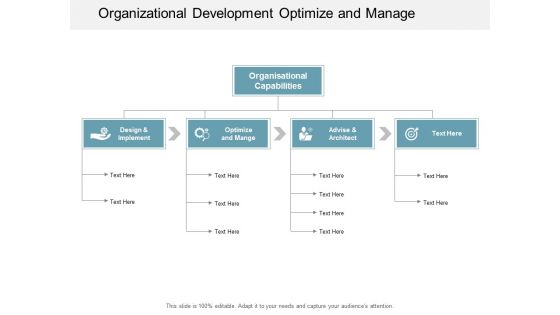
Organizational Development Optimize And Manage Ppt Powerpoint Presentation Infographic Template Inspiration
This is a organizational development optimize and manage ppt powerpoint presentation infographic template inspiration. This is a five stage process. The stages in this process are potential, capabilities, ability.
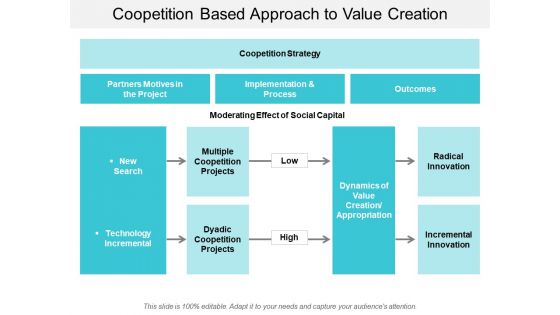
Coopetition Based Approach To Value Creation Ppt Powerpoint Presentation Infographic Template Smartart
This is a coopetition based approach to value creation ppt powerpoint presentation infographic template smartart. This is a three stage process. The stages in this process are co opetition, coopertition, cooperative competition.
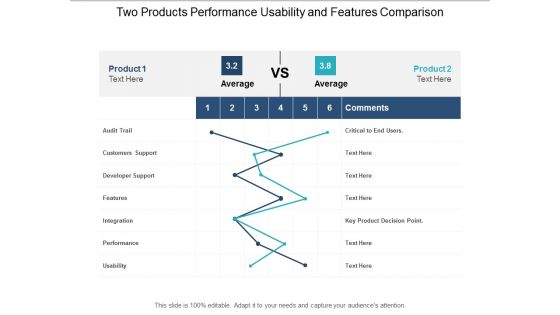
Two Products Performance Usability And Features Comparison Ppt Powerpoint Presentation Infographic Template Portrait
This is a two products performance usability and features comparison ppt powerpoint presentation infographic template portrait. This is a two stage process. The stages in this process are product differentiation, product comparison, brand differentiation.

Donut Chart Infographic For Percentage Ratio Analysis Ppt PowerPoint Presentation File Graphics Example PDF
Persuade your audience using this donut chart infographic for percentage ratio analysis ppt powerpoint presentation file graphics example pdf. This PPT design covers four stages, thus making it a great tool to use. It also caters to a variety of topics including donut chart infographic for percentage ratio analysis. Download this PPT design now to present a convincing pitch that not only emphasizes the topic but also showcases your presentation skills.

 Home
Home