Survey Infographic
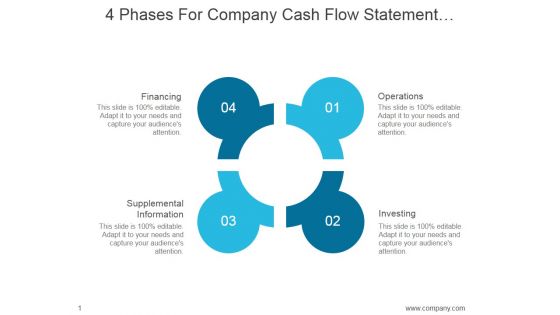
4 Phases For Company Cash Flow Statement Interpretation Ppt PowerPoint Presentation Infographics
This is a 4 phases for company cash flow statement interpretation ppt powerpoint presentation infographics. This is a four stage process. The stages in this process are business, goal, target, business, plan.

How The Marketing Mix Evolves Over Time Ppt PowerPoint Presentation Infographics
This is a how the marketing mix evolves over time ppt powerpoint presentation infographics. This is a six stage process. The stages in this process are post war, uncertain, soaring, one to one, turbulent, financially driven.

Dollar Coins On Human Hand Money Saving Vector Ppt PowerPoint Presentation Slides Infographics
This is a dollar coins on human hand money saving vector ppt powerpoint presentation slides infographics. This is a four stage process. The stages in this process are liquidity, cash assets, solvency.

What Do I Bring To The Table Ppt PowerPoint Presentation Show Infographics
This is a what do i bring to the table ppt powerpoint presentation show infographics. This is a eight stage process. The stages in this process are business, strategy, marketing, analysis.

Qualitative Description Of Human Experience Task Time Distance Ppt PowerPoint Presentation Visual Aids Infographics
This is a qualitative description of human experience task time distance ppt powerpoint presentation visual aids infographics. This is a five stage process. The stages in this process are analysis, observation, qualitative.
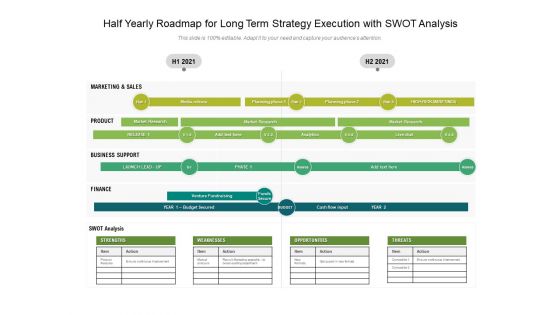
Half Yearly Roadmap For Long Term Strategy Execution With Swot Analysis Infographics
Presenting the half yearly roadmap for long term strategy execution with swot analysis infographics. The template includes a roadmap that can be used to initiate a strategic plan. Not only this, the PowerPoint slideshow is completely editable and you can effortlessly modify the font size, font type, and shapes according to your needs. This PPT slide can be easily reached in standard screen and widescreen aspect ratios. The set is also available in various formats like PDF, PNG, and JPG. So download and use it multiple times as per your knowledge.

Business Research Model For Strategy Formulation Ppt PowerPoint Presentation Slides Infographics
Presenting this set of slides with name business research model for strategy formulation ppt powerpoint presentation slides infographics. This is a five stage process. The stages in this process are due diligence, market analysis, competitive benchmarking, internal analysis, technology assessment, strategy formulation. This is a completely editable PowerPoint presentation and is available for immediate download. Download now and impress your audience.

ROI On Digital Marketing Social Media Ppt PowerPoint Presentation Professional Infographics
Presenting this set of slides with name roi on digital marketing social media ppt powerpoint presentation professional infographics. The topics discussed in these slides are finance, marketing, management, investment, analysis. This is a completely editable PowerPoint presentation and is available for immediate download. Download now and impress your audience.

Target Customer Analysis Evaluating Target Market Size For Global Expansion Infographics PDF
This slide showcases evaluation of target market size for expanding globally into foreign market. It can help to identify the potential of target market for launching new product or service. Do you have to make sure that everyone on your team knows about any specific topic I yes, then you should give Target Market, Expected To Grow, 2023 To 2026 a try. Our experts have put a lot of knowledge and effort into creating this impeccable Target Market, Expected To Grow, 2023 To 2026. You can use this template for your upcoming presentations, as the slides are perfect to represent even the tiniest detail. You can download these templates from the Slidegeeks website and these are easy to edit. So grab these today.

Table Of Contents For In Depth Campaigning Guide For Sport Brand Infographics PDF
Do you have an important presentation coming up Are you looking for something that will make your presentation stand out from the rest Look no further than Sports Team And Brand Engagement Tracking Dashboard In Depth Campaigning Guide Diagrams PDF With our professional designs, you can trust that your presentation will pop and make delivering it a smooth process. And with Slidegeeks, you can trust that your presentation will be unique and memorable. So why wait Grab Sports Team And Brand Engagement Tracking Dashboard In Depth Campaigning Guide Diagrams PDF today and make your presentation stand out from the rest
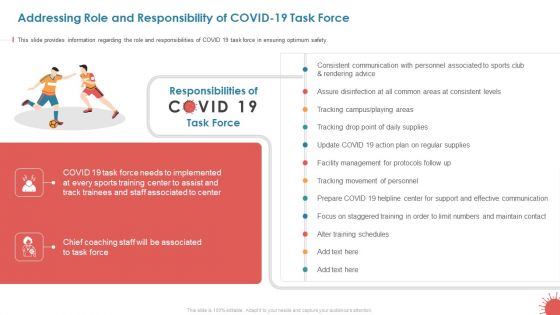
Business Survival Accommodation Addressing Role And Responsibility Of COVID 19 Task Force Infographics PDF
This slide provides information regarding the role and responsibilities of COVID 19 task force in ensuring optimum safety. Deliver and pitch your topic in the best possible manner with this business survival accommodation addressing role and responsibility of covid 19 task force themes pdf. Use them to share invaluable insights on consistent, communication, personnel and impress your audience. This template can be altered and modified as per your expectations. So, grab it now.
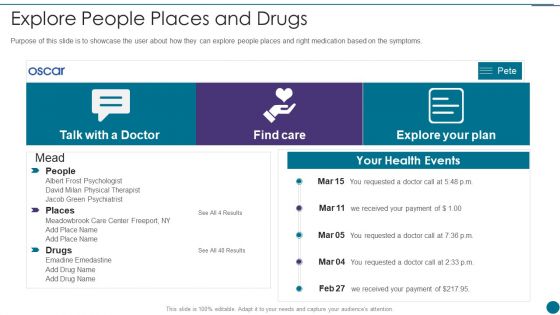
Oscar Capital Raising Pitch Deck Find Care For You Oscar Pitch Deck Infographics PDF
Purpose of this slide is to showcase the user about how they can explore people places and right medication based on the symptoms. Deliver an awe inspiring pitch with this creative oscar capital raising pitch deck explore people places and drugs portrait pdf bundle. Topics like explore people places and drugs can be discussed with this completely editable template. It is available for immediate download depending on the needs and requirements of the user.

Strategies To Deploy Diversity In Workplace Employee Resource Group Framework For Diversity And Inclusion Infographics PDF
This slide depicts the framework for employee resource group for organizational diversity and inclusion providing information regarding purpose and outcomes. Present like a pro with Devise Formal Governance, Integrate Business Focus, Promote Linkages Create beautiful presentations together with your team, using our easy touse presentation slides. Share your ideas in real time and make changes on the fly by downloading our templates. So whether youre in the office, on the go, or in a remote location, you can stay in sync with your team and present your ideas with confidence. With Slidegeeks presentation got a whole lot easier. Grab these presentations today.
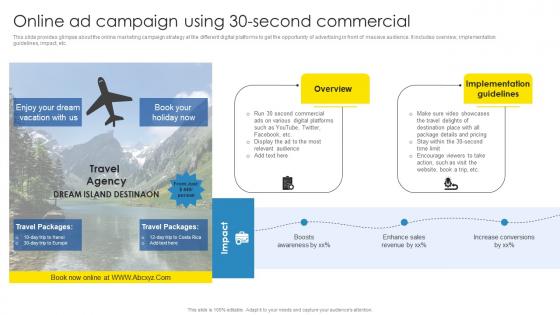
Strategic Marketing Plan Online Ad Campaign Using 30 Second Commercial Infographics Pdf
This slide provides glimpse about summary of international travel business for understanding its growing market and utilizing the opportunities. It includes CAGR, growth drivers, global players, etc. Do you know about Slidesgeeks Strategic Marketing Plan Multiple Strategies For Local Event Sponsorships Ideas Pdf These are perfect for delivering any kind od presentation. Using it, create PowerPoint presentations that communicate your ideas and engage audiences. Save time and effort by using our pre-designed presentation templates that are perfect for a wide range of topic. Our vast selection of designs covers a range of styles, from creative to business, and are all highly customizable and easy to edit. Download as a PowerPoint template or use them as Google Slides themes.

SHRM Talent Management Guide Handbook For Enterprise Define Job Roles And Responsibilities Infographics PDF
Once the hiring manager has identified the total number of vacancies in the organization, it is required for them to define the job roles and responsibilities that can help in shortlisting ideal candidate for the profile. Slidegeeks is one of the best resources for PowerPoint templates. You can download easily and regulate SHRM Talent Management Guide Handbook For Enterprise Define Job Roles And Responsibilities Guidelines PDF Icons PDF for your personal presentations from our wonderful collection. A few clicks is all it takes to discover and get the most relevant and appropriate templates. Use our Templates to add a unique zing and appeal to your presentation and meetings. All the slides are easy to edit and you can use them even for advertisement purposes.
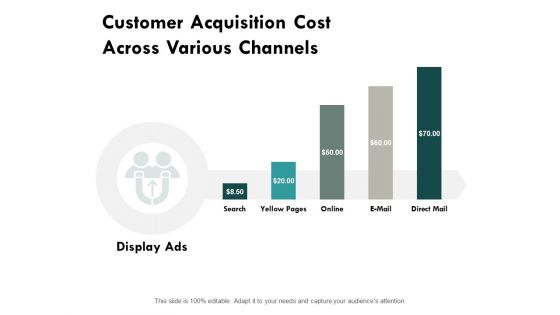
Customer Acquisition Cost Across Various Channels Ppt PowerPoint Presentation Ideas Infographics
This is a customer acquisition tools marketing ppt powerpoint presentation icon microsoft. This is a thee stage process. The stages in this process are finance, marketing, analysis, investment, million.
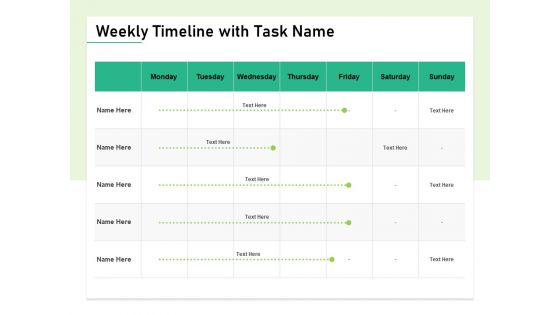
Quality Management Plan QMP Weekly Timeline With Task Name Infographics PDF
Manage your complex projects and organize them simultaneously with this detailed Gantt Chart PowerPoint Template. Track your milestones, tasks, phases, activities, subtasks amongst other constituents that will give you an updated visual of your project. Reflect your planning horizon and capture your release plan in one view with this Gantt Chart PowerPoint presentation template. You can plot various dependencies directly on this Timeline PowerPoint Presentation Layout to see which tasks are still in the pipeline and how the delays in them are impacting the schedules and deadlines of the project. Apart from this, you can also share this updated visual with your team members and stakeholders, thus making it a resourceful tool to be incorporated in your business structure. Not only this but also the editable layout of this slide helps you to add your data and statistics at your convenience.
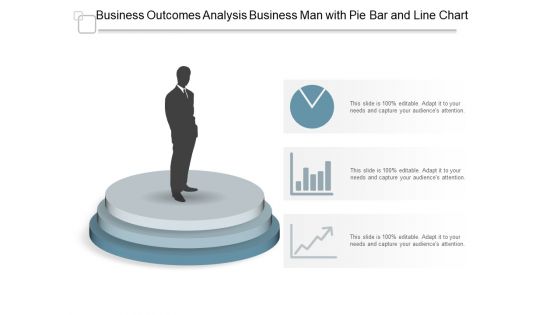
Business Outcomes Analysis Business Man With Pie Bar And Line Chart Ppt Powerpoint Presentation Infographics Visual Aids
This is a business outcomes analysis business man with pie bar and line chart ppt powerpoint presentation infographics visual aids. This is a three stage process. The stages in this process are business outcomes, business results, business output.
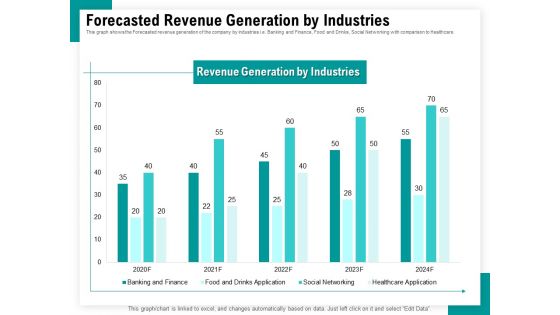
Android Framework For Apps Development And Deployment Forecasted Revenue Generation By Industries Ppt Infographics Example Introduction PDF
Presenting this set of slides with name android framework for apps development and deployment forecasted revenue generation by industries ppt infographics example introduction pdf. The topics discussed in these slides are banking and finance, food and drinks application, social networking, healthcare application. This is a completely editable PowerPoint presentation and is available for immediate download. Download now and impress your audience.

Global Cyber Terrorism Incidents On The Rise IT Checklist To Deal With Cyber Terrorism Threats Infographics PDF
This slide represents the checklist to deal with cyber-terrorism threats which involve 24 7 monitoring, employee training, keeping software updated. This is a global cyber terrorism incidents on the rise it checklist to deal with cyber terrorism threats infographics pdf template with various stages. Focus and dispense information on nine stages using this creative set, that comes with editable features. It contains large content boxes to add your information on topics like employee training, monitoring, cyber security assessment, incident response plan, limited access privileges. You can also showcase facts, figures, and other relevant content using this PPT layout. Grab it now.

Proactive Consumer Solution And How To Perform It Checklist To Align Business Service Delivery With Kpis Infographics PDF
This slide define the checklists and guidelines to align business service delivery with KPIs and it includes defining KPIs, KPI discussion, IT culture development and integration of KPIs to consolidated dashboards.This is a Proactive Consumer Solution And How To Perform It Checklist To Align Business Service Delivery With Kpis Infographics PDF template with various stages. Focus and dispense information on six stages using this creative set, that comes with editable features. It contains large content boxes to add your information on topics like Kpi Discussions, Develop It Culture, Consolidated Dashboards. You can also showcase facts, figures, and other relevant content using this PPT layout. Grab it now.
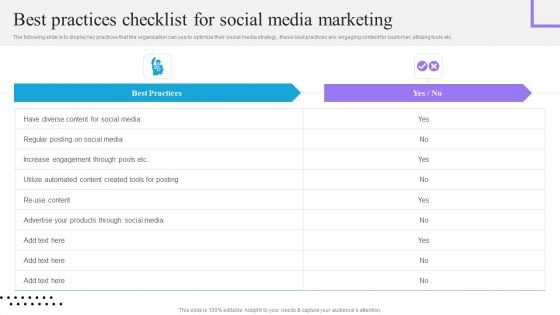
Content And Permission Marketing Tactics For Enhancing Business Best Practices Checklist For Social Media Marketing Infographics PDF
The following slide is to display key practices that the organization can use to optimize their social media strategy., these best practices are engaging content for customer, utilizing tools etc. Boost your pitch with our creative Content And Permission Marketing Tactics For Enhancing Business Best Practices Checklist For Social Media Marketing Infographics PDF. Deliver an awe-inspiring pitch that will mesmerize everyone. Using these presentation templates you will surely catch everyones attention. You can browse the ppts collection on our website. We have researchers who are experts at creating the right content for the templates. So you dont have to invest time in any additional work. Just grab the template now and use them.
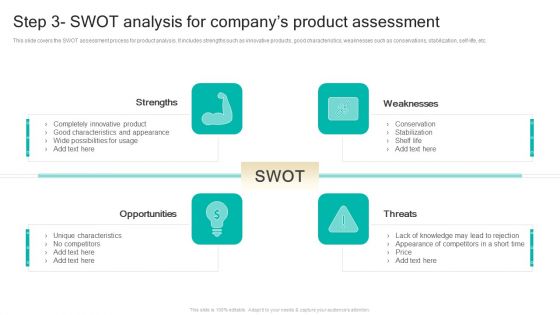
Procedure To Develop Effective Product Step 3 Swot Analysis For Companys Product Assessment Ppt Infographics Summary PDF
This slide covers the SWOT assessment process for product analysis. It includes strengths such as innovative products, good characteristics, weaknesses such as conservations, stabilization, self-life, etc. Presenting this PowerPoint presentation, titled Procedure To Develop Effective Product Step 3 Swot Analysis For Companys Product Assessment Ppt Infographics Summary PDF, with topics curated by our researchers after extensive research. This editable presentation is available for immediate download and provides attractive features when used. Download now and captivate your audience. Presenting this Procedure To Develop Effective Product Step 3 Swot Analysis For Companys Product Assessment Ppt Infographics Summary PDF. Our researchers have carefully researched and created these slides with all aspects taken into consideration. This is a completely customizable Procedure To Develop Effective Product Step 3 Swot Analysis For Companys Product Assessment Ppt Infographics Summary PDF that is available for immediate downloading. Download now and make an impact on your audience. Highlight the attractive features available with our PPTs.
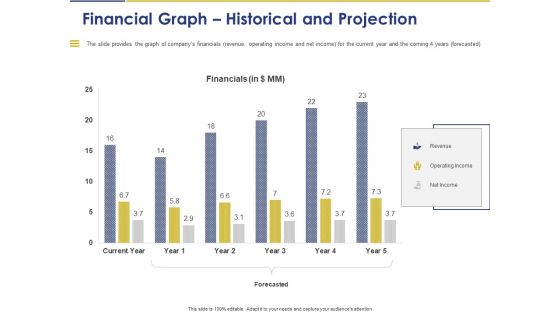
Convertible Note Pitch Deck Funding Strategy Financial Graph Historical And Projection Ppt PowerPoint Presentation Infographics Layouts PDF
Presenting this set of slides with name convertible note pitch deck funding strategy financial graph historical and projection ppt powerpoint presentation infographics layouts pdf. The topics discussed in these slides are financials, revenue, operating income, net income, forecasted. This is a completely editable PowerPoint presentation and is available for immediate download. Download now and impress your audience.
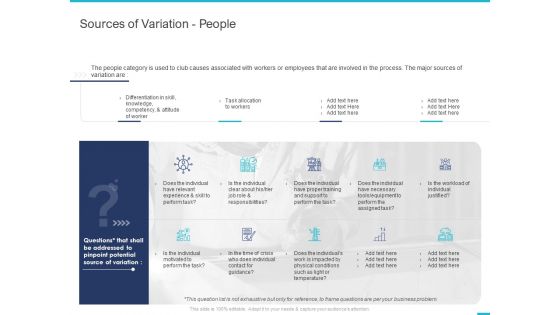
Fishbone Ishikawa Cause And Effect Analysis Sources Of Variation People Ppt PowerPoint Presentation Infographics Designs Download PDF
Presenting this set of slides with name fishbone ishikawa cause and effect analysis sources of variation people ppt powerpoint presentation infographics designs download pdf. The topics discussed in these slides are skill, knowledge, attitude worker, individual justified, equipment. This is a completely editable PowerPoint presentation and is available for immediate download. Download now and impress your audience.
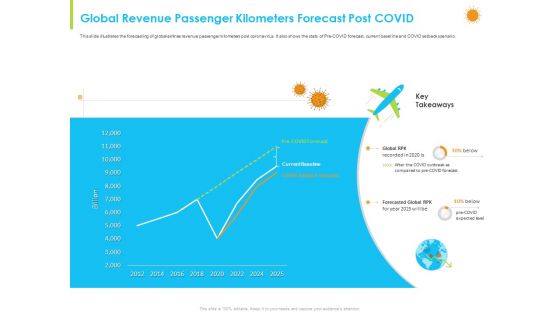
How Aviation Industry Coping With COVID 19 Pandemic Global Revenue Passenger Kilometers Forecast Post COVID Infographics PDF
This slide illustrates the forecasting of global airlines revenue passenger kilometers post coronavirus. It also shows the stats of Pre-COVID forecast, current baseline and COVID setback scenario.Deliver and pitch your topic in the best possible manner with this how aviation industry coping with COVID 19 pandemic global revenue passenger kilometers forecast post COVID infographics pdf. Use them to share invaluable insights on forecasted global, 2012 to 2025 and impress your audience. This template can be altered and modified as per your expectations. So, grab it now.

Investor Pitch Deck To Generate Capital From Initial Currency Offering Number Of Subscribers Historical And Forecasted Infographics PDF
The slide provides the table of End Subscribers historical and forecasted on the basis of various factors including churn rate, new addition of subscribers, cancelled subscription etc. Deliver and pitch your topic in the best possible manner with this investor pitch deck to generate capital from initial currency offering number of subscribers historical and forecasted infographics pdf. Use them to share invaluable insights on cancelled subscriptions, retention rate, end subscribers and impress your audience. This template can be altered and modified as per your expectations. So, grab it now.
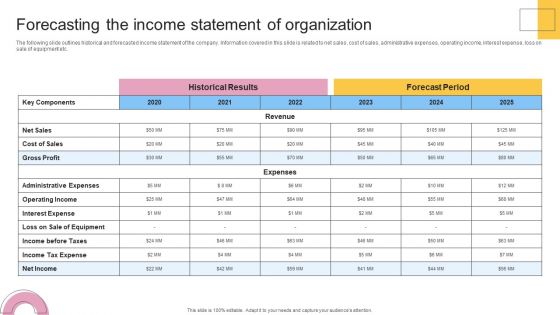
Financial Planning And Examination Plan For Small And Large Enterprises Forecasting The Income Statement Of Organization Infographics PDF
The following slide outlines historical and forecasted income statement of the company. Information covered in this slide is related to net sales, cost of sales, administrative expenses, operating income, interest expense, loss on sale of equipment etc. There are so many reasons you need a Financial Planning And Examination Plan For Small And Large Enterprises Forecasting The Income Statement Of Organization Infographics PDF. The first reason is you can not spend time making everything from scratch, Thus, Slidegeeks has made presentation templates for you too. You can easily download these templates from our website easily.
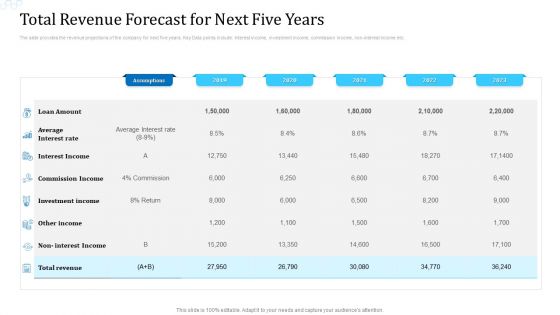
Investor Deck For Procuring Funds From Money Market Total Revenue Forecast For Next Five Years Infographics PDF
The slide provides the revenue projections of the company for next five years. Key Data points include Interest income, investment income, commission income, non interest income etc. Deliver an awe inspiring pitch with this creative investor deck for procuring funds from money market total revenue forecast for next five years infographics pdf bundle. Topics like commission income, investment income, interest income can be discussed with this completely editable template. It is available for immediate download depending on the needs and requirements of the user.

Funding Deck To Raise Grant Funds From Public Organizations Table Of Content Strategies Ppt Infographics Gridlines PDF
This is a funding deck to raise grant funds from public organizations table of content strategies ppt infographics gridlines pdf template with various stages. Focus and dispense information on forteen stages using this creative set, that comes with editable features. It contains large content boxes to add your information on topics like growth strategies, product sales, cash flow statement, shareholder structure, financials forecast of income. You can also showcase facts, figures, and other relevant content using this PPT layout. Grab it now.

Fishbone Ishikawa Cause And Effect Analysis Why Use Cause And Effect Analysis Ppt PowerPoint Presentation Infographics Graphics Design PDF
Presenting this set of slides with name fishbone ishikawa cause and effect analysis why use cause and effect analysis ppt powerpoint presentation infographics graphics design pdf. This is a five stage process. The stages in this process are provides broader, clearer and logical picture, encourage brainstorming, focusing causes, symptoms, ensure maintenance, team focus, common problem, helpful depth analysis. This is a completely editable PowerPoint presentation and is available for immediate download. Download now and impress your audience.

Customer Retention With Email Advertising Campaign Plan Yearly New Offer Launch To Drive Business Sales Infographics PDF
Mentioned slide demonstrates new offer launched by business on yearly basis along with declining website traffic. It includes key components related to number of offered provided to customers, offer details, and reasons of declining website traffic. Are you searching for a Customer Retention With Email Advertising Campaign Plan Yearly New Offer Launch To Drive Business Sales Infographics PDF that is uncluttered, straightforward, and original Its easy to edit, and you can change the colors to suit your personal or business branding. For a presentation that expresses how much effort you have put in, this template is ideal. With all of its features, including tables, diagrams, statistics, and lists, its perfect for a business plan presentation. Make your ideas more appealing with these professional slides. Download Customer Retention With Email Advertising Campaign Plan Yearly New Offer Launch To Drive Business Sales Infographics PDF from Slidegeeks today.
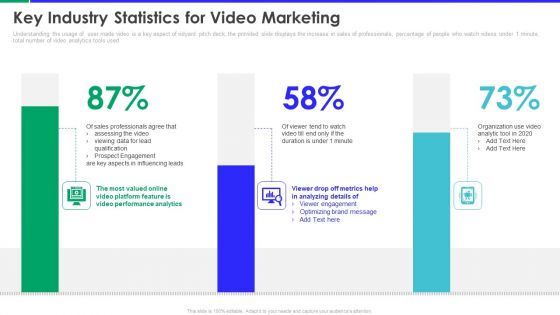
Vidyard Investor Capital Funding Elevator Pitch Deck Key Industry Statistics For Video Marketing Infographics PDF Mockup PDF
Understanding the usage of user made video is a key aspect of vidyard pitch deck, the provided slide displays the increase in sales of professionals, percentage of people who watch videos under 1 minute, total number of video analytics tools used. Deliver and pitch your topic in the best possible manner with this vidyard investor capital funding elevator pitch deck key industry statistics for video marketing infographics pdf mockup pdf. Use them to share invaluable insights on key industry statistics for video marketing and impress your audience. This template can be altered and modified as per your expectations. So, grab it now.

Detailed Analysis Of Red Ocean Vs Blue Ocean Approach Four Step Blue Ocean Leadership Process Infographics PDF
This template cover blue ocean leadership that involves a four-step process. It enables leaders to understand what adjustments are required to bring out the best in their employees Formulating a presentation can take up a lot of effort and time, so the content and message should always be the primary focus. The visuals of the PowerPoint can enhance the presenters message, so our Detailed Analysis Of Red Ocean Vs Blue Ocean Approach Four Step Blue Ocean Leadership Process Infographics PDF was created to help save time. Instead of worrying about the design, the presenter can concentrate on the message while our designers work on creating the ideal templates for whatever situation is needed. Slidegeeks has experts for everything from amazing designs to valuable content, we have put everything into Detailed Analysis Of Red Ocean Vs Blue Ocean Approach Four Step Blue Ocean Leadership Process Infographics PDF
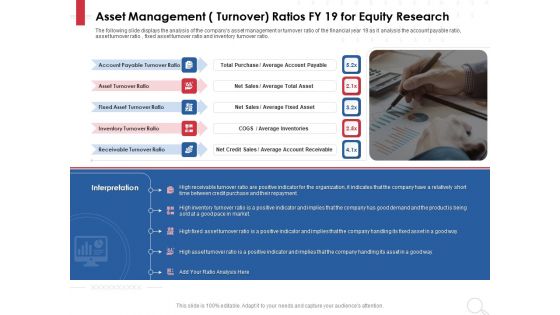
Equity Analysis Project Asset Management Turnover Ratios FY 19 For Equity Research Ppt PowerPoint Presentation Infographics Guide PDF
Presenting this set of slides with name equity analysis project asset management turnover ratios fy 19 for equity research ppt powerpoint presentation infographics guide pdf. This is a five stage process. The stages in this process are account payable turnover ratio, asset turnover ratio, fixed asset turnover ratio, inventory turnover ratio, receivable turnover ratio, net sales. This is a completely editable PowerPoint presentation and is available for immediate download. Download now and impress your audience.
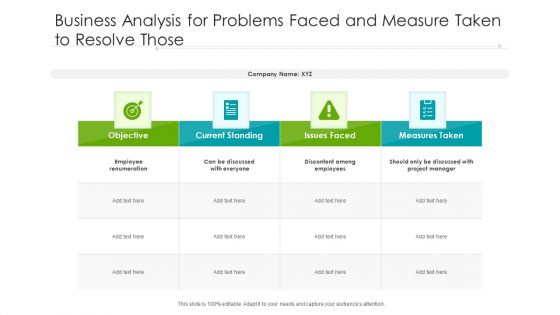
Business Analysis For Problems Faced And Measure Taken To Resolve Those Ppt PowerPoint Presentation Infographics Example PDF
Pitch your topic with ease and precision using this business analysis for problems faced and measure taken to resolve those ppt powerpoint presentation infographics example pdf. This layout presents information on current standing, measures taken, employee renumeration. It is also available for immediate download and adjustment. So, changes can be made in the color, design, graphics or any other component to create a unique layout.

5 Step Guide For Transitioning To Blue Ocean Strategy What Value Innovation How Create It In Blue Infographics PDF
This template covers introduction of value innovation. It is a process in which a company introduces new technologies or upgrades that are designed to achieve both product differentiation and low costs. Crafting an eye-catching presentation has never been more straightforward. Let your presentation shine with this tasteful yet straightforward 5 Step Guide For Transitioning To Blue Ocean Strategy What Value Innovation How Create It In Blue Infographics PDF template. It offers a minimalistic and classy look that is great for making a statement. The colors have been employed intelligently to add a bit of playfulness while still remaining professional. Construct the ideal 5 Step Guide For Transitioning To Blue Ocean Strategy What Value Innovation How Create It In Blue Infographics PDF that effortlessly grabs the attention of your audience Begin now and be certain to wow your customers
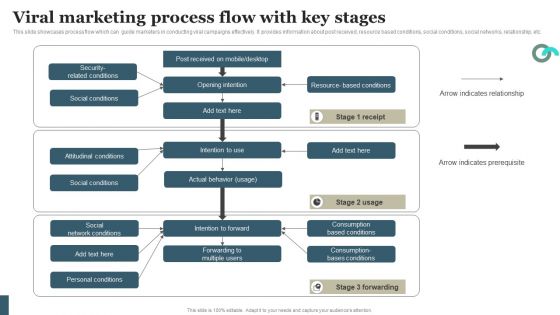
Viral Marketing Techniques To Increase Annual Business Sales Viral Marketing Process Flow With Key Stages Infographics PDF
This slide showcases process flow which can guide marketers in conducting viral campaigns effectively. It provides information about post received, resource based conditions, social conditions, social networks, relationship, etc. Whether you have daily or monthly meetings, a brilliant presentation is necessary. Viral Marketing Techniques To Increase Annual Business Sales Viral Marketing Process Flow With Key Stages Infographics PDF can be your best option for delivering a presentation. Represent everything in detail using Viral Marketing Techniques To Increase Annual Business Sales Viral Marketing Process Flow With Key Stages Infographics PDF and make yourself stand out in meetings. The template is versatile and follows a structure that will cater to your requirements. All the templates prepared by Slidegeeks are easy to download and edit. Our research experts have taken care of the corporate themes as well. So, give it a try and see the results.
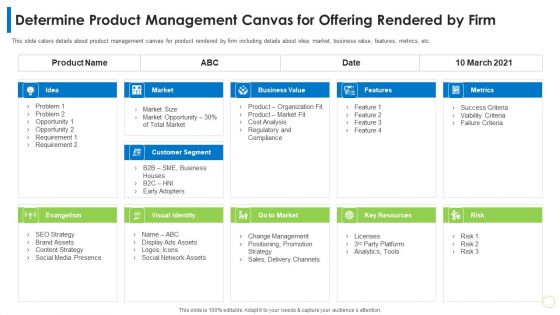
Pitch Deck PPT For Commodity Determine Product Management Canvas For Offering Rendered By Firm Ppt Infographics Topics PDF
This slide caters details about product management canvas for product rendered by firm including details about idea, market, business value, features, metrics, etc. Deliver an awe inspiring pitch with this creative pitch deck ppt for commodity determine product management canvas for offering rendered by firm ppt infographics topics pdf bundle. Topics like idea, market, business value, metrics, customer segment can be discussed with this completely editable template. It is available for immediate download depending on the needs and requirements of the user.

Investor Pitch Deck To Generate Capital From Pre Seed Round Revenue Vs Operational Expenses Projections Infographics PDF
The slide provides the graph of forecasted revenue and total cost of the company in next five years. It also shows the breakeven point. Deliver an awe inspiring pitch with this creative investor pitch deck to generate capital from pre seed round revenue vs operational expenses projections infographics pdf bundle. Topics like revenue vs operational expenses projections can be discussed with this completely editable template. It is available for immediate download depending on the needs and requirements of the user.

Food Providing Services Catering Plan Of Action For Food Providing Services Ppt PowerPoint Presentation Infographics Structure PDF
Presenting this set of slides with name food providing services catering plan of action for food providing services ppt powerpoint presentation infographics structure pdf. The topics discussed in these slides are create taste menu, scout location, prepare task require, set up arrangements includes decoration, food and other set up services, checklist tasks, performed during, actual event. This is a completely editable PowerPoint presentation and is available for immediate download. Download now and impress your audience.

Ml And Big Data In Information Technology Processes Cost Of Artificial Intelligence In IT Operations Infographics PDF
The following slide highlights the various providers AIOPs providers, the provided table highlights various metrics such as data collection, data analysis, automated reaction, data visualization and the price Do you have to make sure that everyone on your team knows about any specific topic I yes, then you should give Ml And Big Data In Information Technology Processes Cost Of Artificial Intelligence In IT Operations Infographics PDF a try. Our experts have put a lot of knowledge and effort into creating this impeccable Ml And Big Data In Information Technology Processes Cost Of Artificial Intelligence In IT Operations Infographics PDF. You can use this template for your upcoming presentations, as the slides are perfect to represent even the tiniest detail. You can download these templates from the Slidegeeks website and these are easy to edit. So grab these today.
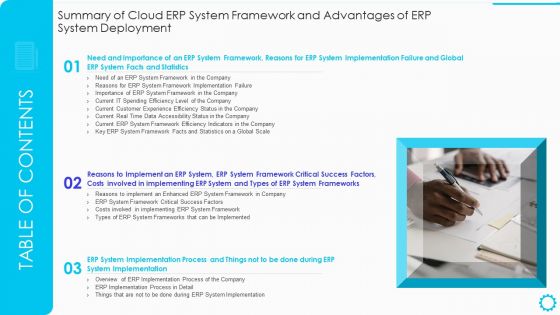
Table Of Contents Summary Of Cloud Erp System Framework And Advantages Of Erp System Deployment Contd Demonstration PDF Infographics PDF
This is a Table Of Contents Summary Of Cloud Erp System Framework And Advantages Of Erp System Deployment Contd Demonstration PDF Infographics PDF template with various stages. Focus and dispense information on three stages using this creative set, that comes with editable features. It contains large content boxes to add your information on topics like Need And Importance, System Facts And Statistics, Reasons To Implement. You can also showcase facts, figures, and other relevant content using this PPT layout. Grab it now.
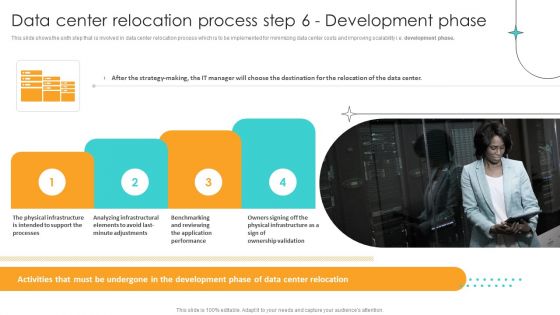
Cost Saving Benefits Of Implementing Data Center Data Center Relocation Process Step 6 Development Phase Infographics PDF
This slide shows the sixth step that is involved in data center relocation process which is to be implemented for minimizing data center costs and improving scalability i.e. development phase. Crafting an eye catching presentation has never been more straightforward. Let your presentation shine with this tasteful yet straightforward Cost Saving Benefits Of Implementing Data Center Data Center Relocation Process Step 6 Development Phase Infographics PDF template. It offers a minimalistic and classy look that is great for making a statement. The colors have been employed intelligently to add a bit of playfulness while still remaining professional. Construct the ideal Cost Saving Benefits Of Implementing Data Center Data Center Relocation Process Step 6 Development Phase Infographics PDF that effortlessly grabs the attention of your audience Begin now and be certain to wow your customers.
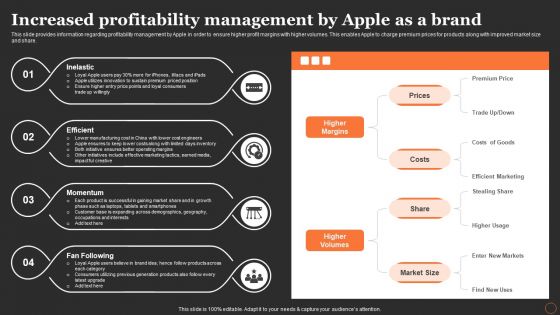
Apples Strategy To Achieve Top Brand Value Position Increased Profitability Management By Apple As A Brand Infographics PDF

Global Financial Crisis 2008 Impact Of The Great Recession On Investment Banks Ppt Infographics Design Templates PDF
Presenting global financial crisis 2008 impact of the great recession on investment banks ppt infographics design templates pdf to provide visual cues and insights. Share and navigate important information on ten stages that need your due attention. This template can be used to pitch topics like impact of the great recession on investment banks. In addtion, this PPT design contains high resolution images, graphics, etc, that are easily editable and available for immediate download.

Artificial Intelligence Machine Learning Deep Learning Why Is Machine Learning Important Ppt PowerPoint Presentation Infographics Summary PDF
Presenting this set of slides with name artificial intelligence machine learning deep learning why is machine learning important ppt powerpoint presentation infographics summary pdf. This is a two stage process. The stages in this process are model, prediction, predicted data, precision recall, error analysis, learning, pre processing, normalization, training data. This is a completely editable PowerPoint presentation and is available for immediate download. Download now and impress your audience.
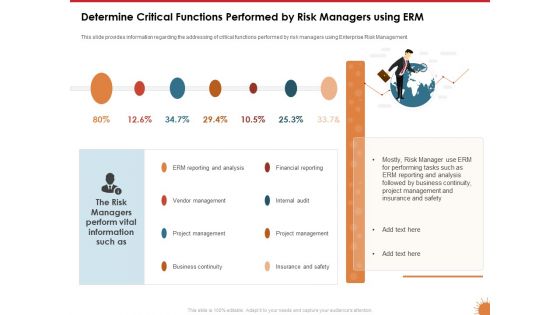
Impact Of COVID 19 On The Hospitality Industry Determine Critical Functions Performed By Risk Managers Using ERM Infographics PDF
Presenting this set of slides with name impact of covid 19 on the hospitality industry determine critical functions performed by risk managers using erm infographics pdf. This is a one stage process. The stages in this process are erm reporting and analysis, vendor management, project management, business continuity, financial reporting, internal audit, insurance and safety. This is a completely editable PowerPoint presentation and is available for immediate download. Download now and impress your audience.
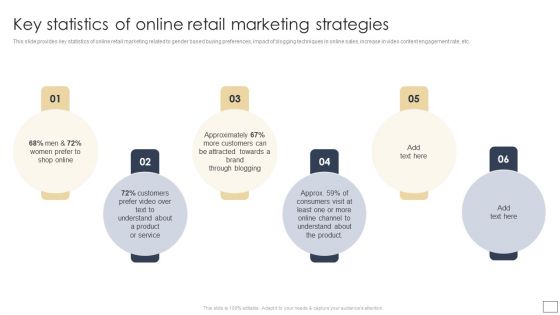
Digital Retail Marketing Techniques To Increase Target Customers Key Statistics Of Online Retail Marketing Strategies Infographics PDF
This slide provides key statistics of online retail marketing related to gender based buying preferences, impact of blogging techniques in online sales, increase in video content engagement rate, etc.Coming up with a presentation necessitates that the majority of the effort goes into the content and the message you intend to convey. The visuals of a PowerPoint presentation can only be effective if it supplements and supports the story that is being told. Keeping this in mind our experts created Digital Retail Marketing Techniques To Increase Target Customers Key Statistics Of Online Retail Marketing Strategies Infographics PDF to reduce the time that goes into designing the presentation. This way, you can concentrate on the message while our designers take care of providing you with the right template for the situation.

Healthcare Management Overview Trends Stats And Operational Areas Key Statistics Highlighting Most Common Website Issues Infographics PDF
The following slide showcases a graphical representation of major website issues faced by the healthcare organizations. No Hypertext Transfer Protocol HTTPS, broken links, outdated website design and slow load web page are the problems which are outlined in the slide. From laying roadmaps to briefing everything in detail, our templates are perfect for you. You can set the stage with your presentation slides. All you have to do is download these easy to edit and customizable templates. Healthcare Management Overview Trends Stats And Operational Areas Key Statistics Highlighting Most Common Website Issues Infographics PDF will help you deliver an outstanding performance that everyone would remember and praise you for. Do download this presentation today.

Utilization Of Current Techniques To Improve Efficiency Case Competition SWOT Analysis Of ADC Cosmetics Company Strengths Infographics PDF
This slide shows the strengths of ADC Cosmetics Company that it has over its competitors such as Fantastic Product Range , Strong and Widespread Distribution , High Product Quality etc. Presenting utilization of current techniques to improve efficiency case competition swot analysis of adc cosmetics company strengths infographics pdf to provide visual cues and insights. Share and navigate important information on one stage that need your due attention. This template can be used to pitch topics like fantastic product range, strong and widespread distribution, high product quality. In addtion, this PPT design contains high resolution images, graphics, etc, that are easily editable and available for immediate download.

Pitch Deck For Fundraising From Angel Investors Competitive Analysis Of The Product With Performance Metrics Infographics PDF
This slide provides competitive analysis of the product with respect to the competitors based on certain paraments like Customer experience, target audience, Competitive Advantage, Support and Delivery etc. Deliver an awe inspiring pitch with this creative pitch deck for fundraising from angel investors competitive analysis of the product with performance metrics infographics pdf bundle. Topics like key marketing, product feature, competitor, organic product materials, service can be discussed with this completely editable template. It is available for immediate download depending on the needs and requirements of the user.
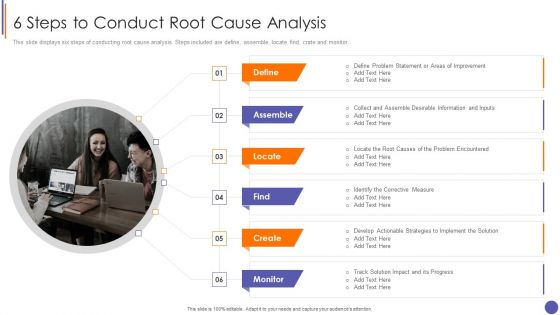
Contents For QA Plan And Process Set 3 6 Steps To Conduct Root Cause Analysis Infographics PDF
This slide displays six steps of conducting root cause analysis. Steps included are define, assemble, locate, find, crate and monitor.This is a Contents For QA Plan And Process Set 3 6 Steps To Conduct Root Cause Analysis Infographics PDF template with various stages. Focus and dispense information on six stages using this creative set, that comes with editable features. It contains large content boxes to add your information on topics like Areas Of Improvement, Desirable Information, Problem Encountered You can also showcase facts, figures, and other relevant content using this PPT layout. Grab it now.
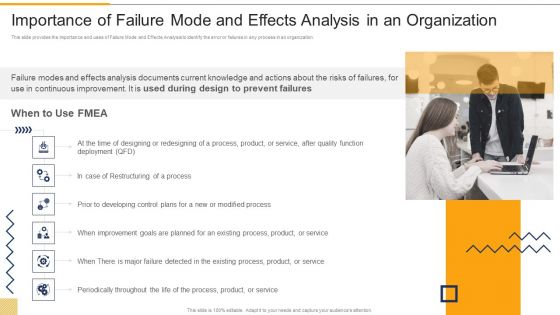
Importance Of Failure Mode And Effects Analysis In An Organization FMEA Techniques For Process Assessment Infographics PDF
This slide provides the importance and uses of Failure Mode and Effects Analysis to identify the error or failures in any process in an organization. Presenting Importance Of Failure Mode And Effects Analysis In An Organization FMEA Techniques For Process Assessment Infographics PDF to provide visual cues and insights. Share and navigate important information on one stage that need your due attention. This template can be used to pitch topics like Designing Or Redesigning, Restructuring Process, Existing Process. In addtion, this PPT design contains high resolution images, graphics, etc, that are easily editable and available for immediate download.
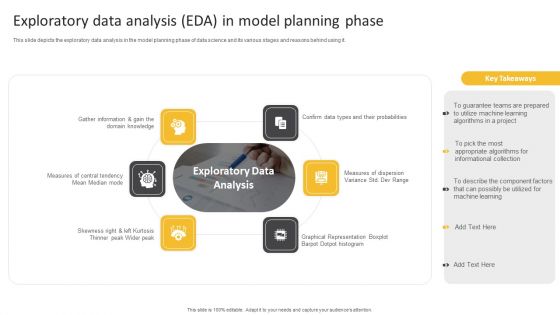
Information Science Exploratory Data Analysis EDA In Model Planning Phase Ppt PowerPoint Presentation Infographics Graphics Pictures PDF
This slide depicts the exploratory data analysis in the model planning phase of data science and its various stages and reasons behind using it.This is a Information Science Exploratory Data Analysis EDA In Model Planning Phase Ppt PowerPoint Presentation Infographics Graphics Pictures PDF template with various stages. Focus and dispense information on six stages using this creative set, that comes with editable features. It contains large content boxes to add your information on topics like Measures Dispersion, Graphical Representation, Skewness Right. You can also showcase facts, figures, and other relevant content using this PPT layout. Grab it now.
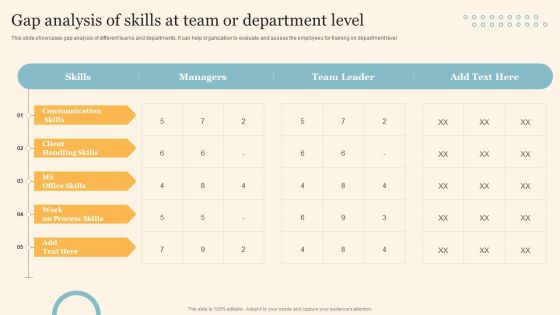
Staff On Job Coaching Program For Skills Enhancement Gap Analysis Of Skills At Team Or Department Level Infographics PDF
This slide showcases gap analysis of different teams and departments. It can help organization to evaluate and assess the employees for training on department level. There are so many reasons you need a Staff On Job Coaching Program For Skills Enhancement Gap Analysis Of Skills At Team Or Department Level Infographics PDF. The first reason is you can not spend time making everything from scratch, Thus, Slidegeeks has made presentation templates for you too. You can easily download these templates from our website easily.

COVID 19 Risk Analysis Mitigation Policies Ocean Liner Sector Economic Instability Risk In Cruise Sector Infographics PDF
This slide provides information regarding various risks associated to economic instability risk on cruise industry such as declining customer base, cash crunch, additional expense etc. This is a covid 19 risk analysis mitigation policies ocean liner sector economic instability risk in cruise sector infographics pdf template with various stages. Focus and dispense information on four stages using this creative set, that comes with editable features. It contains large content boxes to add your information on topics like risk, expenses, customer, revenues. You can also showcase facts, figures, and other relevant content using this PPT layout. Grab it now.
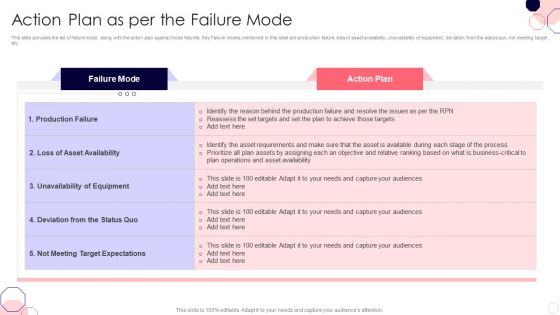
Issues And Impact Of Failure Mode And Effects Analysis Action Plan As Per The Failure Mode Infographics PDF
This slide provides the list of failure mode, along with the action plan against those failures. Key Failure modes mentioned in this slide are production failure, loss of asset availability, unavailability of equipment, deviation from the status quo, not meeting target etc.Deliver and pitch your topic in the best possible manner with this Issues And Impact Of Failure Mode And Effects Analysis Action Plan As Per The Failure Mode Infographics PDF. Use them to share invaluable insights on Production Failure, Unavailability Equipment, Target Expectations and impress your audience. This template can be altered and modified as per your expectations. So, grab it now.
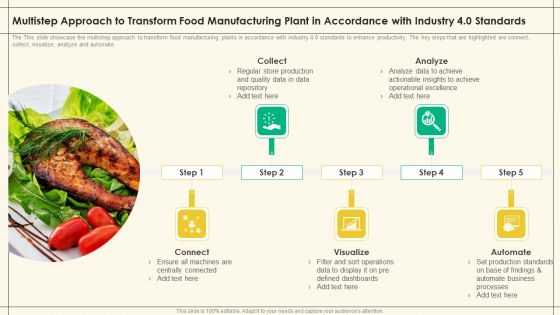
Multistep Approach Transform Food Manufacturing Plant Accordance Industry 4 0 Standards Precooked Food Industry Analysis Infographics PDF
The This slide showcase the multistep approach to transform food manufacturing plants in accordance with industry 4.0 standards to enhance productivity. The key steps that are highlighted are connect, collect, visualize, analyze and automate.Presenting Multistep Approach Transform Food Manufacturing Plant Accordance Industry 4 0 Standards Precooked Food Industry Analysis Infographics PDF to provide visual cues and insights. Share and navigate important information on five stages that need your due attention. This template can be used to pitch topics like Ensure Machines, Centrally Connected, Defined Dashboards. In addtion, this PPT design contains high resolution images, graphics, etc, that are easily editable and available for immediate download.

Difference Between 4G And 5G Based On Cell Density Comparative Analysis Of 4G And 5G Technologies Infographics PDF
This slide outlines the cell density, which distinguishes the 5G from 4G technology as it provides a denser network where more users and devices can be connected.This is a Difference Between 4G And 5G Based On Cell Density Comparative Analysis Of 4G And 5G Technologies Infographics PDF template with various stages. Focus and dispense information on five stages using this creative set, that comes with editable features. It contains large content boxes to add your information on topics like Targets Overall, Predecessor Failed,Network Capacity. You can also showcase facts, figures, and other relevant content using this PPT layout. Grab it now.

 Home
Home