Survey Infographic
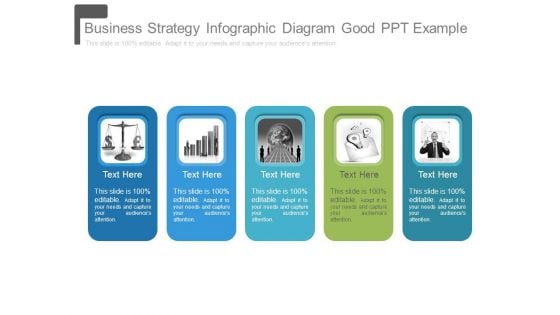
Business Strategy Infographic Diagram Good Ppt Example
This is a business strategy infographic diagram good ppt example. This is a five stage process. The stages in this process are business, marketing, analysis, management, presentation.
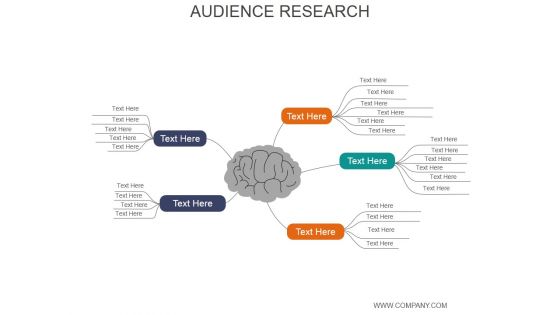
Audience Research Ppt PowerPoint Presentation Infographic Template
This is a audience research ppt powerpoint presentation infographic template. This is a five stage process. The stages in this process are mind map, process, success, strategy, analysis.
Circular Ppt PowerPoint Presentation Infographic Template
This is a circular ppt powerpoint presentation infographic template. This is a nine stage process. The stages in this process are business, strategy, marketing, analysis, circular process.
Lego Ppt PowerPoint Presentation Infographic Template Templates
This is a lego ppt powerpoint presentation infographic template templates. This is a six stage process. The stages in this process are business, strategy, marketing, analysis, lego.
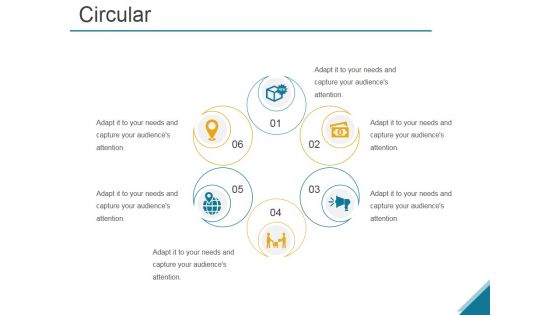
Circular Ppt PowerPoint Presentation Infographic Template Maker
This is a circular ppt powerpoint presentation infographic template maker. This is a six stage process. The stages in this process are business, strategy, analysis, success, icons.
Venn Ppt PowerPoint Presentation Infographic Template Display
This is a venn ppt powerpoint presentation infographic template display. This is a three stage process. The stages in this process are venn, marketing, analysis, sales, business.
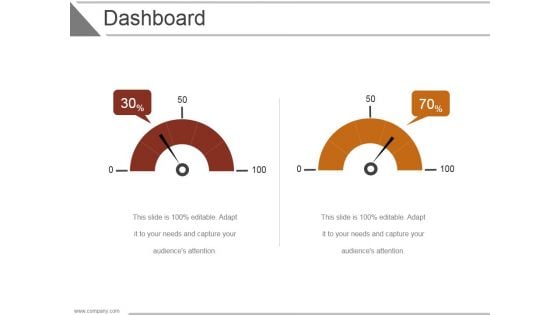
Dashboard Ppt PowerPoint Presentation Infographic Template Format
This is a dashboard ppt powerpoint presentation infographic template format. This is a two stage process. The stages in this process are business, strategy, analysis, marketing, finance, dashboard.
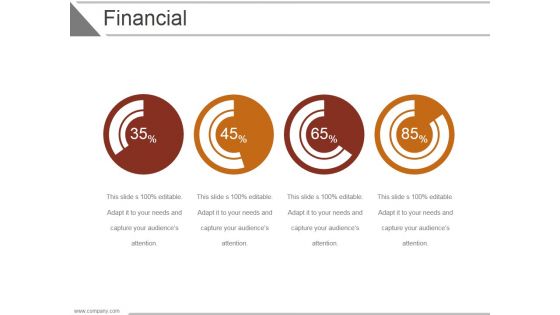
Financial Ppt PowerPoint Presentation Infographic Template Model
This is a financial ppt powerpoint presentation infographic template model. This is a four stage process. The stages in this process are business, strategy, analysis, marketing, finance, donut.
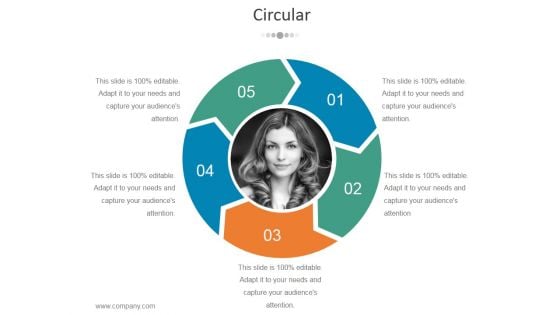
Circular Ppt PowerPoint Presentation Infographic Template Samples
This is a circular ppt powerpoint presentation infographic template samples. This is a five stage process. The stages in this process are business, strategy, marketing, analysis, communication.
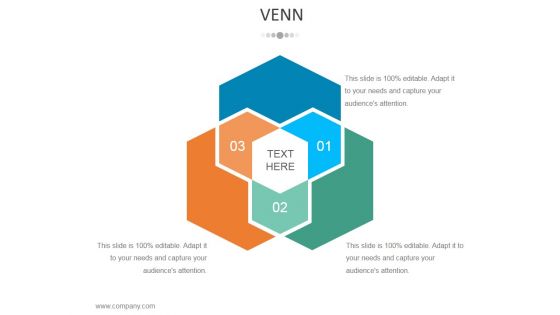
Venn Ppt PowerPoint Presentation Infographic Template Layouts
This is a venn ppt powerpoint presentation infographic template layouts. This is a three stage process. The stages in this process are business, strategy, marketing, analysis, venn.
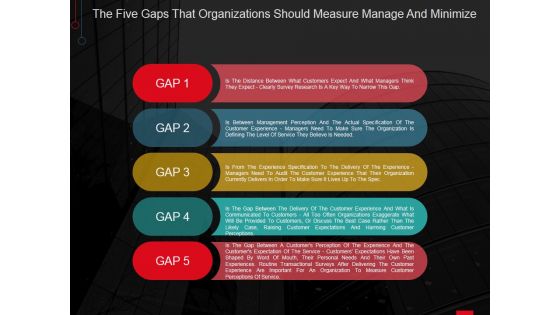
Gap Ppt PowerPoint Presentation Infographic Template Files
This is a gap ppt powerpoint presentation infographic template files. This is a five stage process. The stages in this process are business, analysis, marketing, strategy, management, success.
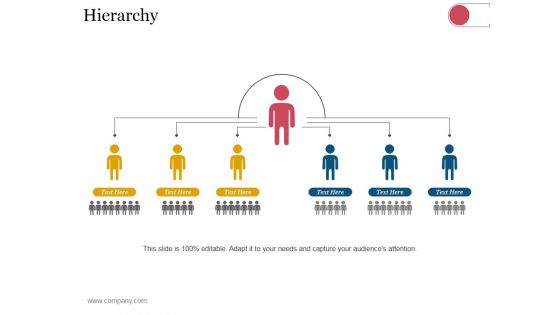
Hierarchy Ppt PowerPoint Presentation Portfolio Infographic Template
This is a hierarchy ppt powerpoint presentation portfolio infographic template. This is a six stage process. The stages in this process are business, strategy, analysis, planning, management.
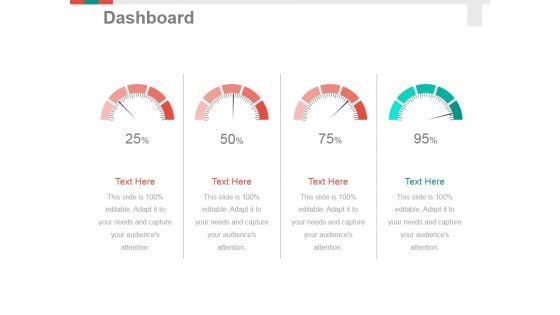
Dashboard Ppt PowerPoint Presentation Slides Infographic Template
This is a dashboard ppt powerpoint presentation slides infographic template. This is a four stage process. The stages in this process are dashboard, marketing, analysis, measure, business.
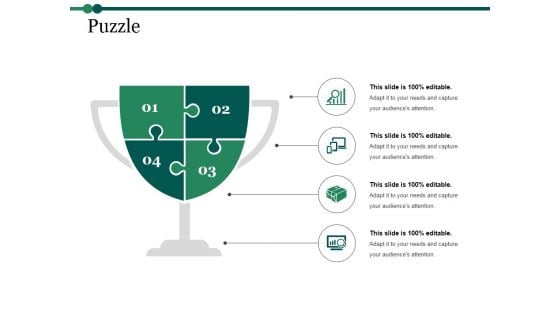
Puzzle Ppt PowerPoint Presentation Infographic Template Graphics
This is a puzzle ppt powerpoint presentation infographic template graphics. This is a four stage process. The stages in this process are puzzle, problem, solution, analysis, marketing, business.

Results Ppt PowerPoint Presentation Infographic Template
This is a results ppt powerpoint presentation infographic template. This is a three stage process. The stages in this process are result, business, planning, strategy, analysis.

Dashboard Ppt PowerPoint Presentation Infographic Template Portfolio
This is a dashboard ppt powerpoint presentation infographic template portfolio. This is a one stage process. The stages in this process are dashboard, measurement, analysis, business, marketing.
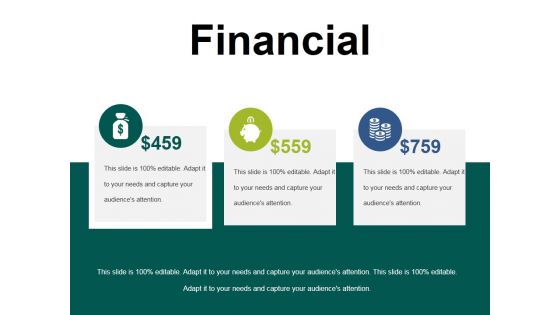
Financial Ppt PowerPoint Presentation Infographic Template Pictures
This is a financial ppt powerpoint presentation infographic template pictures. This is a three stage process. The stages in this process are financial, marketing, strategy, business, analysis.
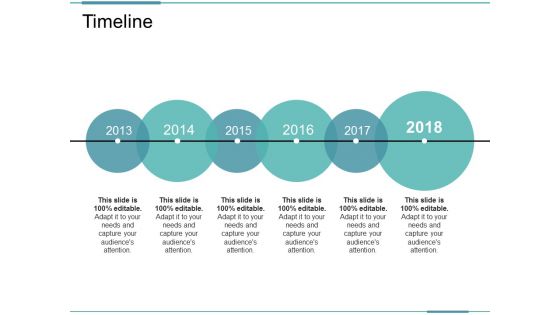
Timeline Ppt PowerPoint Presentation Infographic Template Diagrams
This is a timeline ppt powerpoint presentation infographic template diagrams. This is a six stage process. The stages in this process are timeline, marketing, strategy, planning, analysis.
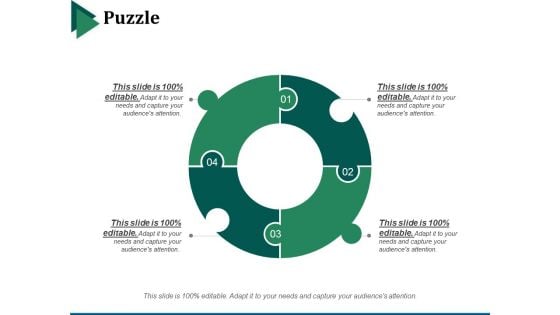
Puzzle Ppt PowerPoint Presentation Infographic Template Display
This is a puzzle ppt powerpoint presentation infographic template display. This is a four stage process. The stages in this process are puzzles, marketing, strategy, process, analysis.
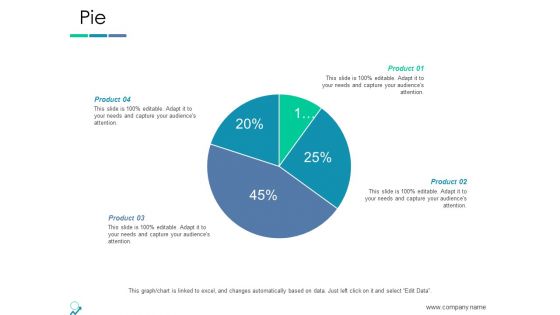
Pie Ppt PowerPoint Presentation Infographic Template Designs
This is a pie ppt powerpoint presentation infographic template designs. This is a four stage process. The stages in this process are business, finance, marketing, analysis, investment.
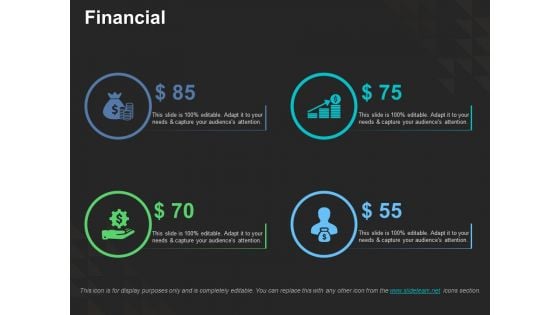
Financial Ppt PowerPoint Presentation Infographic Template Visuals
This is a financial ppt powerpoint presentation infographic template visuals. This is a four stage process. The stages in this process are finance, investment, business, planning, marketing, analysis.
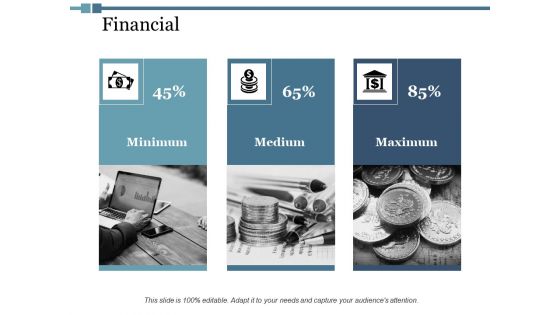
Financial Ppt PowerPoint Presentation Infographic Template Background
This is a financial ppt powerpoint presentation infographic template background. This is a three stage process. The stages in this process are finance, marketing, management, investment, analysis.
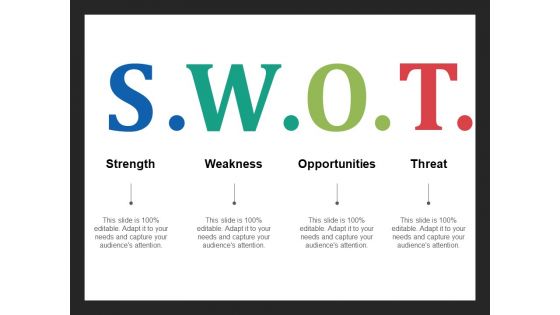
Strength Ppt PowerPoint Presentation Ideas Infographic Template
This is a strength ppt powerpoint presentation ideas infographic template. This is a four stage process. The stages in this process are strength, weakness, opportunities, threat.
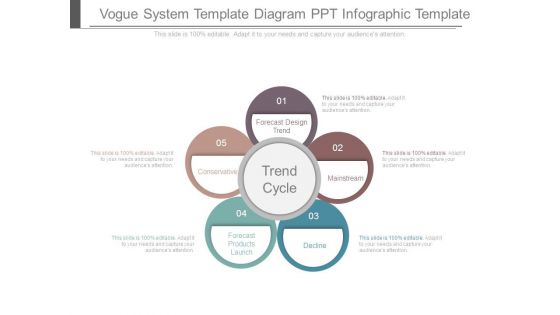
Vogue System Template Diagram Ppt Infographic Template
This is a vogue system template diagram ppt infographic template. This is a five stage process. The stages in this process are Forecast Design Trend, Mainstream, Decline, Forecast Products Launch, Conservative.
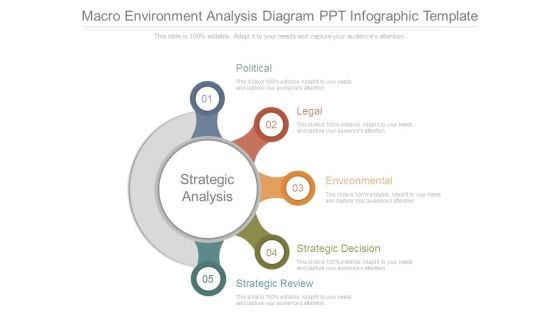
Macro Environment Analysis Diagram Ppt Infographic Template
This is a macro environment analysis diagram ppt infographic template. This is a five stage process. The stages in this process are political, legal, environmental, strategic decision, strategic review, strategic analysis.
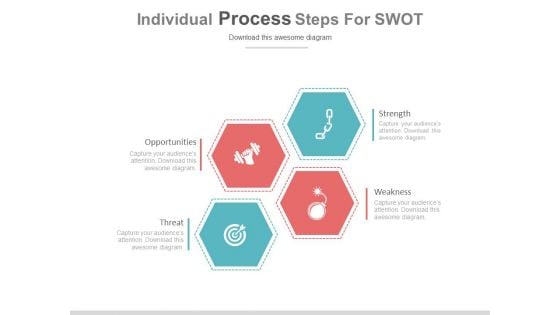
Infographic Diagram For Swot Analysis Powerpoint Slides
This PPT slide has been designed with infographic diagram of four boxes. This business diagram helps to exhibit SWOT analysis. Use this PowerPoint template to build an exclusive presentation.
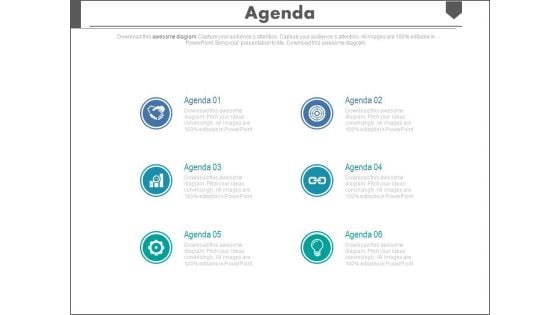
Sales Agenda Analysis Infographic Diagram Powerpoint Slides
This PowerPoint template has been designed with sales agenda analysis infographic diagram. Download this PPT slide to depict important matters of business meeting. The structure of our template allows you to effectively highlight the key issues concerning to your agenda.
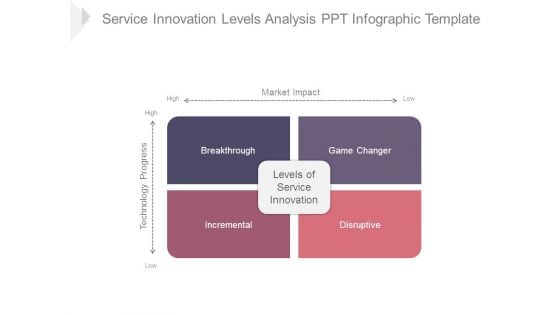
Service Innovation Levels Analysis Ppt Infographic Template
This is a service innovation levels analysis ppt infographic template. This is a four stage process. The stages in this process are breakthrough, game changer, disruptive, incremental, technology progress, market impact, levels of service innovation.
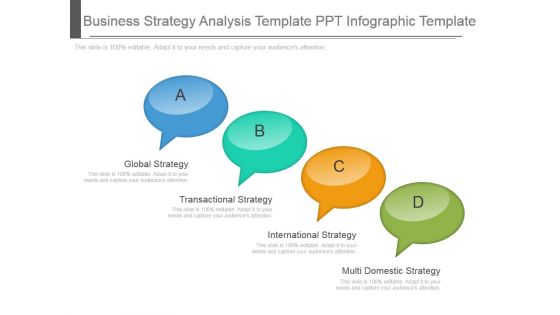
Business Strategy Analysis Template Ppt Infographic Template
This is a business strategy analysis template ppt infographic template. This is a four stage process. The stages in this process are global strategy, transactional strategy, international strategy, multi domestic strategy.
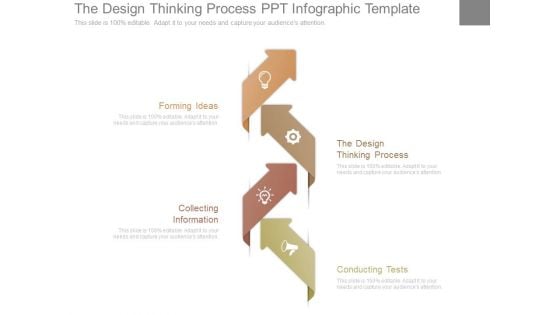
The Design Thinking Process Ppt Infographic Template
This is a the design thinking process ppt infographic template. This is a four stage process. The stages in this process are forming ideas, the design thinking process, conducting tests, collecting information.
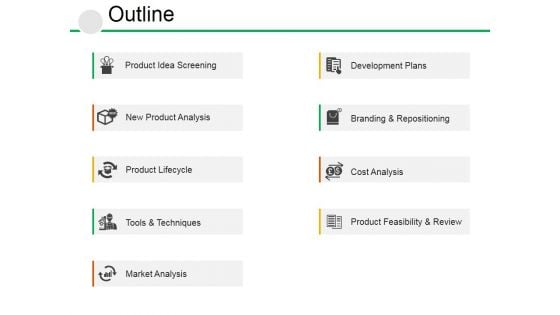
Outline Ppt PowerPoint Presentation Infographic Template Inspiration
This is a outline ppt powerpoint presentation infographic template inspiration. This is a nine stage process. The stages in this process are product idea screening, new product analysis, product lifecycle, tools and techniques, market analysis.
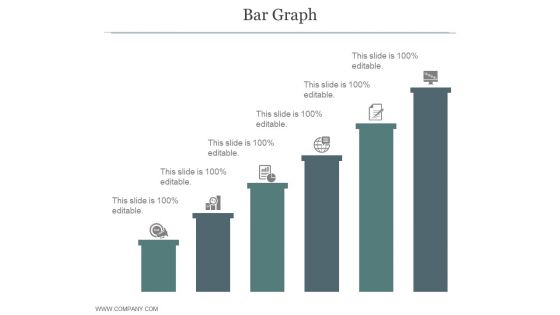
Bar Graph Ppt PowerPoint Presentation Infographic Template
This is a bar graph ppt powerpoint presentation infographic template. This is a six stage process. The stages in this process are business, strategy, bar graph, growth, marketing, analysis.
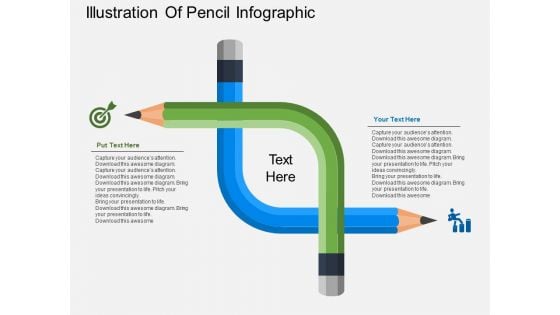
Illustration Of Pencil Infographic Powerpoint Templates
The above PowerPoint template displays a pencil Infographic diagram. This PPT slide may be used to display target planning and analysis. Grab center stage with this slide and capture the attention of your audience.
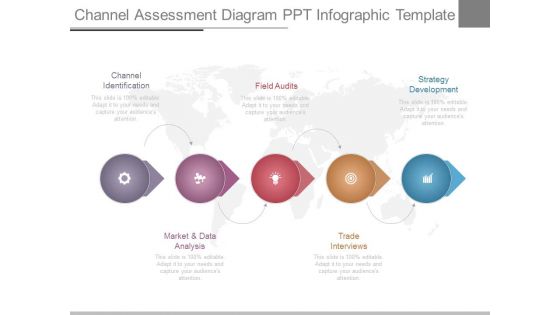
Channel Assessment Diagram Ppt Infographic Template
This is a channel assessment diagram ppt infographic template. This is a five stage process. The stages in this process are channel identification, market and data analysis, field audits, trade interviews, strategy development.
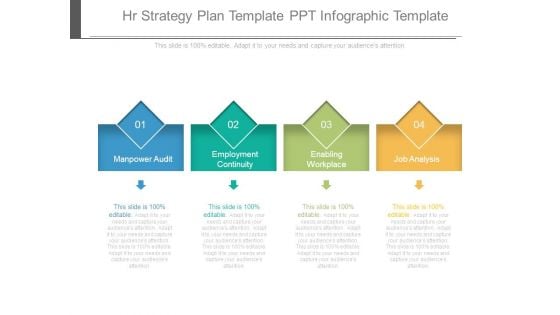
Hr Strategy Plan Template Ppt Infographic Template
This is a hr strategy plan template ppt infographic template. This is a four stage process. The stages in this process are manpower audit, employment continuity, enabling workplace, job analysis.

Thank You Ppt PowerPoint Presentation Infographic Template
This is a thank you ppt powerpoint presentation infographic template. This is a one stage process. The stages in this process are business, strategy, marketing, success, process, analysis, thank you.
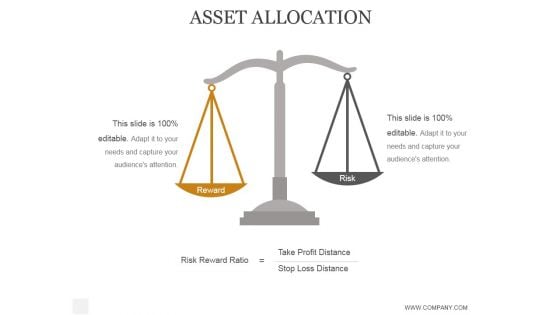
Asset Allocation Ppt PowerPoint Presentation Infographic Template
This is a asset allocation ppt powerpoint presentation infographic template. This is a two stage process. The stages in this process are business, strategy, marketing, analysis, success, reward, risk.
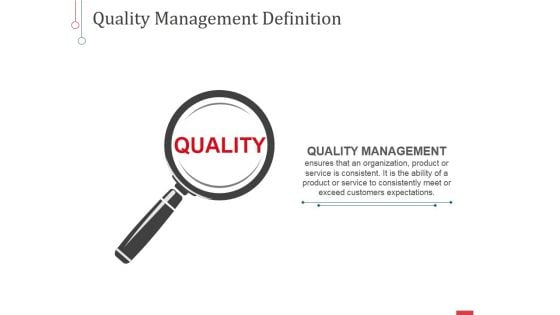
Quality Ppt PowerPoint Presentation Infographic Template Sample
This is a quality ppt powerpoint presentation infographic template sample. This is a one stage process. The stages in this process are quality management, magnifier, search, marketing, strategy, analysis, business.
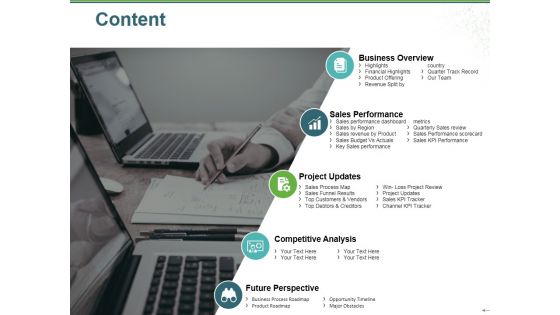
Content Ppt PowerPoint Presentation Infographic Template Objects
This is a content ppt powerpoint presentation infographic template objects. This is a five stage process. The stages in this process are business overview, sales performance, project updates, competitive analysis, future perspective.
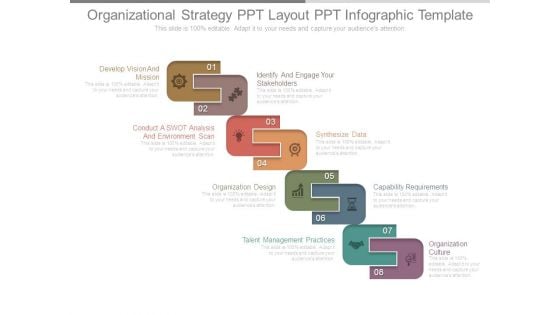
Organizational Strategy Ppt Layout Ppt Infographic Template
This is a organizational strategy ppt layout ppt infographic template. This is a eight stage process. The stages in this process are develop vision and mission, identify and engage your stakeholders, conduct a swot analysis and environment scan, synthesize data, organization design, capability requirements, talent management practices, organization culture.
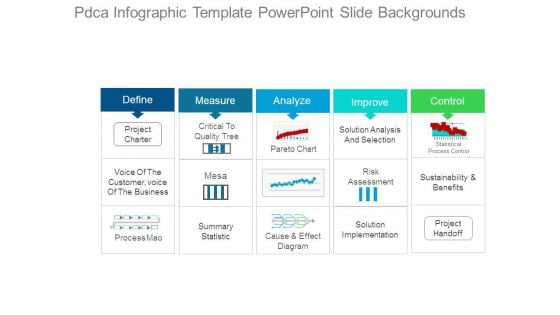
Pdca Infographic Template Powerpoint Slide Backgrounds
This is a pdca infographic template powerpoint slide backgrounds. This is a five stage process. The stages in this process are define, measure, analyze, improve, control, project charter, critical to quality tree, pareto chart, solution analysis and selection, statistical process control, voice of the customer voice of the business, mesa, risk assessment, sustainability and benefits, process mao, summary statistic, cause and effect diagram, solution implementation, project handoff.
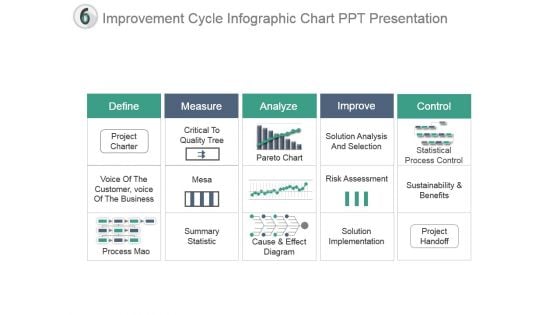
Improvement Cycle Infographic Chart Ppt Presentation
This is a improvement cycle infographic chart ppt presentation. This is a five stage process. The stages in this process are define, measure, analyze, improve, control, project charter, critical to quality tree, process mao, summary statistic, mesa, pareto chart, cause and effect diagram, solution analysis and selection, risk assessment, solution implementation, sustainability and benefits, project handoff, statistical process control, voice of the customer, voice of the business.
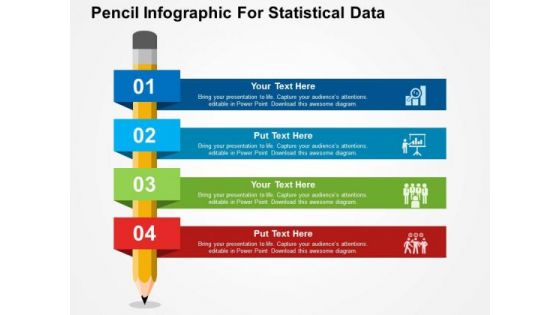
Pencil Infographic For Statistical Data PowerPoint Templates
Create dynamic presentations with our professional template containing pencil infographic. This diagram helps to present statistical data. Great impact can be created on the viewer easily with the help of this business template.
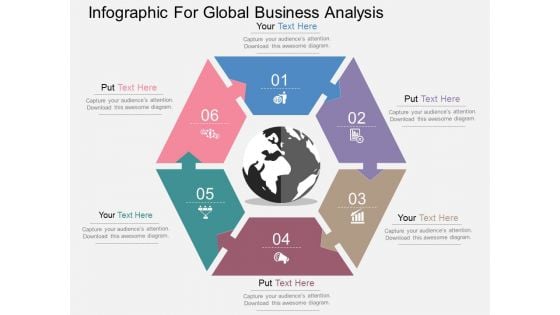
Infographic For Global Business Analysis Powerpoint Templates
Our professionally designed business diagram is as an effective tool to display global business analysis. It contains circular infographic. This diagram can be useful for business presentations.
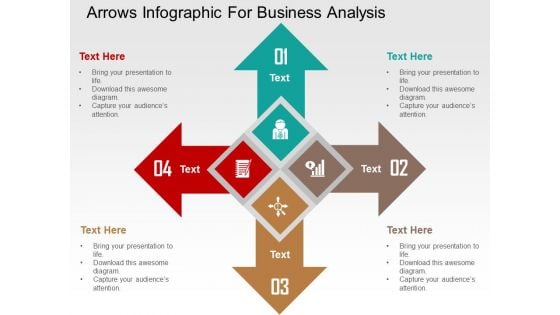
Arrows Infographic For Business Analysis Powerpoint Templates
Concept of business analysis can be well explained with this power point template. This diagram contains design of arrow infographic. Use this slide to make impressive presentations.
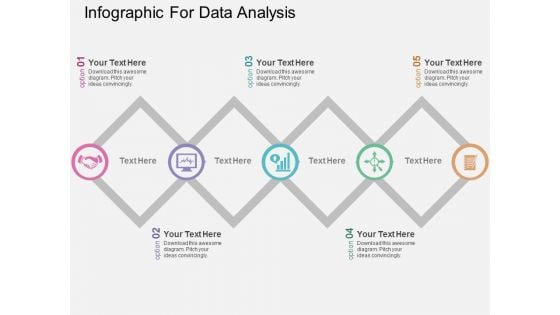
Infographic For Data Analysis Powerpoint Templates
This PowerPoint slide has been designed with process infographic. This PPT diagram may be used to display evaluation of business process. This diagram slide can be used to make impressive presentations.
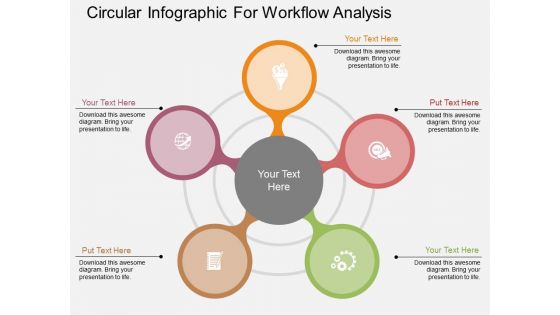
Circular Infographic For Workflow Analysis Powerpoint Templates
The above PowerPoint template displays a diagram of circular Infographic. Download this PPT slide to depict workflow analysis. Refine your thoughts with this slide. Narrow them down to the very best.
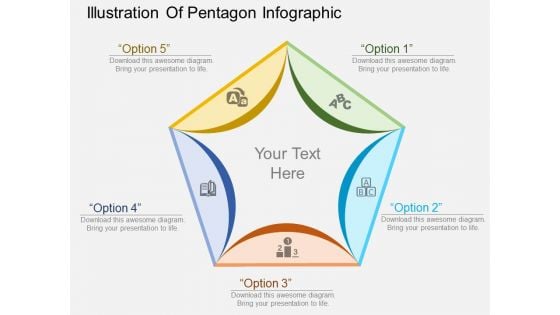
Illustration Of Pentagon Infographic Powerpoint Template
Our above business slide contains pentagon infographic. This PowerPoint template can be used to display the relationship and analysis. Capture the attention of your audience with this slide.
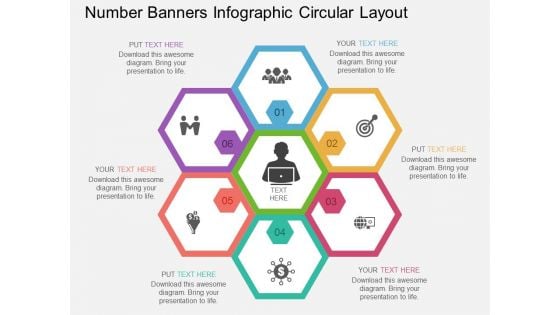
Number Banners Infographic Circular Layout Powerpoint Template
This business diagram contains business Infographic. Our professionally designed business diagram helps to depict business analysis. Enlighten your audience with your breathtaking ideas.
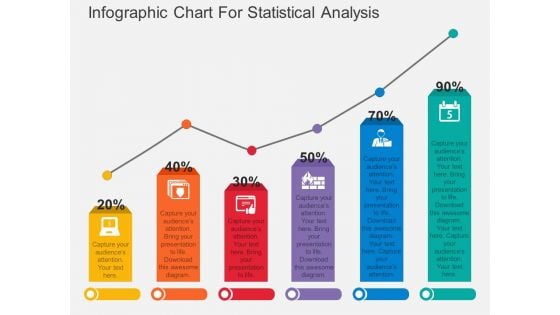
Infographic Chart For Statistical Analysis Powerpoint Template
Download this exclusive business diagram to display statistical analysis. This PowerPoint template contains bar chart with percentage values. This diagram is useful for business presentations.
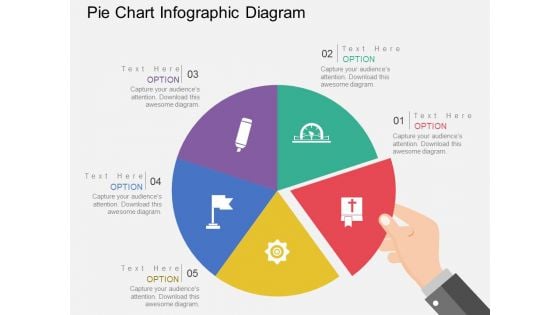
Pie Chart Infographic Diagram Powerpoint Templates
This Power Point template has been designed with pie chart infographic. This business slide is useful to present financial ratio analysis. Use this diagram to make business presentation. Illustrate these thoughts with this slide.
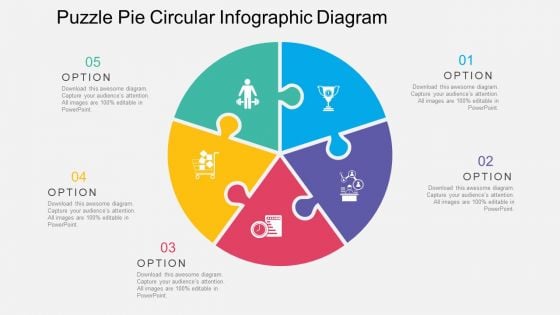
Puzzle Pie Circular Infographic Diagram Powerpoint Templates
Our above PPT slide display puzzle pie circular Infographic. Download this diagram slide to display strategy and analysis. Adjust the above diagram in your business presentations to visually support your content.
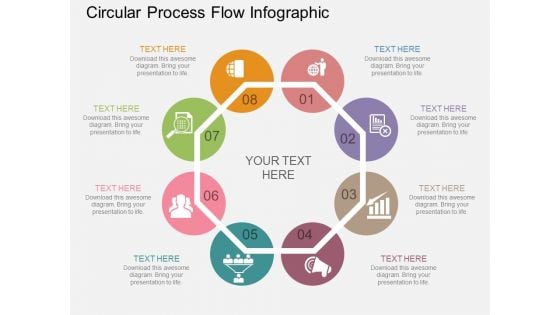
Circular Process Flow Infographic Powerpoint Template
This power point template has been designed with graphics of circular process infographic. This PPT diagram may be used to display marketing analysis. Use this PPT diagram for business presentations.
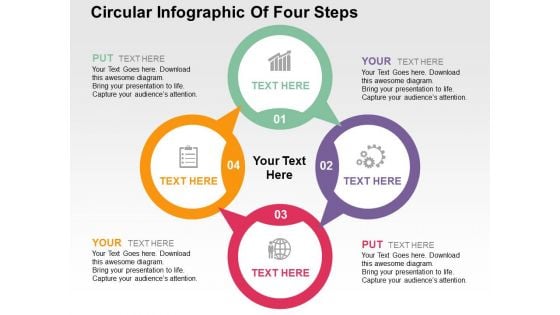
Circular Infographic Of Four Steps Powerpoint Templates
Visually support your presentation with our above template showing circular Infographic. This slide has been professionally designed to emphasize the concept of market research and analysis. Deliver amazing presentations to mesmerize your audience.
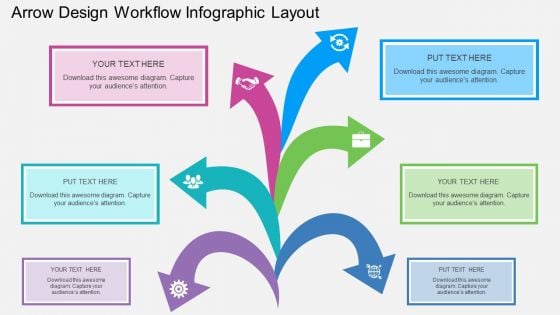
Arrow Design Workflow Infographic Layout Powerpoint Template
Concept of business analysis can be well explained with this power point template. This PPT slide contains design of arrow workflow infographic. Use this diagram slide to make impressive presentations.
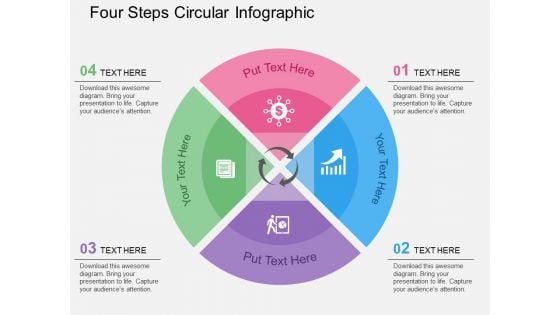
Four Steps Circular Infographic Powerpoint Templates
Our above slide contains diagram of three stage circular infographic. It helps to display global business analysis. Use this diagram to impart more clarity to data and to create more sound impact on viewers.
Paper Infographic With Clips PowerPoint Templates
This slide is minimalistic in nature but is still very creative in nature and has a very modern design. The PowerPoint template can prove to be a very effective tool to reach out to the audience with personal touch to the message. The paper clips have been added to depict the slide as a an extra note or something that might not be of prime importance but yet need to conveyed to the audience such as an early bird offer or discount. This slide can serve the purpose of including a notice to your presentation. This slide can also be effectively used to show a general note or notification such as a deadline or checklist.
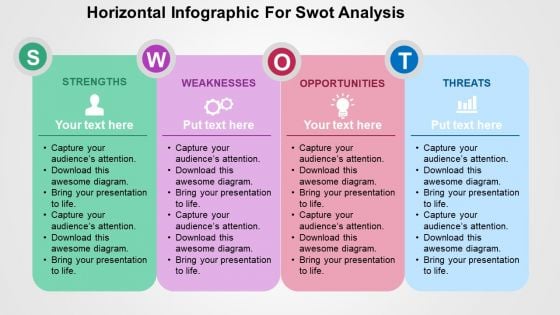
Horizontal Infographic For Swot Analysis PowerPoint Template
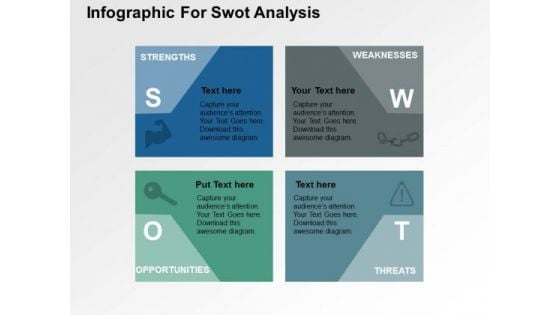
Infographic For Swot Analysis PowerPoint Template
Download this exclusive business diagram to present SWOT analysis. This slide contains the graphic of four text boxes with icons. This diagram can be useful for business presentations.
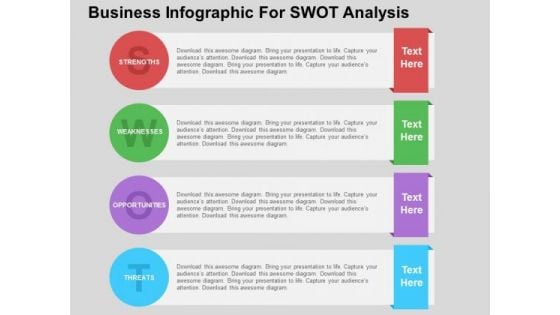
Business Infographic For Swot Analysis PowerPoint Template
This professional diagram slide has been designed with graphics of SWOT analysis. You may use this diagram to analyze strengths, weakness, opportunities and threats for your business. It will help you to sequence your thoughts.

 Home
Home