Survey Dashboard
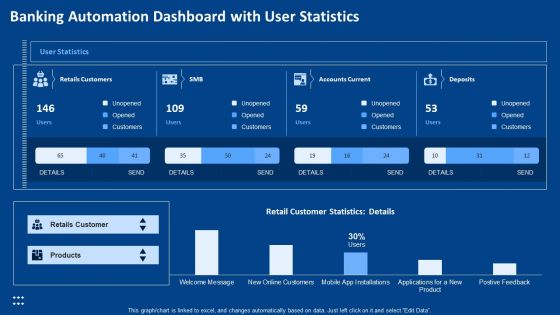
Banking Automation Dashboard With User Statistics Ppt Layout PDF
Deliver an awe-inspiring pitch with this creative banking automation dashboard with user statistics ppt layout pdf bundle. Topics like products, retails customer can be discussed with this completely editable template. It is available for immediate download depending on the needs and requirements of the user.
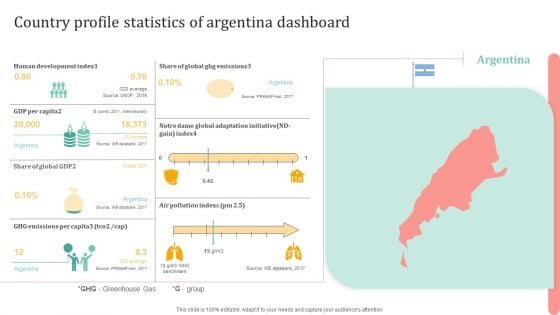
Country Profile Statistics Of Argentina Dashboard Ppt Ideas Clipart PDF
Presenting Country Profile Statistics Of Argentina Dashboard Ppt Ideas Clipart PDF to dispense important information. This template comprises one stages. It also presents valuable insights into the topics including Human Development Index, Global Ghg Emissions, GDP Per Capita. This is a completely customizable PowerPoint theme that can be put to use immediately. So, download it and address the topic impactfully.
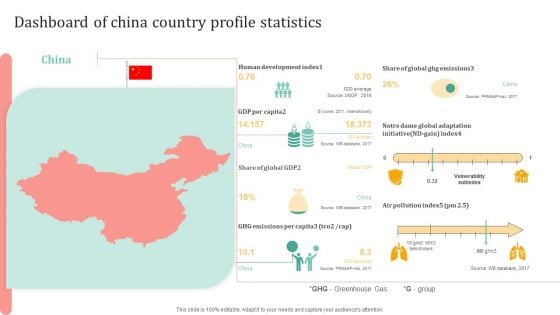
Dashboard Of China Country Profile Statistics Ppt Gallery Vector PDF
Presenting Dashboard Of China Country Profile Statistics Ppt Gallery Vector PDF to dispense important information. This template comprises one stages. It also presents valuable insights into the topics including Development Index, GDP Per Capita, Global Adaptation Initiative. This is a completely customizable PowerPoint theme that can be put to use immediately. So, download it and address the topic impactfully.
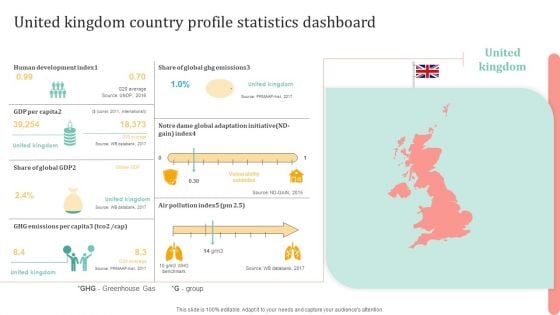
United Kingdom Country Profile Statistics Dashboard Ppt Show Layout PDF
Presenting United Kingdom Country Profile Statistics Dashboard Ppt Show Layout PDF to dispense important information. This template comprises one stages. It also presents valuable insights into the topics including Human Development Index, GDP Per Capita, GHG Emissions. This is a completely customizable PowerPoint theme that can be put to use immediately. So, download it and address the topic impactfully.
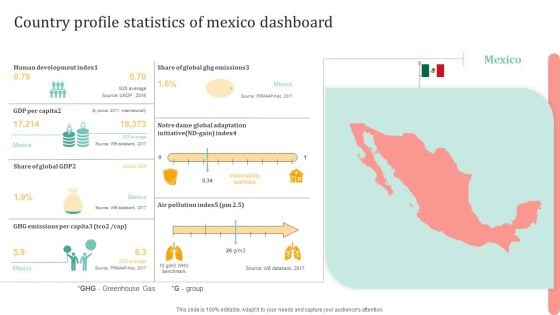
Country Profile Statistics Of Mexico Dashboard Ppt Portfolio Outline PDF
Presenting Country Profile Statistics Of Mexico Dashboard Ppt Portfolio Outline PDF to dispense important information. This template comprises one stages. It also presents valuable insights into the topics including Development Index, GDP Per Capita, Global Adaptation Initiative. This is a completely customizable PowerPoint theme that can be put to use immediately. So, download it and address the topic impactfully.
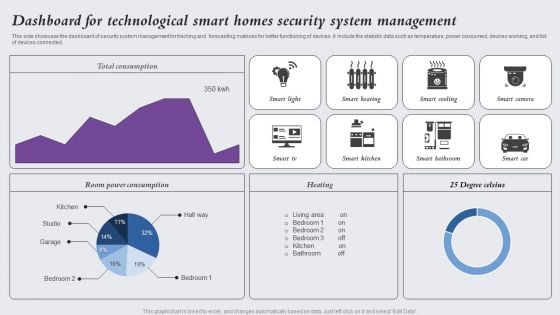
Dashboard For Technological Smart Homes Security System Management Designs PDF
This side showcase the dashboard of security system management for tracking and forecasting matrices for better functioning of devices. It include the statistic data such as temperature, power consumed, devices working, and list of devices connected. Showcasing this set of slides titled Dashboard For Technological Smart Homes Security System Management Designs PDF. The topics addressed in these templates are Smart Light, Smart Heating, Smart Cooling. All the content presented in this PPT design is completely editable. Download it and make adjustments in color, background, font etc. as per your unique business setting.
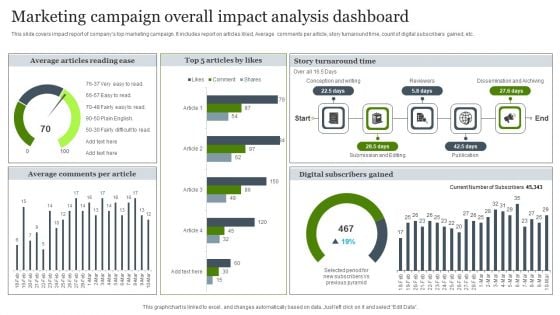
Marketing Campaign Overall Impact Analysis Dashboard Brochure PDF
This slide covers impact report of companys top marketing campaign. It includes report on articles liked, Average comments per article, story turnaround time, count of digital subscribers gained, etc. Pitch your topic with ease and precision using this Marketing Campaign Overall Impact Analysis Dashboard Brochure PDF. This layout presents information on Marketing Campaign, Overall Impact Analysis Dashboard. It is also available for immediate download and adjustment. So, changes can be made in the color, design, graphics or any other component to create a unique layout.
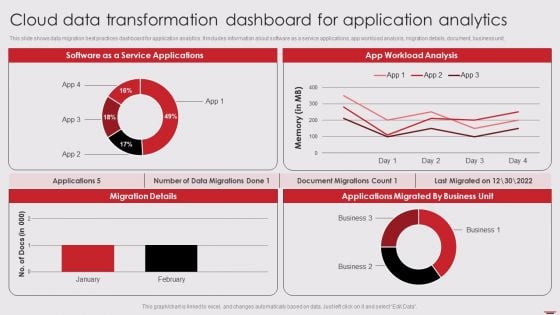
Cloud Data Transformation Dashboard For Application Analytics Information PDF
This slide shows data migration best practices dashboard for application analytics. It includes information about software as a service applications, app workload analysis, migration details, document, business unit. Pitch your topic with ease and precision using this Cloud Data Transformation Dashboard For Application Analytics Information PDF. This layout presents information on Software Service Applications, App Workload Analysis, Migration Details. It is also available for immediate download and adjustment. So, changes can be made in the color, design, graphics or any other component to create a unique layout.
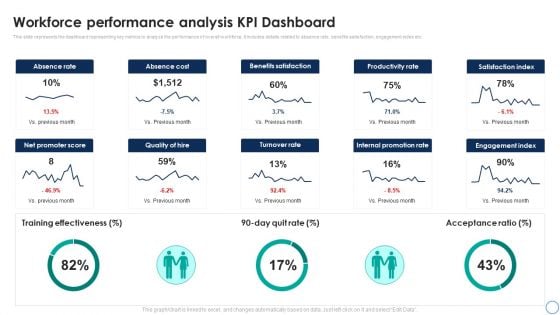
Business Analytics Application Workforce Performance Analysis KPI Dashboard Template PDF
This slide represents the dashboard representing key metrics to analyze the performance of overall workforce. It includes details related to absence rate, benefits satisfaction, engagement index etc. Take your projects to the next level with our ultimate collection of Business Analytics Application Workforce Performance Analysis KPI Dashboard Template PDF. Slidegeeks has designed a range of layouts that are perfect for representing task or activity duration, keeping track of all your deadlines at a glance. Tailor these designs to your exact needs and give them a truly corporate look with your own brand colors theyll make your projects stand out from the rest.
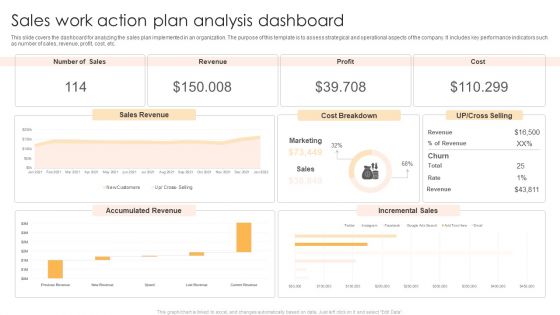
Sales Work Action Plan Analysis Dashboard Brochure PDF
This slide covers the dashboard for analyzing the sales plan implemented in an organization. The purpose of this template is to assess strategical and operational aspects of the company. It includes key performance indicators such as number of sales, revenue, profit, cost, etc. Showcasing this set of slides titled Sales Work Action Plan Analysis Dashboard Brochure PDF. The topics addressed in these templates are Sales Revenue, Cost Breakdown, Accumulated Revenue. All the content presented in this PPT design is completely editable. Download it and make adjustments in color, background, font etc. as per your unique business setting.
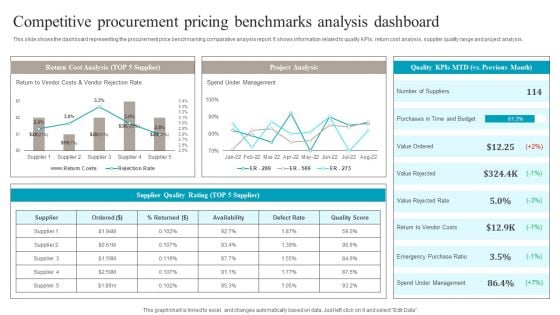
Competitive Procurement Pricing Benchmarks Analysis Dashboard Graphics PDF
This slide shows the dashboard representing the procurement price benchmarking comparative analysis report. It shows information related to quality KPIs, return cost analysis, supplier quality range and project analysis. Showcasing this set of slides titled Competitive Procurement Pricing Benchmarks Analysis Dashboard Graphics PDF. The topics addressed in these templates are Return Cost Analysis, Project Analysis, Supplier Quality Rating. All the content presented in this PPT design is completely editable. Download it and make adjustments in color, background, font etc. as per your unique business setting.
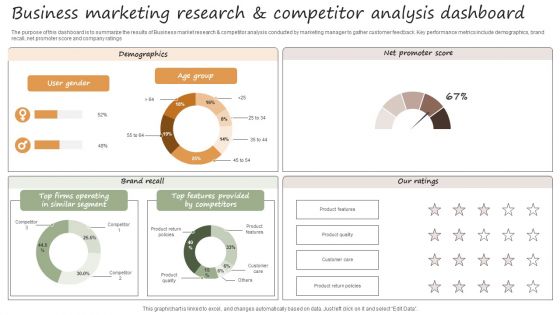
Usiness Marketing Research And Competitor Analysis Dashboard Sample PDF
The purpose of this dashboard is to summarize the results of Business market research and competitor analysis conducted by marketing manager to gather customer feedback. Key performance metrics include demographics, brand recall, net promoter score and company ratings. Showcasing this set of slides titled Usiness Marketing Research And Competitor Analysis Dashboard Sample PDF. The topics addressed in these templates are Brand Recall, Demographics, Net Promoter Score. All the content presented in this PPT design is completely editable. Download it and make adjustments in color, background, font etc. as per your unique business setting.
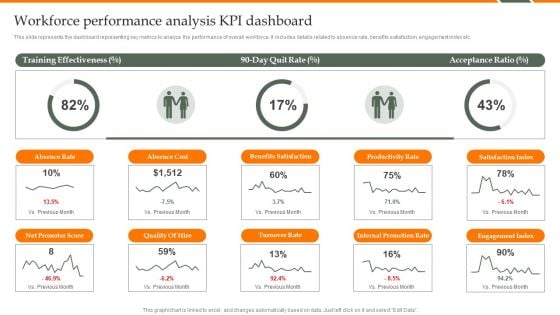
Human Resource Analytics Workforce Performance Analysis KPI Dashboard Structure PDF
This slide represents the dashboard representing key metrics to analyze the performance of overall workforce. It includes details related to absence rate, benefits satisfaction, engagement index etc. Find a pre-designed and impeccable Human Resource Analytics Workforce Performance Analysis KPI Dashboard Structure PDF. The templates can ace your presentation without additional effort. You can download these easy-to-edit presentation templates to make your presentation stand out from others. So, what are you waiting for Download the template from Slidegeeks today and give a unique touch to your presentation.
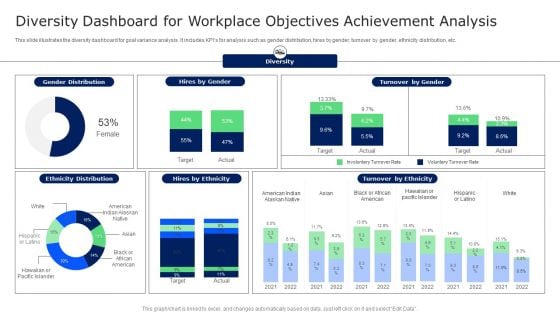
Diversity Dashboard For Workplace Objectives Achievement Analysis Microsoft PDF
This slide illustrates the diversity dashboard for goal variance analysis. It includes KPIs for analysis such as gender distribution, hires by gender, turnover by gender, ethnicity distribution, etc. Showcasing this set of slides titled Diversity Dashboard For Workplace Objectives Achievement Analysis Microsoft PDF. The topics addressed in these templates are Target, Involuntary Turnover Rate, Turnover By Ethnicity. All the content presented in this PPT design is completely editable. Download it and make adjustments in color, background, font etc. as per your unique business setting.
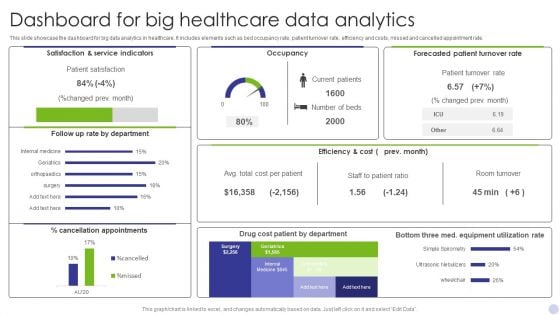
Dashboard For Big Healthcare Data Analytics Graphics PDF
This slide showcase the dashboard for big data analytics in healthcare. It includes elements such as bed occupancy rate, patient turnover rate, efficiency and costs, missed and cancelled appointment rate. Showcasing this set of slides titled Dashboard For Big Healthcare Data Analytics Graphics PDF. The topics addressed in these templates are Satisfaction Service Indicators, Occupancy, Forecasted Patient Turnover. All the content presented in this PPT design is completely editable. Download it and make adjustments in color, background, font etc. as per your unique business setting.
Shipping Delivery Tracking Metrics Analysis Dashboard Structure PDF
This template illustrates the KPI dashboard for tracking shipment orders. It also includes shipment analysis based on different KPIs such as ongoing delivery, completed delivery, on-time delivery, actual delivery duration, and variance between expected and actual delivery time. Pitch your topic with ease and precision using this Shipping Delivery Tracking Metrics Analysis Dashboard Structure PDF. This layout presents information on Recipient Country, Completed Deliveries, Delivery Duration. It is also available for immediate download and adjustment. So, changes can be made in the color, design, graphics or any other component to create a unique layout.
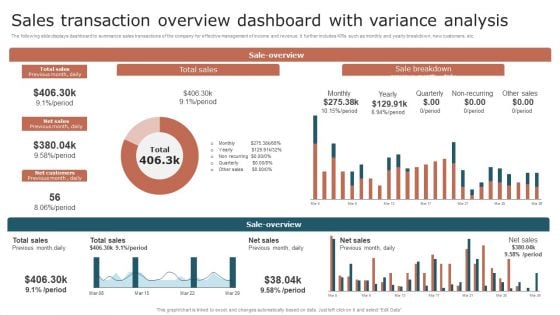
Sales Transaction Overview Dashboard With Variance Analysis Summary PDF
The following slide displays dashboard to summarize sales transactions of the company for effective management of income and revenue. It further includes KPIs such as monthly and yearly breakdown, new customers, etc. Showcasing this set of slides titled Sales Transaction Overview Dashboard With Variance Analysis Summary PDF. The topics addressed in these templates are Sales, Customers, Variance Analysis. All the content presented in this PPT design is completely editable. Download it and make adjustments in color, background, font etc. as per your unique business setting.

Boutique Financing Hotel Property Business Analysis Dashboard Demonstration PDF
This slide shows dashboard with various indicators used to analyse hotel investment and development. It includes property information, acquisition details and KPIS such as EBITDA , interest, interest coverage ratio, REVPAR and yield. Showcasing this set of slides titled Boutique Financing Hotel Property Business Analysis Dashboard Demonstration PDF. The topics addressed in these templates are Property information, Acquisition information. All the content presented in this PPT design is completely editable. Download it and make adjustments in color, background, font etc. as per your unique business setting.
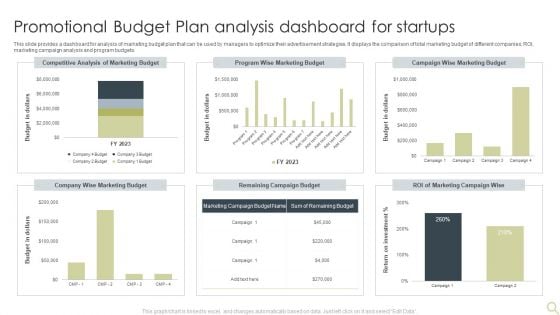
Promotional Budget Plan Analysis Dashboard For Startups Template PDF
This slide provides a dashboard for analysis of marketing budget plan that can be used by managers to optimize their advertisement strategies. It displays the comparison of total marketing budget of different companies, ROI, marketing campaign analysis and program budgets. Showcasing this set of slides titled Promotional Budget Plan Analysis Dashboard For Startups Template PDF. The topics addressed in these templates are Marketing Budget, Marketing Campaign, Competitive Analysis. All the content presented in this PPT design is completely editable. Download it and make adjustments in color, background, font etc. as per your unique business setting.
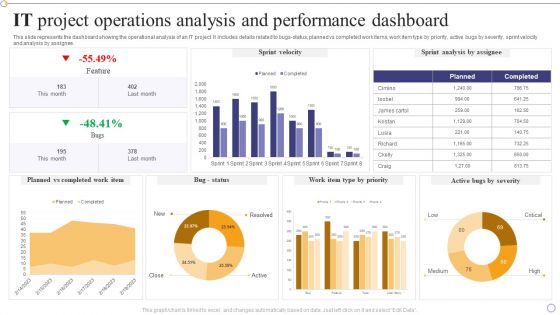
IT Project Operations Analysis And Performance Dashboard Themes PDF
This slide represents the dashboard showing the operational analysis of an IT project. It includes details related to bugs-status, planned vs completed work items, work item type by priority, active bugs by severity, sprint velocity and analysis by assignee.Showcasing this set of slides titled IT Project Operations Analysis And Performance Dashboard Themes PDF. The topics addressed in these templates are Planned Completed, Sprint Analysis, Feature. All the content presented in this PPT design is completely editable. Download it and make adjustments in color, background, font etc. as per your unique business setting.

Public Governance Risk Rating And Analysis Software Dashboard Brochure PDF
This slide covers the status report of risks and security breaches in government initiated public services. It includes risk analysis progress, risk assessment matrix, risk rating and action plan breakdown. Showcasing this set of slides titled Public Governance Risk Rating And Analysis Software Dashboard Brochure PDF. The topics addressed in these templates are Risk Rating Breakdown, Risks Analysis Progress, Analysis Software Dashboard. All the content presented in this PPT design is completely editable. Download it and make adjustments in color, background, font etc. as per your unique business setting.
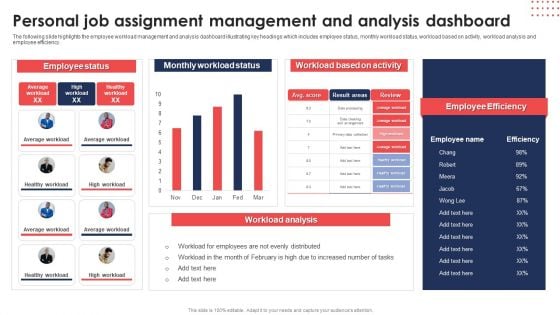
Personal Job Assignment Management And Analysis Dashboard Diagrams PDF
The following slide highlights the employee workload management and analysis dashboard illustrating key headings which includes employee status, monthly workload status, workload based on activity, workload analysis and employee efficiency. Pitch your topic with ease and precision using thisPersonal Job Assignment Management And Analysis Dashboard Diagrams PDF. This layout presents information on Employee Status, Monthly Workload Status, Workload Based Activity. It is also available for immediate download and adjustment. So, changes can be made in the color, design, graphics or any other component to create a unique layout.
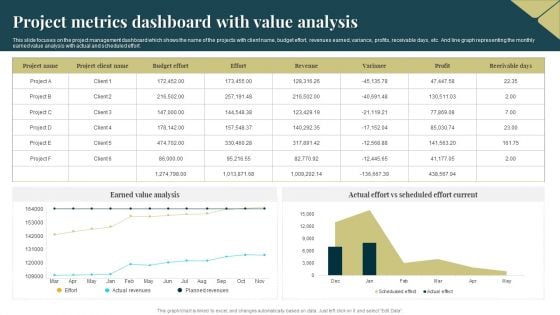
Project Metrics Dashboard With Value Analysis Introduction PDF
This slide focuses on the project management dashboard which shows the name of the projects with client name, budget effort, revenues earned, variance, profits, receivable days, etc. And line graph representing the monthly earned value analysis with actual and scheduled effort. Showcasing this set of slides titled Project Metrics Dashboard With Value Analysis Introduction PDF. The topics addressed in these templates are Budget Effort, Revenues, Earned Value Analysis. All the content presented in this PPT design is completely editable. Download it and make adjustments in color, background, font etc. as per your unique business setting.
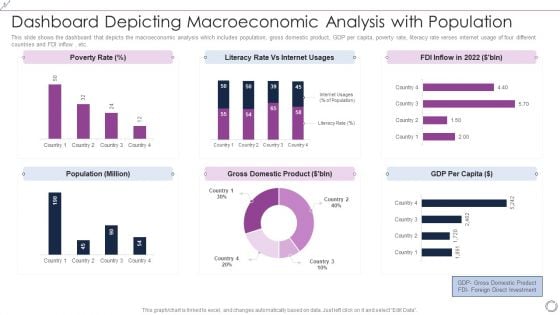
Dashboard Depicting Macroeconomic Analysis With Population Inspiration PDF
This slide shows the dashboard that depicts the macroeconomic analysis which includes population, gross domestic product, GDP per capita, poverty rate, literacy rate verses internet usage of four different countries and FDI inflow, etc. Pitch your topic with ease and precision using this Dashboard Depicting Macroeconomic Analysis With Population Inspiration PDF. This layout presents information on Poverty Rate, Literacy Rate Vs Internet Usages, FDI Inflow In 2022. It is also available for immediate download and adjustment. So, changes can be made in the color, design, graphics or any other component to create a unique layout.
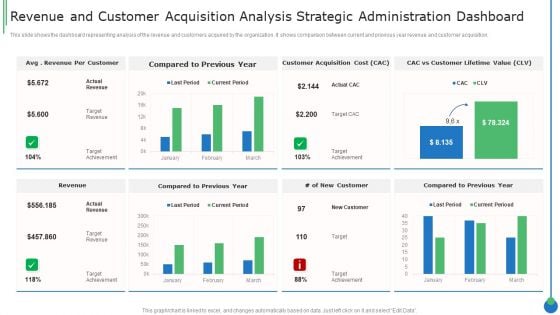
Revenue And Customer Acquisition Analysis Strategic Administration Dashboard Clipart PDF
This slide shows the dashboard representing analysis of the revenue and customers acquired by the organization. It shows comparison between current and previous year revenue and customer acquisition.Pitch your topic with ease and precision using this Revenue And Customer Acquisition Analysis Strategic Administration Dashboard Clipart PDF This layout presents information on Revenue Customer, Compared Previous, Customer Acquisition It is also available for immediate download and adjustment. So, changes can be made in the color, design, graphics or any other component to create a unique layout.
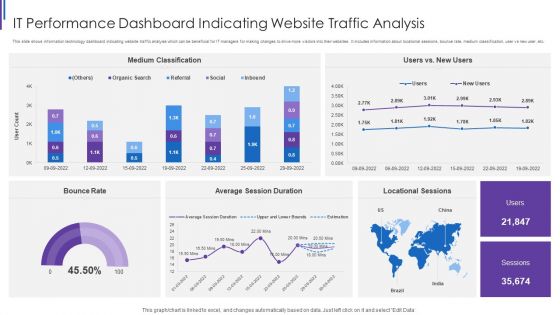
IT Performance Dashboard Indicating Website Traffic Analysis Background PDF
This slide shows information technology dashboard indicating website traffic analysis which can be beneficial for IT managers for making changes to drive more visitors into their websites. It includes information about locational sessions, bounce rate, medium classification, user vs new user, etc. Pitch your topic with ease and precision using this IT Performance Dashboard Indicating Website Traffic Analysis Background PDF. This layout presents information on Medium Classification Rate, Average Session Duration, Locational Sessions Bounce. It is also available for immediate download and adjustment. So, changes can be made in the color, design, graphics or any other component to create a unique layout.
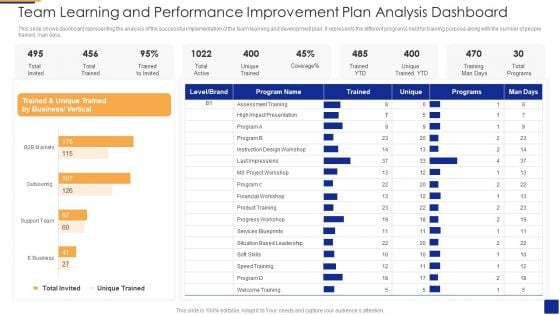
Team Learning And Performance Improvement Plan Analysis Dashboard Designs PDF
This slide shows dashboard representing the analysis of the successful implementation of the team learning and development plan. It represents the different programs held for training purpose along with the number of people trained, man days. Showcasing this set of slides titled Team Learning And Performance Improvement Plan Analysis Dashboard Designs PDF The topics addressed in these templates are Assessment Training, Business Or Vertical, Based Leadership All the content presented in this PPT design is completely editable. Download it and make adjustments in color, background, font etc. as per your unique business setting.
Financial Procedure Dashboard Indicating Yearly Revenue Analysis Icons PDF
This slide illustrates finance process dashboard indicating yearly revenue analysis which contains gross profit margin, operating profit ratio, net profit, revenue and cost of goods sold cogs operating expenses, etc. It can be referred by company owners who can compare it with previous years performance and make related decisions for future. Showcasing this set of slides titled Financial Procedure Dashboard Indicating Yearly Revenue Analysis Icons PDF. The topics addressed in these templates are Operating Profit Percentage, Net Profit Percentage, Operating Profit Ratio. All the content presented in this PPT design is completely editable. Download it and make adjustments in color, background, font etc. as per your unique business setting.
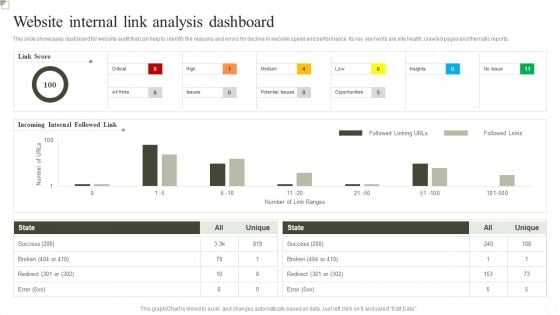
Website Internal Link Analysis Dashboard Ppt Inspiration Outline PDF
This slide showcases dashboard for website Analysis that can help to identify the reasons and errors for decline in website speed and performance. Its key elements are site health, crawled pages and thematic reports. Pitch your topic with ease and precision using this Website Internal Link Analysis Dashboard Ppt Inspiration Outline PDF. This layout presents information on Success, Incoming Internal Followed Link, Link Score. It is also available for immediate download and adjustment. So, changes can be made in the color, design, graphics or any other component to create a unique layout.
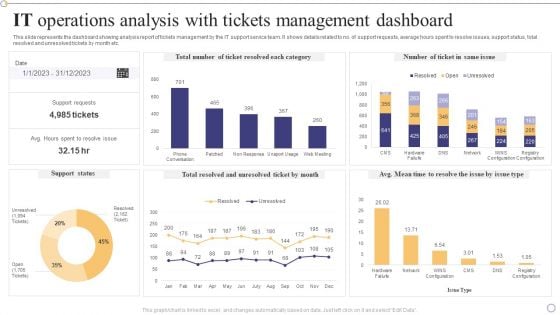
IT Operations Analysis With Tickets Management Dashboard Formats PDF
This slide represents the dashboard showing analysis report of tickets management by the IT support service team. It shows details related to no. of support requests, average hours spent to resolve issues, support status, total resolved and unresolved tickets by month etc.Showcasing this set of slides titled IT Operations Analysis With Tickets Management Dashboard Formats PDF. The topics addressed in these templates are Support Requests, Unresolved Ticket, Support Status. All the content presented in this PPT design is completely editable. Download it and make adjustments in color, background, font etc. as per your unique business setting.
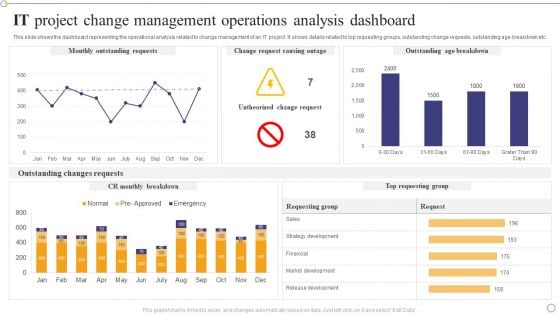
IT Project Change Management Operations Analysis Dashboard Infographics PDF
This slide shows the dashboard representing the operational analysis related to change management of an IT project. It shows details related to top requesting groups, outstanding change requests, outstanding age breakdown etc.Pitch your topic with ease and precision using this IT Project Change Management Operations Analysis Dashboard Infographics PDF. This layout presents information on Outstanding Requests, Outstanding Breakdown, Outstanding Changes. It is also available for immediate download and adjustment. So, changes can be made in the color, design, graphics or any other component to create a unique layout.
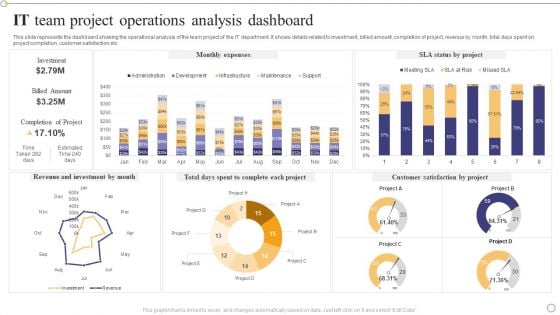
IT Team Project Operations Analysis Dashboard Clipart PDF
This slide represents the dashboard showing the operational analysis of the team project of the IT department. It shows details related to investment, billed amount, completion of project, revenue by month, total days spent on project completion, customer satisfaction etc.Showcasing this set of slides titled IT Team Project Operations Analysis Dashboard Clipart PDF. The topics addressed in these templates are Revenue Investment, Complete Each Project, Customer Satisfaction. All the content presented in this PPT design is completely editable. Download it and make adjustments in color, background, font etc. as per your unique business setting.
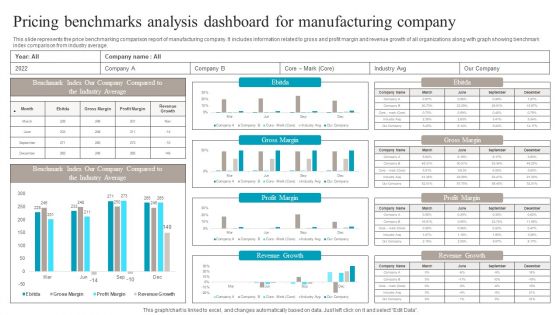
Pricing Benchmarks Analysis Dashboard For Manufacturing Company Structure PDF
This slide represents the price benchmarking comparison report of manufacturing company. It includes information related to gross and profit margin and revenue growth of all organizations along with graph showing benchmark index comparison from industry average. Pitch your topic with ease and precision using this Pricing Benchmarks Analysis Dashboard For Manufacturing Company Structure PDF. This layout presents information on Pricing Benchmarks Analysis, Dashboard For Manufacturing Company. It is also available for immediate download and adjustment. So, changes can be made in the color, design, graphics or any other component to create a unique layout.
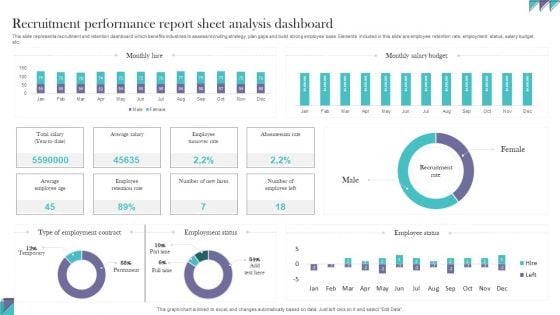
Recruitment Performance Report Sheet Analysis Dashboard Information PDF
This slide represents recruitment and retention dashboard which benefits industries to assess recruiting strategy, plan gaps and build strong employee base. Elements included in this slide are employee retention rate, employment status, salary budget, etc. Pitch your topic with ease and precision using this Recruitment Performance Report Sheet Analysis Dashboard Information PDF. This layout presents information onRecruitment Performance, Report Sheet Analysis. It is also available for immediate download and adjustment. So, changes can be made in the color, design, graphics or any other component to create a unique layout.
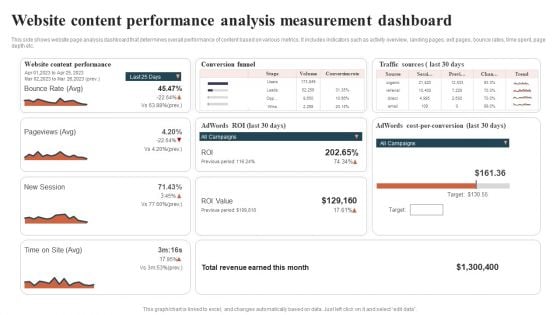
Website Content Performance Analysis Measurement Dashboard Guidelines PDF
This side shows website page analysis dashboard that determines overall performance of content based on various metrics. It includes indicators such as activity overview, landing pages, exit pages, bounce rates, time spent, page depth etc. Showcasing this set of slides titled Website Content Performance Analysis Measurement Dashboard Guidelines PDF. The topics addressed in these templates are Conversion Funnel, Traffic Sources, Total Revenue. All the content presented in this PPT design is completely editable. Download it and make adjustments in color, background, font etc. as per your unique business setting.
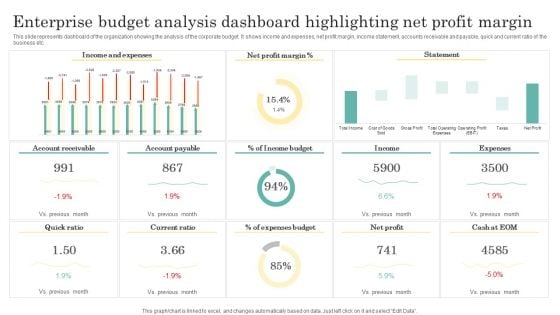
Enterprise Budget Analysis Dashboard Highlighting Net Profit Margin Clipart PDF
This slide represents dashboard of the organization showing the analysis of the corporate budget. It shows income and expenses, net profit margin, income statement, accounts receivable and payable, quick and current ratio of the business etc. Showcasing this set of slides titled Enterprise Budget Analysis Dashboard Highlighting Net Profit Margin Clipart PDF. The topics addressed in these templates are Income And Expenses, Net Profit Margin, Income Budget. All the content presented in this PPT design is completely editable. Download it and make adjustments in color, background, font etc. as per your unique business setting.
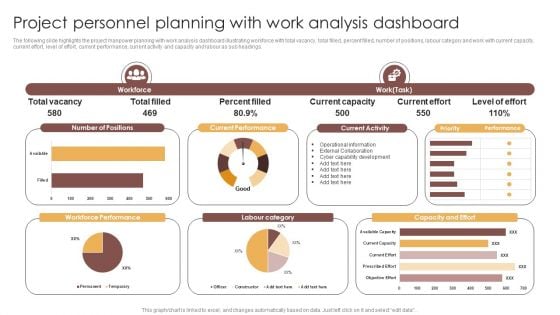
Project Personnel Planning With Work Analysis Dashboard Information PDF
The following slide highlights the project manpower planning with work analysis dashboard illustrating workforce with total vacancy, total filled, percent filled, number of positions, labour category and work with current capacity, current effort, level of effort, current performance, current activity and capacity and labour as sub headings. Showcasing this set of slides titled Project Personnel Planning With Work Analysis Dashboard Information PDF. The topics addressed in these templates are Number Of Positions, Current Performance, Current Activity, Labour Category. All the content presented in this PPT design is completely editable. Download it and make adjustments in color, background, font etc. as per your unique business setting.
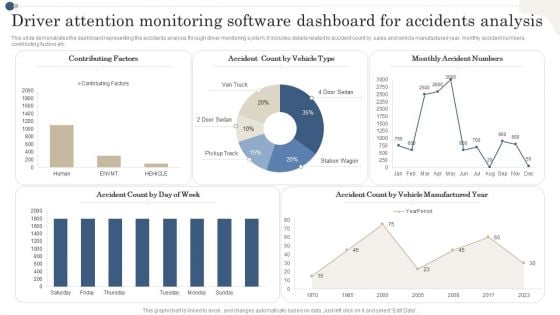
Driver Attention Monitoring Software Dashboard For Accidents Analysis Diagrams PDF
This slide demonstrates the dashboard representing the accidents analysis through driver monitoring system. It includes details related to accident count by sales and vehicle manufactured year, monthly accident numbers, contributing factors etc. Showcasing this set of slides titled Driver Attention Monitoring Software Dashboard For Accidents Analysis Diagrams PDF. The topics addressed in these templates are Contributing Factors,Vehicle Type, Monthly Accident Numbers. All the content presented in this PPT design is completely editable. Download it and make adjustments in color, background, font etc. as per your unique business setting.
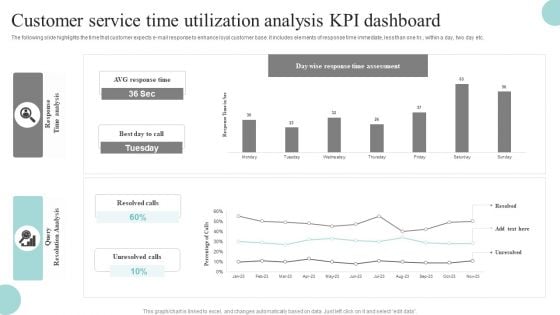
Customer Service Time Utilization Analysis Kpi Dashboard Designs PDF
The following slide highlights the time that customer expects e-mail response to enhance loyal customer base. It includes elements of response time immediate, less than one hr., within a day, two day etc. Showcasing this set of slides titled Customer Service Time Utilization Analysis Kpi Dashboard Designs PDF. The topics addressed in these templates are Customer Service, Time Utilization Analysis, KPI Dashboard. All the content presented in this PPT design is completely editable. Download it and make adjustments in color, background, font etc. as per your unique business setting.
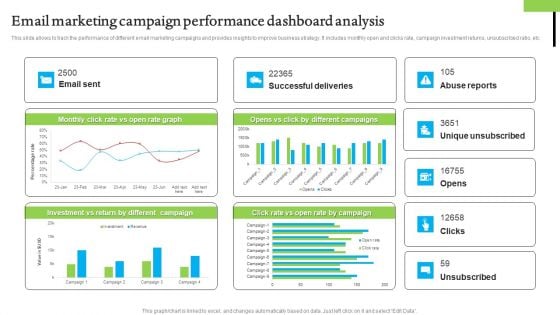
Email Marketing Campaign Performance Dashboard Analysis Information PDF
This slide allows to track the performance of different email marketing campaigns and provides insights to improve business strategy. It includes monthly open and clicks rate, campaign investment returns, unsubscribed ratio, etc. Showcasing this set of slides titled Email Marketing Campaign Performance Dashboard Analysis Information PDF. The topics addressed in these templates are Performance Dashboard Analysis, Email Marketing Campaign. All the content presented in this PPT design is completely editable. Download it and make adjustments in color, background, font etc. as per your unique business setting.
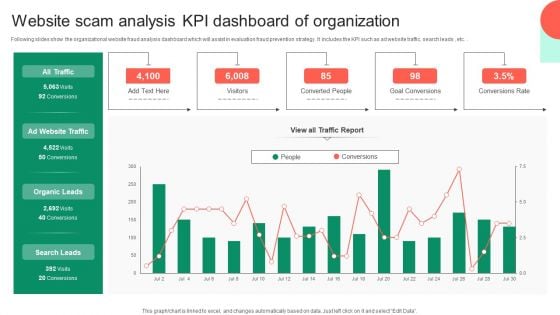
Website Scam Analysis KPI Dashboard Of Organization Sample PDF
Following slides show the organizational website fraud analysis dashboard which will assist in evaluation fraud prevention strategy. It includes the KPI such as ad website traffic, search leads , etc. Showcasing this set of slides titled Website Scam Analysis KPI Dashboard Of Organization Sample PDF. The topics addressed in these templates are Goal Conversions, Conversions Rate, Organic Leads. All the content presented in this PPT design is completely editable. Download it and make adjustments in color, background, font etc. as per your unique business setting.
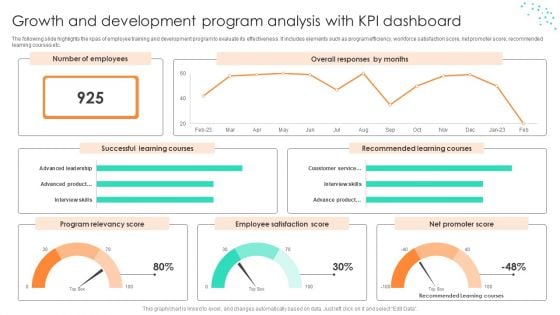
Growth And Development Program Analysis With KPI Dashboard Structure PDF
The following slide highlights the kpas of employee training and development program to evaluate its effectiveness. It includes elements such as program efficiency, workforce satisfaction score, net promoter score, recommended learning courses etc. Pitch your topic with ease and precision using this Growth And Development Program Analysis With KPI Dashboard Structure PDF. This layout presents information on Analysis With KPI Dashboard, Growth And Development Program. It is also available for immediate download and adjustment. So, changes can be made in the color, design, graphics or any other component to create a unique layout.
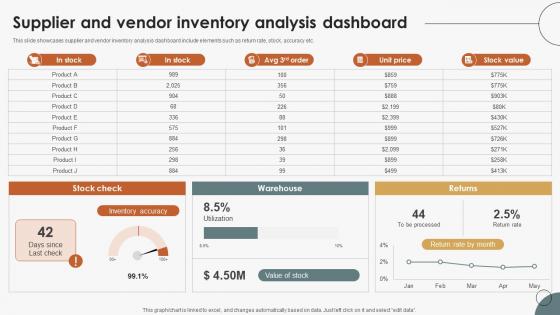
Boosting Efficiency In Inventory Supplier And Vendor Inventory Analysis Dashboard
This slide showcases supplier and vendor inventory analysis dashboard include elements such as return rate, stock, accuracy etc. The best PPT templates are a great way to save time, energy, and resources. Slidegeeks have 100 percent editable powerpoint slides making them incredibly versatile. With these quality presentation templates, you can create a captivating and memorable presentation by combining visually appealing slides and effectively communicating your message. Download Boosting Efficiency In Inventory Supplier And Vendor Inventory Analysis Dashboard from Slidegeeks and deliver a wonderful presentation.

Restaurant Promotion Marketing Analysis Dashboard For Hospitality Company Microsoft PDF
This slide shows the dashboard to be used by the hospitality company for analyzing the restaurant marketing. It includes details related to revenue, cost of revenue, net income, food and beverage revenue by location and type etc.Showcasing this set of slides titled Restaurant Promotion Marketing Analysis Dashboard For Hospitality Company Microsoft PDF The topics addressed in these templates are Beverage Revenue, Food Beverage, Expenses Account All the content presented in this PPT design is completely editable. Download it and make adjustments in color, background, font etc. as per your unique business setting.
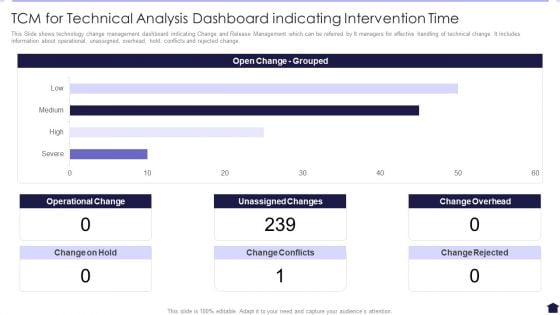
TCM For Technical Analysis Dashboard Indicating Intervention Time Background PDF
This Slide shows technology change management dashboard indicating Change and Release Management which can be referred by It managers for effective handling of technical change. It includes information about operational, unassigned, overhead, hold, conflicts and rejected change. Showcasing this set of slides titled TCM For Technical Analysis Dashboard Indicating Intervention Time Background PDF. The topics addressed in these templates are Operational Change, Unassigned Changes, Change Overhead. All the content presented in this PPT design is completely editable. Download it and make adjustments in color, background, font etc. as per your unique business setting.
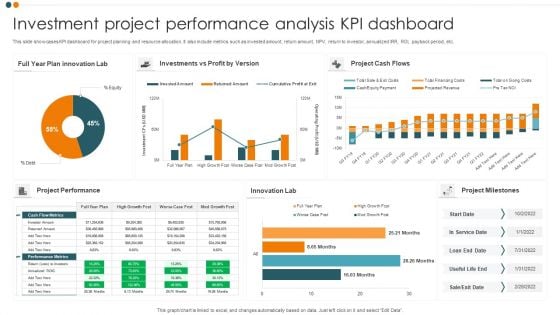
Investment Project Performance Analysis KPI Dashboard Professional PDF
This slide showcases KPI dashboard for project planning and resource allocation. It also include metrics such as invested amount, return amount, NPV, return to investor, annualized IRR, ROI, payback period, etc. Pitch your topic with ease and precision using this Investment Project Performance Analysis KPI Dashboard Professional PDF. This layout presents information on Project Cash Flows, Project Performance, Innovation Lab. It is also available for immediate download and adjustment. So, changes can be made in the color, design, graphics or any other component to create a unique layout.
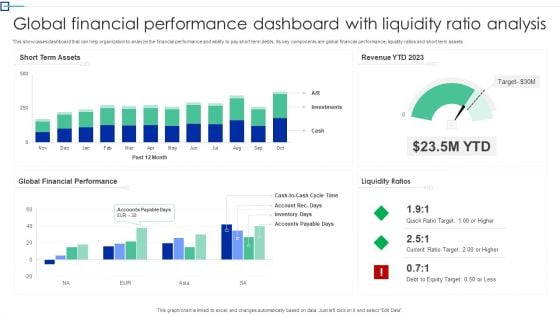
Global Financial Performance Dashboard With Liquidity Ratio Analysis Information PDF
This showcases dashboard that can help organization to analyze the financial performance and ability to pay short term debts. Its key components are global financial performance, liquidity ratios and short term assets. Pitch your topic with ease and precision using this Global Financial Performance Dashboard With Liquidity Ratio Analysis Information PDF. This layout presents information on Short Term Assets, Global Financial Performance, Liquidity Ratios. It is also available for immediate download and adjustment. So, changes can be made in the color, design, graphics or any other component to create a unique layout.
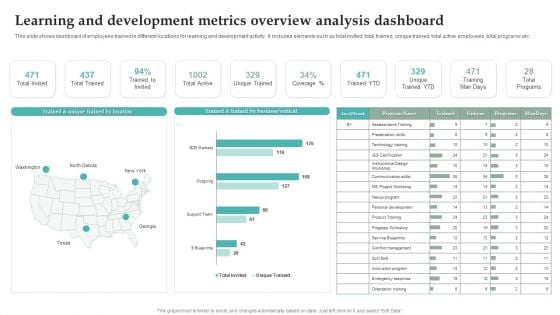
Learning And Development Metrics Overview Analysis Dashboard Graphics PDF
This slide shows dashboard of employees trained in different locations for learning and development activity. It includes elements such as total invited, total trained, unique trained, total active employees, total programs etc. Pitch your topic with ease and precision using this Learning And Development Metrics Overview Analysis Dashboard Graphics PDF. This layout presents information on Unique Trained YTD, Training Man Days, Total Programs. It is also available for immediate download and adjustment. So, changes can be made in the color, design, graphics or any other component to create a unique layout.
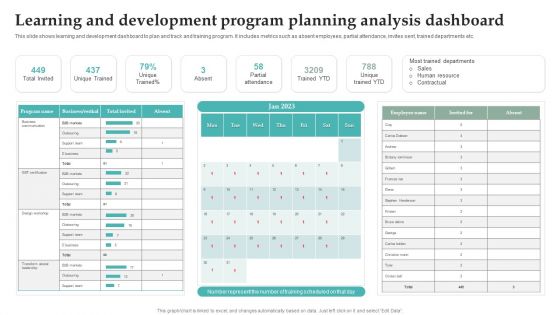
Learning And Development Program Planning Analysis Dashboard Information PDF
This slide shows learning and development dashboard to plan and track and training program. It includes metrics such as absent employees, partial attendance, invites sent, trained departments etc. Showcasing this set of slides titled Learning And Development Program Planning Analysis Dashboard Information PDF. The topics addressed in these templates are Partial Attendance, Trained YTD, Unique Trained YTD. All the content presented in this PPT design is completely editable. Download it and make adjustments in color, background, font etc. as per your unique business setting.
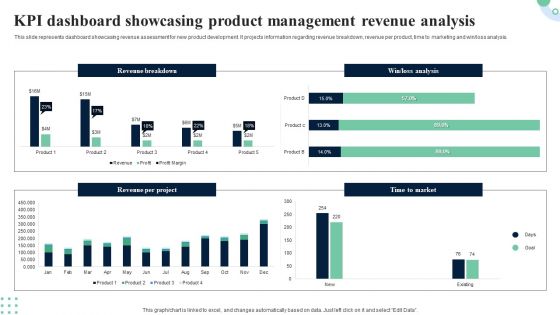
KPI Dashboard Showcasing Product Management Revenue Analysis Portrait PDF
This slide provides dashboard showcasing product development project overview with completion status. It provides information regarding cash flow statements, completion progress, project overview and product approval status. Pitch your topic with ease and precision using this KPI Dashboard Showcasing Product Management Revenue Analysis Portrait PDF. This layout presents information on Completion Progress, Product Approval Status, Cash Flow Statements. It is also available for immediate download and adjustment. So, changes can be made in the color, design, graphics or any other component to create a unique layout.
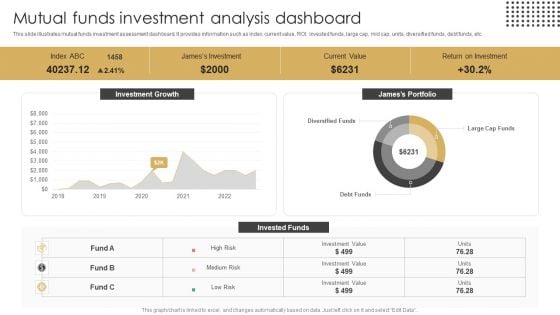
Mutual Funds Investment Analysis Dashboard Ppt Outline Background Images PDF
This slide illustrates mutual funds investment assessment dashboard. It provides information such as index, current value, ROI, invested funds, large cap, mid cap, units, diversified funds, debt funds, etc. Pitch your topic with ease and precision using this Mutual Funds Investment Analysis Dashboard Ppt Outline Background Images PDF. This layout presents information on Current Value, Return On Investment, Jamess Portfolio. It is also available for immediate download and adjustment. So, changes can be made in the color, design, graphics or any other component to create a unique layout.
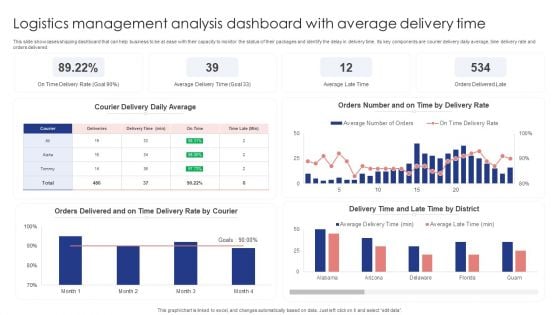
Logistics Management Analysis Dashboard With Average Delivery Time Themes PDF
This slide showcases shipping dashboard that can help business to be at ease with their capacity to monitor the status of their packages and identify the delay in delivery time. Its key components are courier delivery daily average, time delivery rate and orders delivered. Showcasing this set of slides titled Logistics Management Analysis Dashboard With Average Delivery Time Themes PDF. The topics addressed in these templates are Courier Delivery Daily Average, Delivery Rate, Orders Delivered. All the content presented in this PPT design is completely editable. Download it and make adjustments in color, background, font etc. as per your unique business setting.
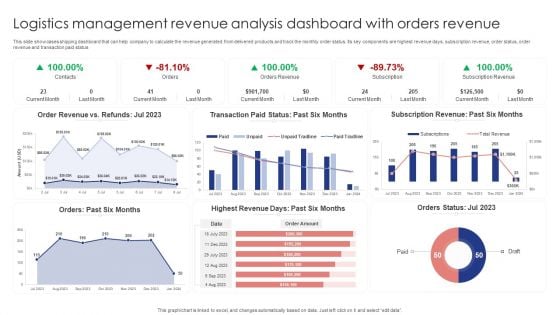
Logistics Management Revenue Analysis Dashboard With Orders Revenue Brochure PDF
This slide showcases shipping dashboard that can help company to calculate the revenue generated from delivered products and track the monthly order status. Its key components are highest revenue days, subscription revenue, order status, order revenue and transaction paid status. Showcasing this set of slides titled Logistics Management Revenue Analysis Dashboard With Orders Revenue Brochure PDF. The topics addressed in these templates are Order Revenue, Transaction Paid, Subscription Revenue. All the content presented in this PPT design is completely editable. Download it and make adjustments in color, background, font etc. as per your unique business setting.
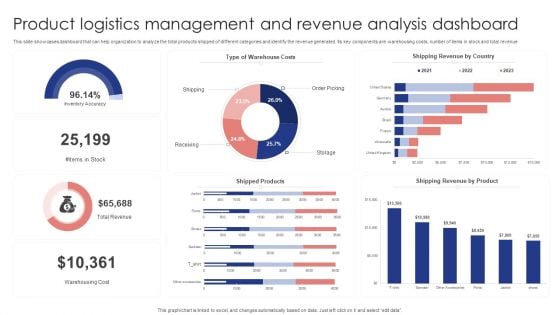
Product Logistics Management And Revenue Analysis Dashboard Demonstration PDF
This slide showcases dashboard that can help organization to analyze the total products shipped of different categories and identify the revenue generated. Its key components are warehousing costs, number of items in stock and total revenue. Pitch your topic with ease and precision using this Product Logistics Management And Revenue Analysis Dashboard Demonstration PDF. This layout presents information on Warehouse Costs, Shipping Revenue Country, Shipped Products . It is also available for immediate download and adjustment. So, changes can be made in the color, design, graphics or any other component to create a unique layout.
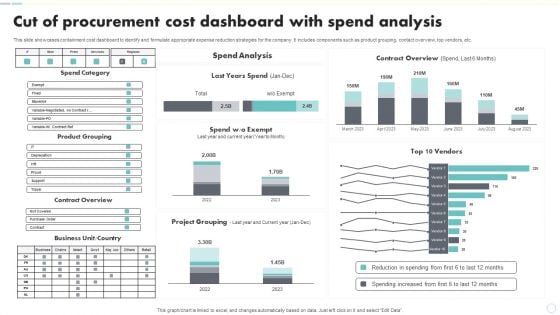
Cut Of Procurement Cost Dashboard With Spend Analysis Elements PDF
This slide showcases containment cost dashboard to identify and formulate appropriate expense reduction strategies for the company. It includes components such as product grouping, contact overview, top vendors, etc. Showcasing this set of slides titled Cut Of Procurement Cost Dashboard With Spend Analysis Elements PDF. The topics addressed in these templates are Spend Category, Product Grouping, Contract Overview. All the content presented in this PPT design is completely editable. Download it and make adjustments in color, background, font etc. as per your unique business setting.
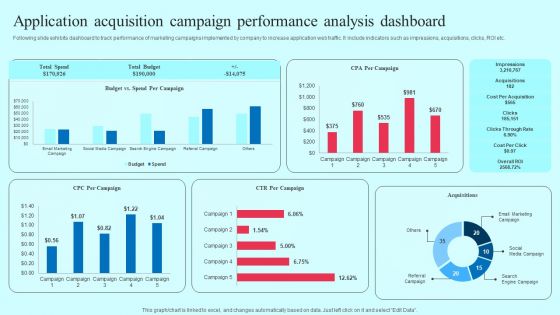
Application Acquisition Campaign Performance Analysis Dashboard Information PDF
Following slide exhibits dashboard to track performance of marketing campaigns implemented by company to increase application web traffic. It include indicators such as impressions, acquisitions, clicks, ROI etc. Find a pre designed and impeccable Application Acquisition Campaign Performance Analysis Dashboard Information PDF. The templates can ace your presentation without additional effort. You can download these easy to edit presentation templates to make your presentation stand out from others. So, what are you waiting for Download the template from Slidegeeks today and give a unique touch to your presentation.
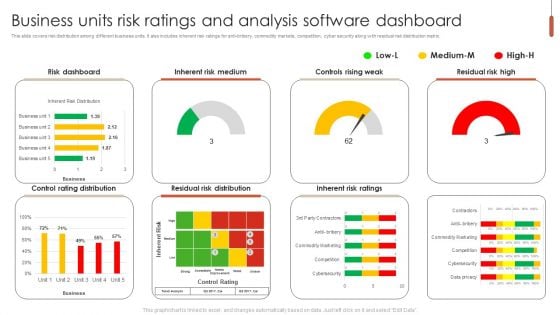
Business Units Risk Ratings And Analysis Software Dashboard Ideas PDF
This slide covers risk distribution among different business units. It also includes inherent risk ratings for anti-bribery, commodity markets, competition, cyber security along with residual risk distribution matrix. Pitch your topic with ease and precision using this Business Units Risk Ratings And Analysis Software Dashboard Ideas PDF. This layout presents information on Risk Dashboard, Inherent Risk Medium, Controls Rising Weak. It is also available for immediate download and adjustment. So, changes can be made in the color, design, graphics or any other component to create a unique layout.
Hyperautomation Performance Tracking Dashboard Hyperautomation Software Solutions IT Summary PDF
This slide depicts the performance tracking dashboard for hyper-automation, covering the number of rules triggered, automated emails, average originator, recipient, average click-through rate for automated emails, and quick links.Formulating a presentation can take up a lot of effort and time, so the content and message should always be the primary focus. The visuals of the PowerPoint can enhance the presenters message, so our Hyperautomation Performance Tracking Dashboard Hyperautomation Software Solutions IT Summary PDF was created to help save time. Instead of worrying about the design, the presenter can concentrate on the message while our designers work on creating the ideal templates for whatever situation is needed. Slidegeeks has experts for everything from amazing designs to valuable content, we have put everything into Hyperautomation Performance Tracking Dashboard Hyperautomation Software Solutions IT Summary PDF.
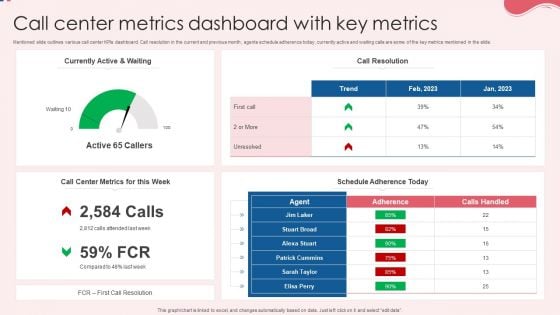
Call Center Metrics Dashboard With Key Metrics Information PDF
Mentioned slide outlines various call center KPIs dashboard. Call resolution in the current and previous month, agents schedule adherence today, currently active and waiting calls are some of the key metrics mentioned in the slide. Showcasing this set of slides titled Call Center Metrics Dashboard With Key Metrics Information PDF. The topics addressed in these templates are Currently Active, Call Resolution, Key Metrics. All the content presented in this PPT design is completely editable. Download it and make adjustments in color, background, font etc. as per your unique business setting.
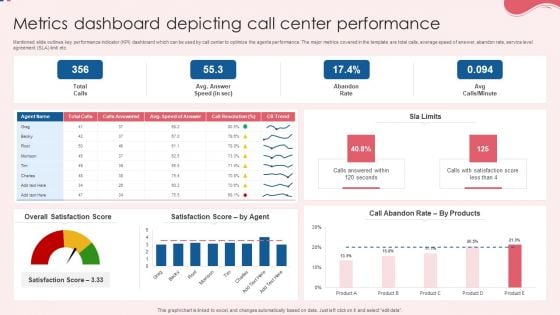
Metrics Dashboard Depicting Call Center Performance Pictures PDF
Mentioned slide outlines key performance indicator KPI dashboard which can be used by call center to optimize the agents performance. The major metrics covered in the template are total calls, average speed of answer, abandon rate, service level agreement SLA limit etc. Pitch your topic with ease and precision using this Metrics Dashboard Depicting Call Center Performance Pictures PDF. This layout presents information on Overall Satisfaction Score, Satisfaction Score, Performance. It is also available for immediate download and adjustment. So, changes can be made in the color, design, graphics or any other component to create a unique layout.

 Home
Home