Survey Dashboard
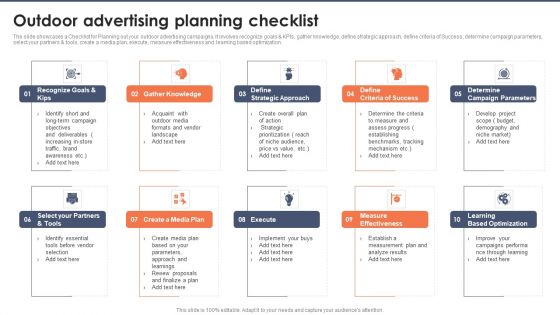
Outdoor Advertising Planning Checklist Designs PDF
The slide showcases a Checklist for Planning out your outdoor advertising campaigns. It involves recognize goals and KPIs, gather knowledge, define strategic approach, define criteria of Success, determine campaign parameters, select your partners and tools, create a media plan, execute, measure effectiveness and learning based optimization. Presenting Outdoor Advertising Planning Checklist Designs PDF to dispense important information. This template comprises six stages. It also presents valuable insights into the topics including Media Plane, Define Strategic Approach, Determine Campaign Parameters. This is a completely customizable PowerPoint theme that can be put to use immediately. So, download it and address the topic impactfully.
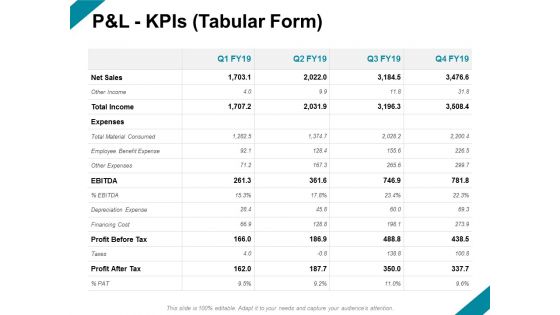
Pandl Kpis Tabular Form Ppt PowerPoint Presentation File Format
Presenting this set of slides with name pandl kpis tabular form ppt powerpoint presentation file format. The topics discussed in these slides are business, management, planning, strategy, marketing. This is a completely editable PowerPoint presentation and is available for immediate download. Download now and impress your audience.
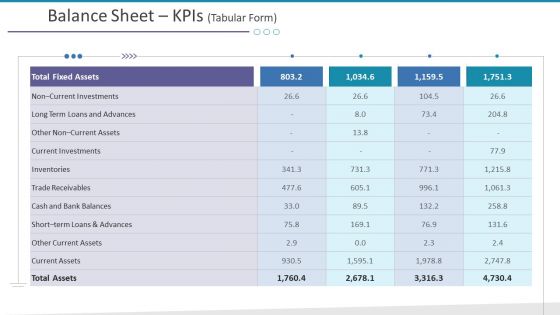
Balance Sheet Kpis Tabular Form Investments Ppt Slides Display PDF
Deliver an awe-inspiring pitch with this creative balance sheet kpis tabular form investments ppt slides display pdf. bundle. Topics like long term loans and advances, short term loans and advances can be discussed with this completely editable template. It is available for immediate download depending on the needs and requirements of the user.

Balance Sheet Kpis Tabular Form Provisions Ppt Layouts Display
Deliver and pitch your topic in the best possible manner with this balance sheet kpis tabular form provisions ppt layouts display. Use them to share invaluable insights on shareholders equity, short term provisions and impress your audience. This template can be altered and modified as per your expectations. So, grab it now.
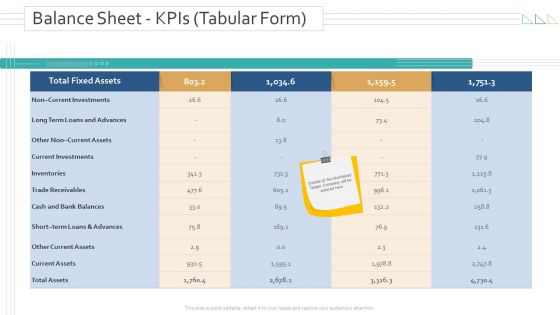
Amalgamation Acquisitions Balance Sheet KPIs Tabular Form Assets Sample PDF
Deliver an awe-inspiring pitch with this creative amalgamation acquisitions balance sheet kpis tabular form assets sample pdf bundle. Topics like current assets, trade receivables, current investments, inventories can be discussed with this completely editable template. It is available for immediate download depending on the needs and requirements of the user.
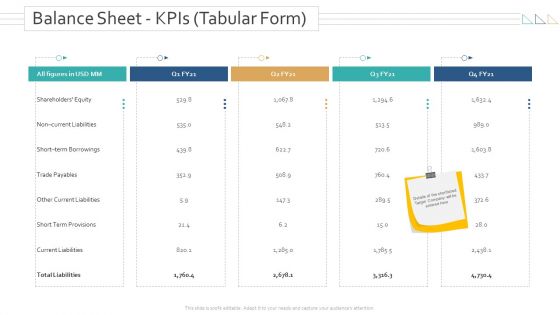
Amalgamation Acquisitions Balance Sheet KPIs Tabular Form Formats PDF
Deliver and pitch your topic in the best possible manner with this amalgamation acquisitions balance sheet kpis tabular form formats pdf. Use them to share invaluable insights on shareholders equity, current liabilities, trade payables and impress your audience. This template can be altered and modified as per your expectations. So, grab it now.

Amalgamation Acquisitions Cash Flow Statement KPIs Tabular Form Professional PDF
Deliver and pitch your topic in the best possible manner with this amalgamation acquisitions cash flow statement kpis tabular form professional pdf. Use them to share invaluable insights on cash equivalents, financing activities, investing activities, cash flow, operations and impress your audience. This template can be altered and modified as per your expectations. So, grab it now.

Monthly Company Performance Analysisbalance Sheet Kpis Tabular Form Background PDF
Deliver and pitch your topic in the best possible manner with this monthly company performance analysisbalance sheet kpis tabular form background pdf. Use them to share invaluable insights on current investments, total assets and impress your audience. This template can be altered and modified as per your expectations. So, grab it now.
Strategies To Future Plans Marketing Trends Icons PDF
This slide illustrates the set of tactics for any organization to implement and compete in the emerging marketing trends. It incorporates virtual reality, voice marketing, data driven decision making and blockchain technology. Persuade your audience using this Strategies To Future Plans Marketing Trends Icons PDF. This PPT design covers four stages, thus making it a great tool to use. It also caters to a variety of topics including Virtual Reality, Voice Marketing, Data Driven Decisions. Download this PPT design now to present a convincing pitch that not only emphasizes the topic but also showcases your presentation skills.

Forecast Analysis Technique IT Steps To Build Predictive Algorithm Models Mockup PDF
This slide discusses the steps required to create predictive algorithm models for business processes. The steps include defining scope and scale, profile data, information collection, cleaning, and integrating, comprising analytics in business processes, and tracking models and business results. Do you have an important presentation coming up Are you looking for something that will make your presentation stand out from the rest Look no further than Forecast Analysis Technique IT Steps To Build Predictive Algorithm Models Mockup PDF. With our professional designs, you can trust that your presentation will pop and make delivering it a smooth process. And with Slidegeeks, you can trust that your presentation will be unique and memorable. So why wait Grab Forecast Analysis Technique IT Steps To Build Predictive Algorithm Models Mockup PDF today and make your presentation stand out from the rest.

Data Collection And Analysis Flow Chart Ppt PowerPoint Presentation Ideas Images
This is a data collection and analysis flow chart ppt powerpoint presentation ideas images. This is a five stage process. The stages in this process are flow, marketing, strategy, process, arrows.
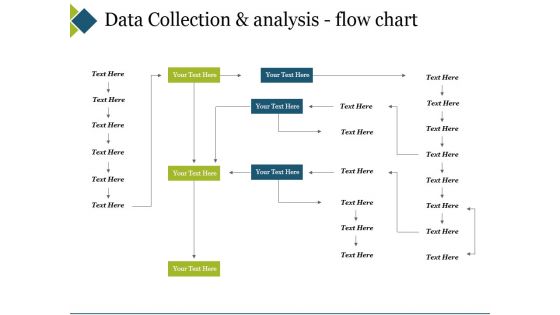
Data Collection And Analysis Flow Chart Ppt PowerPoint Presentation Model Rules
This is a data collection and analysis flow chart ppt powerpoint presentation model rules. This is a six stage process. The stages in this process are business, marketing, management, planning, chart.
Business Diagram Battery Icon With Power Icons Energy Technology PowerPoint Slide
This business diagram displays battery icon with power charging. Use this diagram, in your presentations to display energy saving, battery and technology. Create professional presentations using this diagram slide.
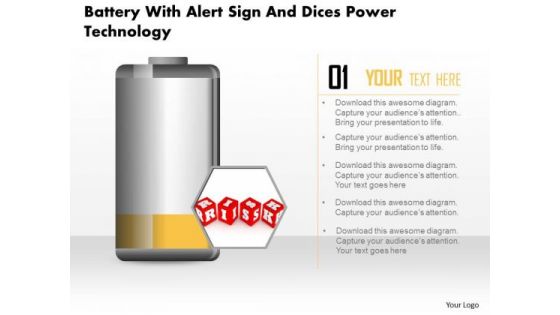
Business Diagram Battery With Alert Sign And Dices Power Technology PowerPoint Slide
This business diagram displays risk alert on battery icon. Use this diagram, in your presentations to display energy saving, battery and technology. Create professional presentations using this diagram slide.
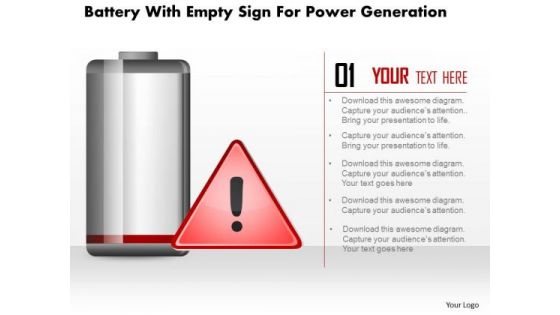
Business Diagram Battery With Empty Sign For Power Generation PowerPoint Slide
This business diagram displays empty sign alert on battery icon. Use this diagram, in your presentations to display energy saving, battery and technology. Create professional presentations using this diagram slide.
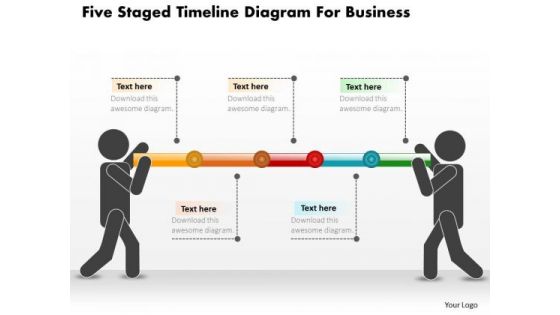
Business Diagram Five Staged Timeline Diagram For Business PowerPoint Slide
This PowerPoint template displays five points timeline diagram. This business diagram has been designed with graphic of timeline with five points, text space and start, end points. Use this diagram, in your presentations to display process steps, stages, timelines and business management. Make wonderful presentations using this business slide.
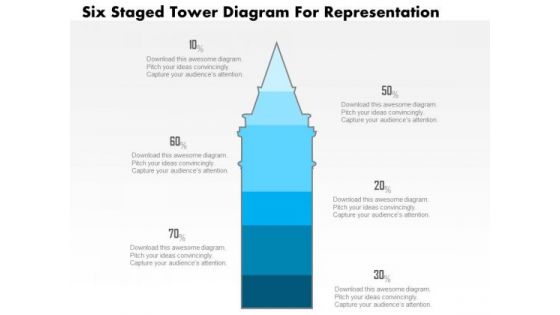
Business Diagram Five Staged Tower Diagram For Representation PowerPoint Slide
This business slide displays five staged tower diagram. It contains blue tower graphic divided into five parts. This diagram slide depicts processes, stages, steps, points, options information display. Use this diagram, in your presentations to express your views innovatively.
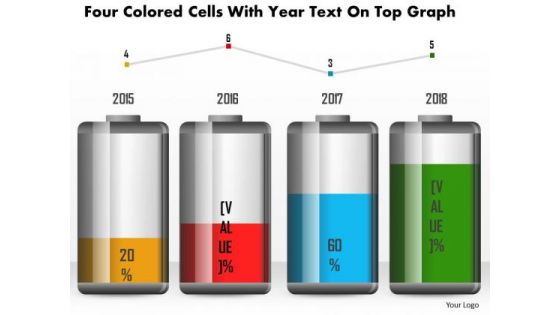
Business Diagram Four Colored Cells With Year Text On Top Graph PowerPoint Slide
This business diagram has been designed with battery cell graphic for business timeline. This slide can be used for business planning and management. Use this diagram for your business and success milestones related presentations.
Business Diagram Green Battery Cell With Full Charging Symbol PowerPoint Slide
This business diagram displays full battery charge icon. Use this diagram, in your presentations to display energy saving, battery and technology. Create professional presentations using this diagram slide.
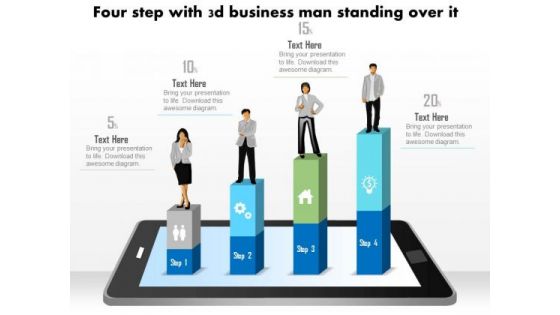
Business Diagram Four Steps With 3d Business Person Standing Over It PowerPoint Slide
This business diagram displays bar graph with business person standing on it. This Power Point template has been designed to display personal growth. You may use this diagram to impart professional appearance to your presentations.
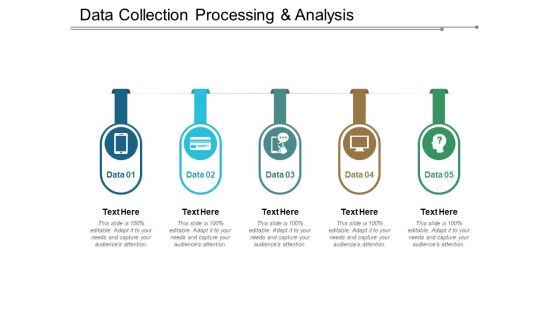
Data Collection Processing And Analysis Ppt PowerPoint Presentation Pictures Infographics
This is a data collection processing and analysis ppt powerpoint presentation pictures infographics. This is a five stage process. The stages in this process are data flow, data management, big data.

Comparative Analysis Of Data Migration Strategic Plan Diagrams PDF
The following slide represents the comparative assessment of various types of data migration strategies to select the best based on the requirements. It includes elements such as scalability, cost effectiveness, safety, accessibility etc. Presenting Comparative Analysis Of Data Migration Strategic Plan Diagrams PDF to dispense important information. This template comprises one stages. It also presents valuable insights into the topics including Cost Effective, Application, Cloud. This is a completely customizable PowerPoint theme that can be put to use immediately. So, download it and address the topic impactfully.
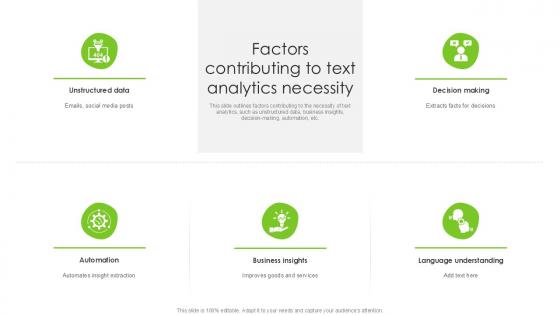
Factors Contributing To Text Analytics Necessity PPT Sample SS
This slide outlines factors contributing to the necessity of text analytics, such as unstructured data, business insights, decision-making, automation, etc. Formulating a presentation can take up a lot of effort and time, so the content and message should always be the primary focus. The visuals of the PowerPoint can enhance the presenters message, so our Factors Contributing To Text Analytics Necessity PPT Sample SS was created to help save time. Instead of worrying about the design, the presenter can concentrate on the message while our designers work on creating the ideal templates for whatever situation is needed. Slidegeeks has experts for everything from amazing designs to valuable content, we have put everything into Factors Contributing To Text Analytics Necessity PPT Sample SS

Big Data Benefits Analytics In Healthcare Ppt PowerPoint Presentation Example 2015
This is a big data benefits analytics in healthcare ppt powerpoint presentation example 2015. This is a four stage process. The stages in this process are increased efficiency, better business decision making, improved customer experience and engagement, achieved financial savings.
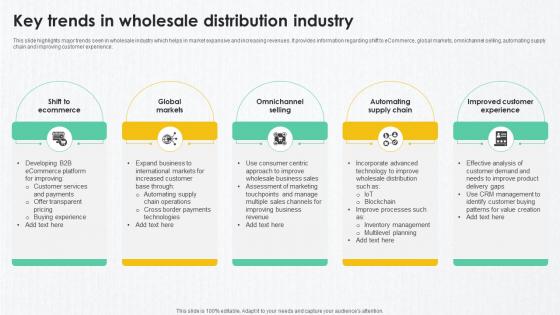
B2B Marketing Techniques Key Trends In Wholesale Distribution Industry
This slide highlights major trends seen in wholesale industry which helps in market expansive and increasing revenues. It provides information regarding shift to eCommerce, global markets, omnichannel selling, automating supply chain and improving customer experience. Do you have an important presentation coming up Are you looking for something that will make your presentation stand out from the rest Look no further than B2B Marketing Techniques Key Trends In Wholesale Distribution Industry. With our professional designs, you can trust that your presentation will pop and make delivering it a smooth process. And with Slidegeeks, you can trust that your presentation will be unique and memorable. So why wait Grab B2B Marketing Techniques Key Trends In Wholesale Distribution Industry today and make your presentation stand out from the rest
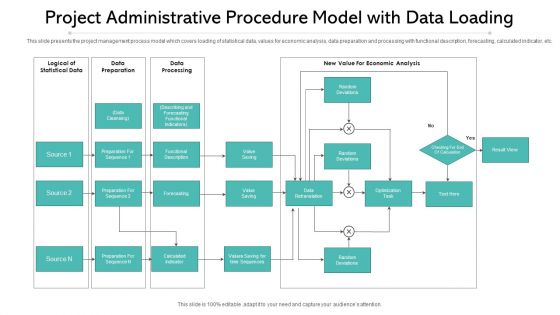
Project Administrative Procedure Model With Data Loading Ppt PowerPoint Presentation Gallery Background Image PDF
This slide presents the project management process model which covers loading of statistical data, values for economic analysis, data preparation and processing with functional description, forecasting, calculated indicator, etc. Showcasing this set of slides titled project administrative procedure model with data loading ppt powerpoint presentation gallery background image pdf. The topics addressed in these templates are logical of statistical data, data preparation, data processing, forecasting. All the content presented in this PPT design is completely editable. Download it and make adjustments in color, background, font etc. as per your unique business setting.
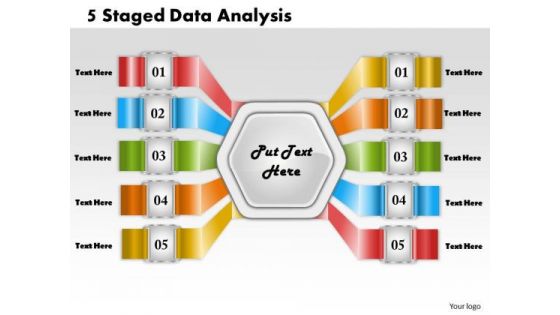
Business Strategy 5 Staged Data Analysis Strategic Plan Example Ppt Slide
Double Your Chances With Our business strategy 5 staged data analysis strategic plan example ppt slide Powerpoint Templates. The Value Of Your Thoughts Will Increase Two-Fold. Charm The Audience With Your Thoughts. Add Our Process and Flows Powerpoint Templates And They Will Be Dotty For You.

Four Steps Of Financial Growth Analysis Powerpoint Slides
This PowerPoint template with multiple Hexagons can be creatively used to present a timeline in a visual manner. This slide can also help the audience understand a 6 step process in an easier manner. The icons are totally customizable and can be edited to represent the particular process happening at that stage. It can also be used to represent different times or different activities to be carried out at different times in in a day in an office or an organization (e.g. - Medicine schedule) since the hexagon represents a clock and change of shade moves in a clockwise manner. The diagram can be used to represent a comparison or a report or an analysis of the data.
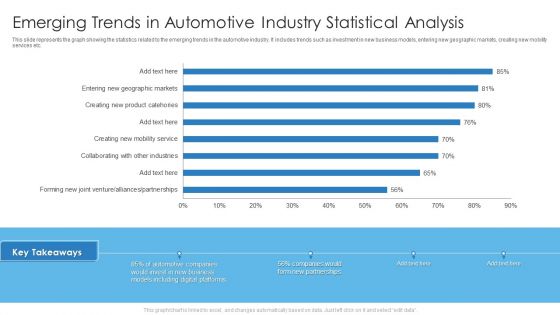
Emerging Trends In Automotive Industry Statistical Analysis Mockup PDF
This slide represents the graph showing the statistics related to the emerging trends in the automotive industry. It includes trends such as investment in new business models, entering new geographic markets, creating new mobility services etc. Deliver an awe inspiring pitch with this creative Emerging Trends In Automotive Industry Statistical Analysis Mockup PDF bundle. Topics like Emerging Trends In Automotive, Industry Statistical Analysis can be discussed with this completely editable template. It is available for immediate download depending on the needs and requirements of the user.

Example Of Data Management And Analysis Process Diagram Slides
Presenting this set of slides with name example of data management and analysis process diagram slides. This is a six stage process. The stages in this process are data governance, data structure, data architecture, master data and metadata, data security, data quality. This is a completely editable PowerPoint presentation and is available for immediate download. Download now and impress your audience.
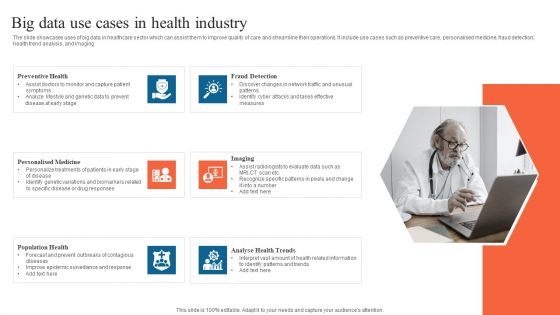
Big Data Use Cases In Health Industry Guidelines PDF
The slide showcases uses of big data in healthcare sector which can assist them to improve quality of care and streamline their operations. It include use cases such as preventive care, personalised medicine, fraud detection, health trend analysis, and imaging. Presenting Big Data Use Cases In Health Industry Guidelines PDF to dispense important information. This template comprises six stages. It also presents valuable insights into the topics including Fraud Detection, Imaging, Analyse Health Trends. This is a completely customizable PowerPoint theme that can be put to use immediately. So, download it and address the topic impactfully.
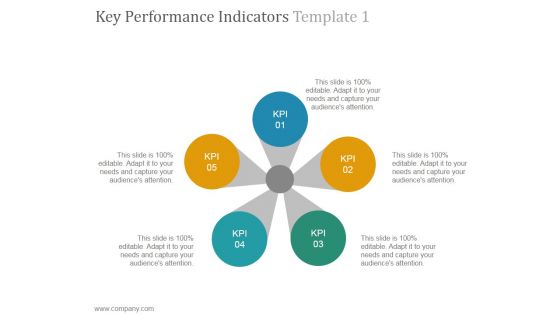
Key Performance Indicators Template 1 Ppt PowerPoint Presentation Inspiration
This is a key performance indicators template 1 ppt powerpoint presentation inspiration. This is a five stage process. The stages in this process are circle, loop, business, process, flow.
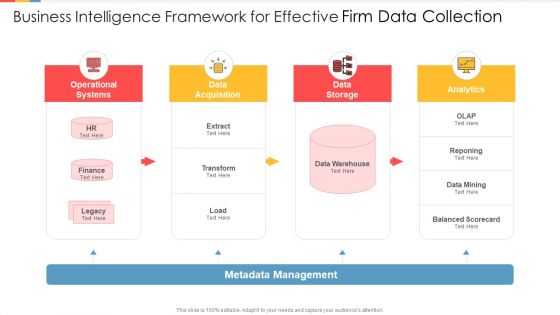
Business Intelligence Framework For Effective Firm Data Collection Ideas PDF
Presenting business intelligence framework for effective firm data collection ideas pdf to dispense important information. This template comprises four stages. It also presents valuable insights into the topics including operational systems, data acquisition, data storage, analytics. This is a completely customizable PowerPoint theme that can be put to use immediately. So, download it and address the topic impactfully.

Content Marketing Strategy With Key Performance Indicators Microsoft PDF
This template covers table for implementing content marketing strategy. It includes details such as goals throughout customer journey, objectives, strategic action steps, and key performance indicators. Presenting Content Marketing Strategy With Key Performance Indicators Microsoft PDF to dispense important information. This template comprises four stages. It also presents valuable insights into the topics including Resource, Strategic, Cost. This is a completely customizable PowerPoint theme that can be put to use immediately. So, download it and address the topic impactfully.

Big Data Analysis Techniques Circular Diagrams Ppt PowerPoint Presentation Shapes
This is a big data analysis techniques circular diagrams ppt powerpoint presentation shapes. This is a nine stage process. The stages in this process are data fusion, data integration, genetic algorithm, machine learning, simulation.

Benchmark Analysis For Data Security Software Mockup PDF
This slide shows comparison analysis of different data security software in order to choose the most suitable one. It include benchmarks like data privacy, data integrity and authentication etc. Showcasing this set of slides titled Benchmark Analysis For Data Security Software Mockup PDF. The topics addressed in these templates are Data Privacy, Data Integrity, Authentication. All the content presented in this PPT design is completely editable. Download it and make adjustments in color, background, font etc. as per your unique business setting.

Addressing The Priority Deliverables To Achieve World Class Data Infrastructure Information PDF
Purpose of this slide is to provide information about the deliverables to accomplish online community. It includes details about activities to perform, budget, duration, key partners, owner, status and KPIs. Are you in need of a template that can accommodate all of your creative concepts This one is crafted professionally and can be altered to fit any style. Use it with Google Slides or PowerPoint. Include striking photographs, symbols, depictions, and other visuals. Fill, move around, or remove text boxes as desired. Test out color palettes and font mixtures. Edit and save your work, or work with colleagues. Download Addressing The Priority Deliverables To Achieve World Class Data Infrastructure Information PDF and observe how to make your presentation outstanding. Give an impeccable presentation to your group and make your presentation unforgettable.
Business Management Audit System Ppt PowerPoint Presentation Icon
This is a business management audit system ppt powerpoint presentation icon. This is a four stage process. The stages in this process are collect data, perform a random data sample for each audit procedure, track activity, assist in the creation of the final report.

Data Project Analysis Lifecycle To Streamline Operations Diagrams PDF
This slide covers data project analysis lifecycle to streamline operations. It involves six steps such as business understanding, data understanding, data preparation, data analysis, validation and visualization.Persuade your audience using this Data Project Analysis Lifecycle To Streamline Operations Diagrams PDF. This PPT design covers six stages, thus making it a great tool to use. It also caters to a variety of topics including Business Understanding, Data Understanding, Data Preparation. Download this PPT design now to present a convincing pitch that not only emphasizes the topic but also showcases your presentation skills.
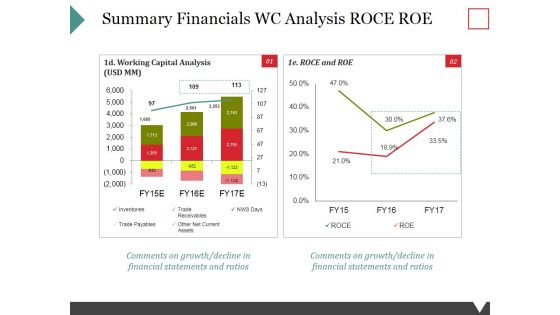
Summary Financials Wc Analysis Roce Roe Ppt PowerPoint Presentation Show Inspiration
This is a summary financials wc analysis roce roe ppt powerpoint presentation show inspiration. This is a two stage process. The stages in this process are inventories, trade payables, trade receivables, other net current assets, nws days.
Business Diagram Icons And Charts For Business Growth Presentation Template
Our above slide contains graphics of business charts and icons. It helps to display business reports and analysis. Use this diagram to impart more clarity to data and to create more sound impact on viewers.
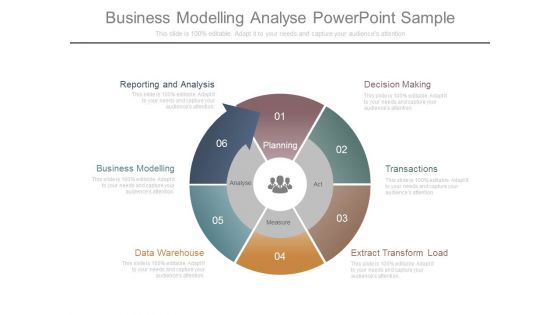
Business Modelling Analyse Powerpoint Sample
This is a business modelling analyse powerpoint sample. This is a six stage process. The stages in this process are decision making, transactions, extract transform load, data warehouse, business modelling, reporting and analysis, planning, act, measure, analyse.

Trading Computerized System Diagram Presentation Ideas
This is a trading computerized system diagram presentation ideas. This is a six stage process. The stages in this process are planning, report, convert, data management, attract, analysis bi.

Enterprising Programmed Model Template Example Of Ppt
This is a enterprising programmed model template example of ppt. This is a eight stage process. The stages in this process are `planning, attract, convert, data management, report, response management, analysis, design content.

Social Media Corporate Objectives With Key Performance Indicators Pictures PDF
This slide contains social media objectives to be accomplished by managers for improving business performance. It includes objectives such as brand awareness, customer satisfaction and brand engagement. Presenting Social Media Corporate Objectives With Key Performance Indicators Pictures PDF to dispense important information. This template comprises four stages. It also presents valuable insights into the topics including Objectives, Description, Key Performance Indicators . This is a completely customizable PowerPoint theme that can be put to use immediately. So, download it and address the topic impactfully.

Data Mining Segmentation And Analysis Ppt PowerPoint Presentation Slides
This is a data mining segmentation and analysis ppt powerpoint presentation slides. This is a four stage process. The stages in this process are cluster analysis, cluster examination, cluster investigation.
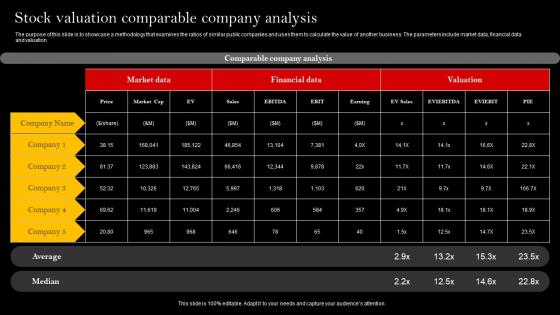
Stock Valuation Comparable Company Analysis Microsoft Pdf
The purpose of this slide is to showcase a methodology that examines the ratios of similar public companies and uses them to calculate the value of another business. The parameters include market data, financial data and valuation Pitch your topic with ease and precision using this Stock Valuation Comparable Company Analysis Microsoft Pdf This layout presents information on Market Data, Financial Data, Company Analysis It is also available for immediate download and adjustment. So, changes can be made in the color, design, graphics or any other component to create a unique layout.
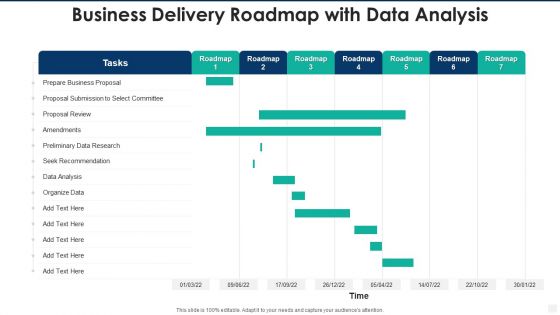
Business Delivery Roadmap With Data Analysis Professional PDF
Pitch your topic with ease and precision using this business delivery roadmap with data analysis professional pdf. This layout presents information on data analysis, seek recommendation, preliminary data research, proposal review, prepare business proposal. It is also available for immediate download and adjustment. So, changes can be made in the color, design, graphics or any other component to create a unique layout.
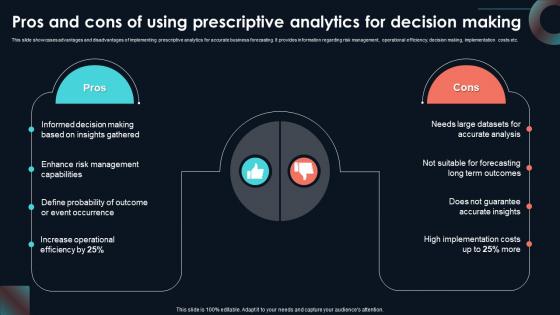
Pros And Cons Of Using Prescriptive Developing Strategic Insights Using Big Data Analytics SS V
This slide showcases advantages and disadvantages of implementing prescriptive analytics for accurate business forecasting. It provides information regarding risk management, operational efficiency, decision making, implementation costs etc. This Pros And Cons Of Using Prescriptive Developing Strategic Insights Using Big Data Analytics SS V is perfect for any presentation, be it in front of clients or colleagues. It is a versatile and stylish solution for organizing your meetings. The Pros And Cons Of Using Prescriptive Developing Strategic Insights Using Big Data Analytics SS V features a modern design for your presentation meetings. The adjustable and customizable slides provide unlimited possibilities for acing up your presentation. Slidegeeks has done all the homework before launching the product for you. So, do not wait, grab the presentation templates today

Guide For Marketing Analytics To Improve Decisions Perform Marketing Performance Competitive Analysis Sample PDF
The following slide covers comparison of company performance with key industry leaders to gain key insights and required data. It includes elements such as market share, product price, target audience, customer satisfaction, weaknesses, marketing strategy etc. Make sure to capture your audiences attention in your business displays with our gratis customizable Guide For Marketing Analytics To Improve Decisions Perform Marketing Performance Competitive Analysis Sample PDF. These are great for business strategies, office conferences, capital raising or task suggestions. If you desire to acquire more customers for your tech business and ensure they stay satisfied, create your own sales presentation with these plain slides.
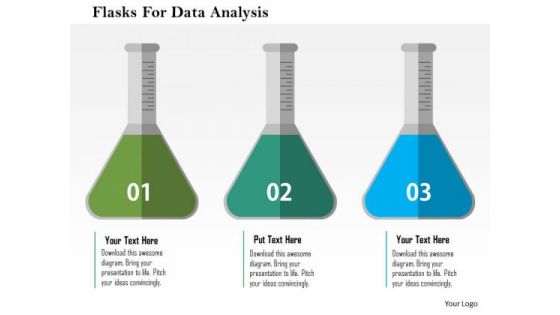
Business Diagram Flasks For Data Analysis Presentation Template
This business diagram displays three flasks. You may use this slide for data analysis. Make your mark with this unique slide. Create an impression that will endure.

Speed Analysis For Big Data Ppt Powerpoint Themes
This is a speed analysis for big data ppt powerpoint themes. This is a four stage process. The stages in this process are volume, velocity, variety, value.

Porters Framework A Detailed Analysis Of Five Force Model Of Analysis Assurant Insurance Agency Introduction Pdf
This slide provides detailed information on porters framework, including strong competitive rivalry, strong bargaining power of consumers, strong threat of substitute, weak bargaining power of suppliers and moderate threat of new entrants in the business. The Porters Framework A Detailed Analysis Of Five Force Model Of Analysis Assurant Insurance Agency Introduction Pdf is a compilation of the most recent design trends as a series of slides. It is suitable for any subject or industry presentation, containing attractive visuals and photo spots for businesses to clearly express their messages. This template contains a variety of slides for the user to input data, such as structures to contrast two elements, bullet points, and slides for written information. Slidegeeks is prepared to create an impression.
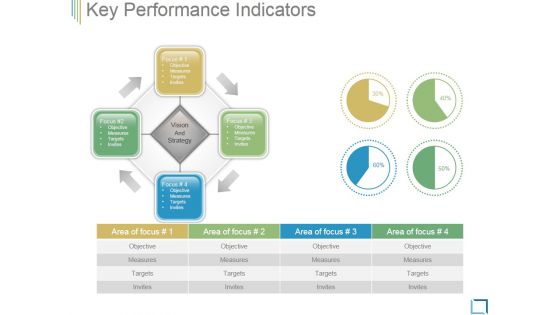
Key Performance Indicators Template 3 Ppt PowerPoint Presentation Samples
This is a key performance indicators template 3 ppt powerpoint presentation samples. This is a four stage process. The stages in this process are objective, measures, targets, invites.
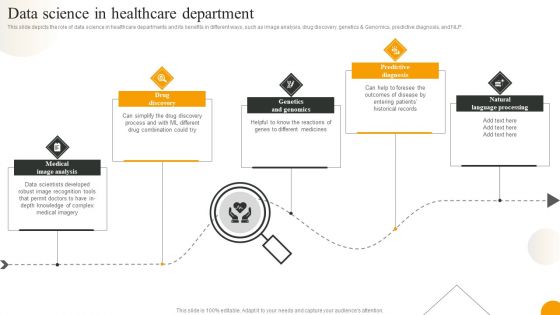
Using Data Science Technologies For Business Transformation Data Science In Healthcare Department Ideas PDF
This slide depicts the role of data science in healthcare departments and its benefits in different ways, such as image analysis, drug discovery, genetics and Genomics, predictive diagnosis, and NLP. Present like a pro with Using Data Science Technologies For Business Transformation Data Science In Healthcare Department Ideas PDF Create beautiful presentations together with your team, using our easy to use presentation slides. Share your ideas in real time and make changes on the fly by downloading our templates. So whether you are in the office, on the go, or in a remote location, you can stay in sync with your team and present your ideas with confidence. With Slidegeeks presentation got a whole lot easier. Grab these presentations today.
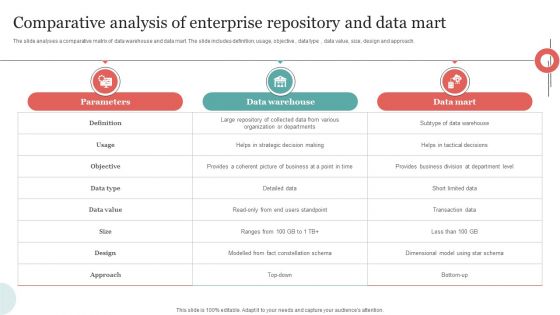
Comparative Analysis Of Enterprise Repository And Data Mart Diagrams PDF
The slide analyses a comparative matrix of data warehouse and data mart. The slide includes definition, usage, objective , data type , data value, size, design and approach. Showcasing this set of slides titled Comparative Analysis Of Enterprise Repository And Data Mart Diagrams PDF. The topics addressed in these templates are Parameters, Data Warehouse, Data Mart. All the content presented in this PPT design is completely editable. Download it and make adjustments in color, background, font etc. as per your unique business setting.
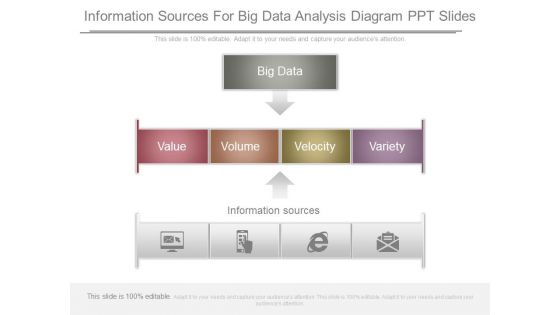
Information Sources For Big Data Analysis Diagram Ppt Slides
This is a information sources for big data analysis diagram ppt slides. This is a three stage process. The stages in this process are big data, value, volume, velocity, variety, information sources.
Data Analysis Vector Icons Ppt Powerpoint Presentation Layouts Gridlines
This is a data analysis vector icons ppt powerpoint presentation layouts gridlines. This is a two stage process. The stages in this process are data presentation, content presentation, information presentation.
Data Interpretation Percentage Analysis Ppt Powerpoint Presentation Summary Icon
This is a data interpretation percentage analysis ppt powerpoint presentation summary icon. This is a six stage process. The stages in this process are data presentation, content presentation, information presentation.
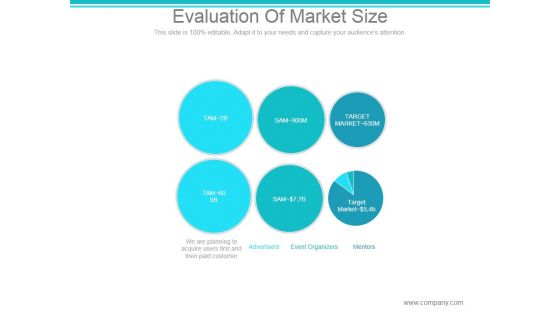
Evaluation Of Market Size Ppt PowerPoint Presentation Ideas
This is a evaluation of market size ppt powerpoint presentation ideas. This is a six stage process. The stages in this process are target market, advertisers, event organizers, mentors.

 Home
Home