Survey Dashboard
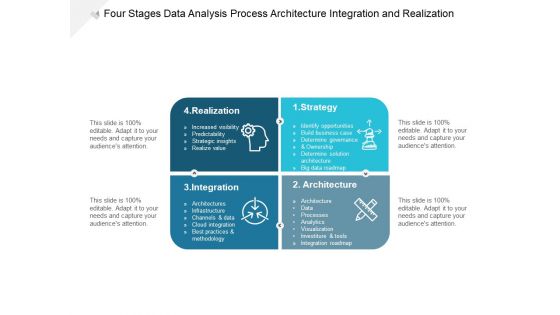
Four Stages Data Analysis Process Architecture Integration And Realization Ppt PowerPoint Presentation Pictures Templates Cpb
This is a four stages data analysis process architecture integration and realization ppt powerpoint presentation pictures templates cpb. This is a four stage process. The stages in this process are data analysis, analytics architecture, analytics framework.
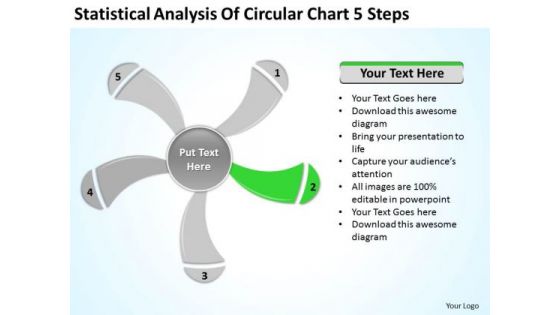
Statistical Analysis Of Circular Chart 5 Steps Ppt Business Plan PowerPoint Slide
We present our statistical analysis of circular chart 5 steps ppt business plan PowerPoint Slide.Download and present our Business PowerPoint Templates because Our PowerPoint Templates and Slides will definately Enhance the stature of your presentation. Adorn the beauty of your thoughts with their colourful backgrounds. Use our Signs PowerPoint Templates because Our PowerPoint Templates and Slides will give good value for money. They also have respect for the value of your time. Download our Shapes PowerPoint Templates because Our PowerPoint Templates and Slides team portray an attitude of elegance. Personify this quality by using them regularly. Use our Metaphors-Visual Concepts PowerPoint Templates because Our PowerPoint Templates and Slides will effectively help you save your valuable time. They are readymade to fit into any presentation structure. Use our Process and Flows PowerPoint Templates because our PowerPoint Templates and Slides are the string of your bow. Fire of your ideas and conquer the podium.Use these PowerPoint slides for presentations relating to graphically, graphic, vector, layout, business, computation, sign, infochart, visual, symbol, template, diagram, calculations, sector, data, revenue, schedule, element, analysis, drawing, report, technology, contour, classification, graph, modern, illustration, icon, comparison, object, chart, collection, science, color, growth, composition, professional, set, education, math, profits, information, symmetry, statistic, structure, infographics, button. The prominent colors used in the PowerPoint template are Green, Gray, White.
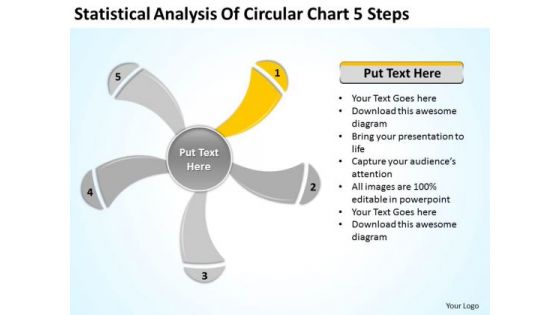
Statistical Analysis Of Circular Chart 5 Steps Ppt Business Plan PowerPoint Slides
We present our statistical analysis of circular chart 5 steps ppt business plan PowerPoint Slides.Download and present our Business PowerPoint Templates because Timeline crunches are a fact of life. Meet all deadlines using our PowerPoint Templates and Slides. Present our Signs PowerPoint Templates because You can Zap them with our PowerPoint Templates and Slides. See them reel under the impact. Use our Shapes PowerPoint Templates because It can Bubble and burst with your ideas. Download our Metaphors-Visual Concepts PowerPoint Templates because You can Create a matrix with our PowerPoint Templates and Slides. Feel the strength of your ideas click into place. Present our Process and Flows PowerPoint Templates because Our PowerPoint Templates and Slides has conjured up a web of all you need with the help of our great team. Use them to string together your glistening ideas.Use these PowerPoint slides for presentations relating to graphically, graphic, vector, layout, business, computation, sign, infochart, visual, symbol, template, diagram, calculations, sector, data, revenue, schedule, element, analysis, drawing, report, technology, contour, classification, graph, modern, illustration, icon, comparison, object, chart, collection, science, color, growth, composition, professional, set, education, math, profits, information, symmetry, statistic, structure, infographics, button. The prominent colors used in the PowerPoint template are Yellow, Gray, White.

Empowering The Future Statistical Graph Showcasing Smart Meter Market Growth IoT SS V
This slide showcases information about the global market size of smart meters. It includes key reasons such as government initiatives to promote energy conversation, smart city initiatives, accurate billing process, etc. The Empowering The Future Statistical Graph Showcasing Smart Meter Market Growth IoT SS V is a compilation of the most recent design trends as a series of slides. It is suitable for any subject or industry presentation, containing attractive visuals and photo spots for businesses to clearly express their messages. This template contains a variety of slides for the user to input data, such as structures to contrast two elements, bullet points, and slides for written information. Slidegeeks is prepared to create an impression.
Data Analytics IT Timeline For Data Science Implementation In The Organization Ppt Portfolio Icons PDF
This slide represents the timeline for the data science projects and a list of tasks performed each month, from training to work on projects. This is a data analytics it timeline for data science implementation in the organization ppt portfolio icons pdf template with various stages. Focus and dispense information on four stages using this creative set, that comes with editable features. It contains large content boxes to add your information on topics like exploratory analysis, final analysis, data cleaning, conditioning and transformation, data gathering from different resources. You can also showcase facts, figures, and other relevant content using this PPT layout. Grab it now.
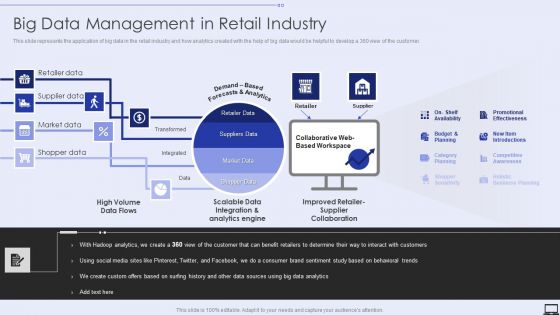
Big Data Management In Retail Industry Ppt PowerPoint Presentation File Styles PDF
This slide represents the application of big data in the retail industry and how analytics created with the help of big data would be helpful to develop a 360 view of the customer. Deliver an awe inspiring pitch with this creative Big Data Management In Retail Industry Ppt PowerPoint Presentation File Styles PDF bundle. Topics like Market Data, Supplier Data, Retailer Data can be discussed with this completely editable template. It is available for immediate download depending on the needs and requirements of the user.

Average Email Marketing Statistics By Innovative Business Promotion Ideas Diagrams Pdf
The following slide showcases average email marketing data by multiple industries such as advertising and marketing, agriculture, consumer packaged goods, education, financial services, food and beverage, etc. Through this statistics marketers can develop email marketing campaign goals based on the industry. Create an editable Average Email Marketing Statistics By Innovative Business Promotion Ideas Diagrams Pdf that communicates your idea and engages your audience. Whether you are presenting a business or an educational presentation, pre designed presentation templates help save time. Average Email Marketing Statistics By Innovative Business Promotion Ideas Diagrams Pdf is highly customizable and very easy to edit, covering many different styles from creative to business presentations. Slidegeeks has creative team members who have crafted amazing templates. So, go and get them without any delay.
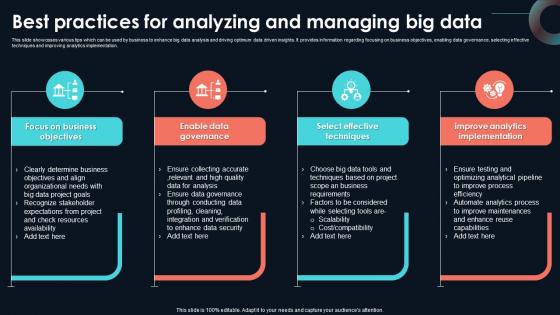
Best Practices For Analyzing And Managing Developing Strategic Insights Using Big Data Analytics SS V
This slide showcases various tips which can be used by business to enhance big data analysis and driving optimum data driven insights. It provides information regarding focusing on business objectives, enabling data governance, selecting effective techniques and improving analytics implementation. From laying roadmaps to briefing everything in detail, our templates are perfect for you. You can set the stage with your presentation slides. All you have to do is download these easy-to-edit and customizable templates. Best Practices For Analyzing And Managing Developing Strategic Insights Using Big Data Analytics SS V will help you deliver an outstanding performance that everyone would remember and praise you for. Do download this presentation today.
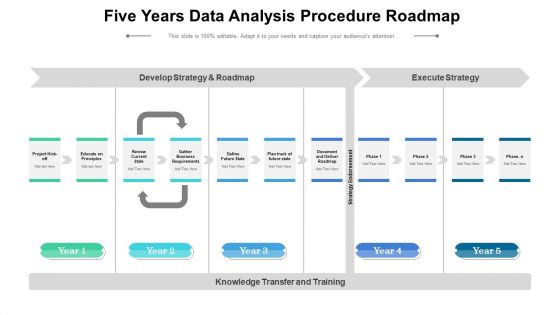
Five Years Data Analysis Procedure Roadmap Infographics
Introducing our five years data analysis procedure roadmap infographics. This PPT presentation is Google Slides compatible, therefore, you can share it easily with the collaborators for measuring the progress. Also, the presentation is available in both standard screen and widescreen aspect ratios. So edit the template design by modifying the font size, font type, color, and shapes as per your requirements. As this PPT design is fully editable it can be presented in PDF, JPG and PNG formats.
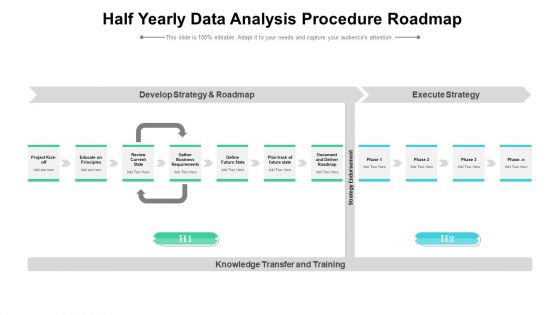
Half Yearly Data Analysis Procedure Roadmap Formats
Presenting our innovatively structured half yearly data analysis procedure roadmap formats Template. Showcase your roadmap process in different formats like PDF, PNG, and JPG by clicking the download button below. This PPT design is available in both Standard Screen and Widescreen aspect ratios. It can also be easily personalized and presented with modified font size, font type, color, and shapes to measure your progress in a clear way.

Six Months Data Analysis Procedure Roadmap Topics
Presenting our innovatively structured six months data analysis procedure roadmap topics Template. Showcase your roadmap process in different formats like PDF, PNG, and JPG by clicking the download button below. This PPT design is available in both Standard Screen and Widescreen aspect ratios. It can also be easily personalized and presented with modified font size, font type, color, and shapes to measure your progress in a clear way.

Quarterly Big Data Analysis Strategy Roadmap Infographics
Presenting our jaw-dropping quarterly big data analysis strategy roadmap infographics. You can alternate the color, font size, font type, and shapes of this PPT layout according to your strategic process. This PPT presentation is compatible with Google Slides and is available in both standard screen and widescreen aspect ratios. You can also download this well-researched PowerPoint template design in different formats like PDF, JPG, and PNG. So utilize this visually-appealing design by clicking the download button given below.
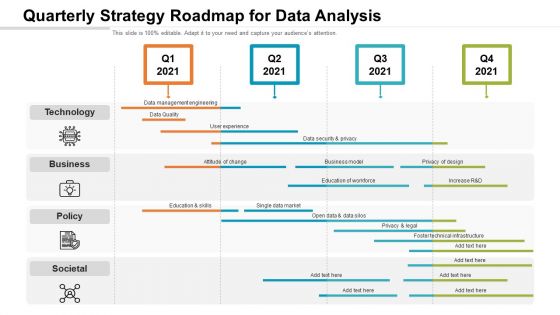
Quarterly Strategy Roadmap For Data Analysis Microsoft
Introducing our quarterly strategy roadmap for data analysis microsoft. This PPT presentation is Google Slides compatible, therefore, you can share it easily with the collaborators for measuring the progress. Also, the presentation is available in both standard screen and widescreen aspect ratios. So edit the template design by modifying the font size, font type, color, and shapes as per your requirements. As this PPT design is fully editable it can be presented in PDF, JPG and PNG formats.

Data Analysis On Excel 3d Chart Shows Interrelated Sets Of PowerPoint Templates
Put Them On The Same Page With Our data analysis on excel 3d chart shows interrelated sets of Powerpoint Templates . Your Team Will Sing From The Same Sheet.
Magnifying Glass For Business Research Ppt PowerPoint Presentation Styles
This is a magnifying glass for business research ppt powerpoint presentation styles. This is a five stage process. The stages in this process are gears, technology, icons, search, magnify.
Data Cleansing Process Flow For Duplicate Various Techniques For Managing Professional PDF
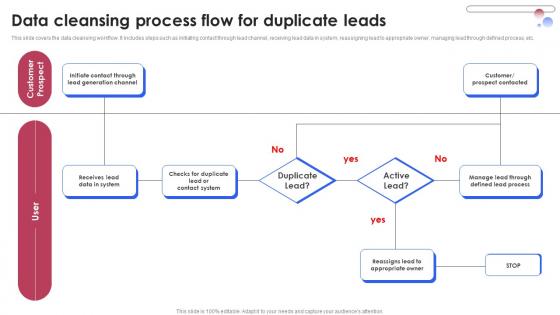
This slide covers a comparative analysis of top lead management software. It includes comparison basis such as rating, pricing, NPS score, payback period, implementation time, auto profile enrichment, webforms, lead scoring, etc. Whether you have daily or monthly meetings, a brilliant presentation is necessary. Data Cleansing Process Flow For Duplicate Various Techniques For Managing Professional PDF can be your best option for delivering a presentation. Represent everything in detail using Data Cleansing Process Flow For Duplicate Various Techniques For Managing Professional PDF and make yourself stand out in meetings. The template is versatile and follows a structure that will cater to your requirements. All the templates prepared by Slidegeeks are easy to download and edit. Our research experts have taken care of the corporate themes as well. So, give it a try and see the results.

Enhanced Sensing Technologies Biomedical Data Science And Health Informatics Introduction Pdf
This slide talks about the advanced sensing technology apps for early predictions of diseases such as Alzheimers and mental health disorders. The mental health disorder apps offer analysis of behavioral health problems such as interest, social isolation, mood, and energy level. This Enhanced Sensing Technologies Biomedical Data Science And Health Informatics Introduction Pdf is perfect for any presentation, be it in front of clients or colleagues. It is a versatile and stylish solution for organizing your meetings. The Enhanced Sensing Technologies Biomedical Data Science And Health Informatics Introduction Pdf features a modern design for your presentation meetings. The adjustable and customizable slides provide unlimited possibilities for acing up your presentation. Slidegeeks has done all the homework before launching the product for you. So, do not wait, grab the presentation templates today

Solving Smart Grid Optimization Through Edge Analytics Pictures Pdf
This slide covers a case study on Smart Grid Optimization. This template aims to showcase how edge analytics can address challenges faced by a utility company in optimizing its smart grid operations. It includes the situation, challenges, strategies, impact, and key takeaways of implementing edge analytics in this scenario.Showcasing this set of slides titled Solving Smart Grid Optimization Through Edge Analytics Pictures Pdf The topics addressed in these templates are Deployment Implement, Distribute Data Processing, Key Takeaways All the content presented in this PPT design is completely editable. Download it and make adjustments in color, background, font etc. as per your unique business setting.

Big Data Market Forecast Ppt PowerPoint Presentation Information
This is a big data market forecast ppt powerpoint presentation information. This is a five stage process. The stages in this process are business, growth, strategy, timeline, planning, success.
Deliverables From Marketing Ppt PowerPoint Presentation Outline Format
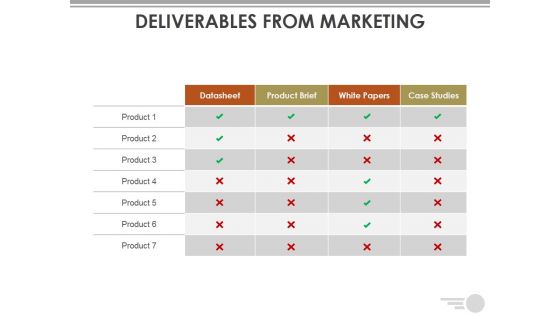
This is a deliverables from marketing ppt powerpoint presentation outline format. This is a four stage process. The stages in this process are business, marketing, tables, data, analysis.
Stationery Product Market Analysis And Trends Stationery Business Plan Go To Market Strategy Guidelines Pdf
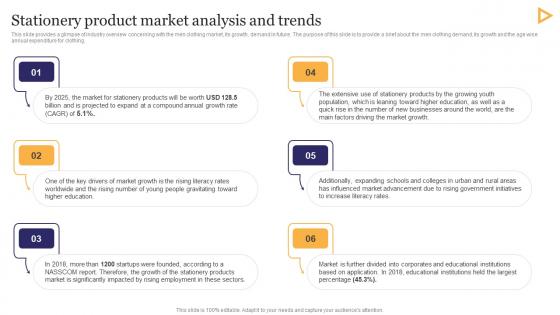
This slide provides a glimpse of industry overview concerning with the men clothing market, its growth, demand in future. The purpose of this slide is to provide a brief about the men clothing demand, its growth and the age wise annual expenditure for clothing. Find a pre designed and impeccable Stationery Product Market Analysis And Trends Stationery Business Plan Go To Market Strategy Guidelines Pdf. The templates can ace your presentation without additional effort. You can download these easy to edit presentation templates to make your presentation stand out from others. So, what are you waiting for Download the template from Slidegeeks today and give a unique touch to your presentation.
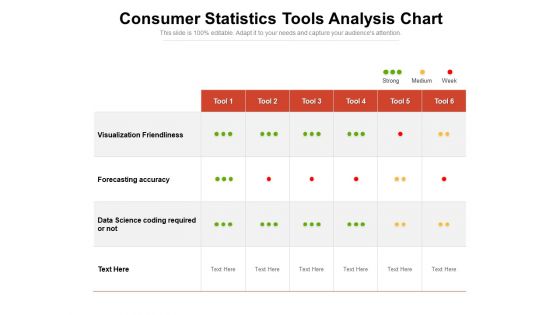
Consumer Statistics Tools Analysis Chart Ppt PowerPoint Presentation File Picture PDF
Presenting this set of slides with name consumer statistics tools analysis chart ppt powerpoint presentation file picture pdf. The topics discussed in these slides are forecasting accuracy, visualization friendliness, data science. This is a completely editable PowerPoint presentation and is available for immediate download. Download now and impress your audience.
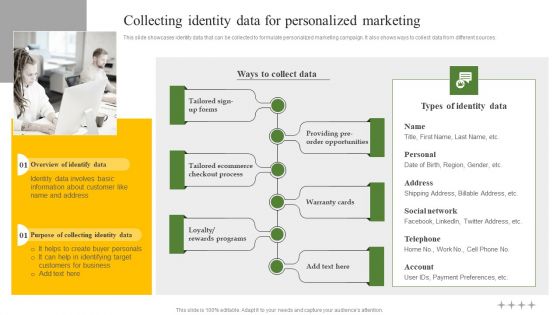
Collecting Identity Data For Personalized Marketing Ppt Professional Elements PDF
This slide showcases identity data that can be collected to formulate personalized marketing campaign. It also shows ways to collect data from different sources. Are you searching for a Collecting Identity Data For Personalized Marketing Ppt Professional Elements PDF that is uncluttered, straightforward, and original Its easy to edit, and you can change the colors to suit your personal or business branding. For a presentation that expresses how much effort you have put in, this template is ideal With all of its features, including tables, diagrams, statistics, and lists, its perfect for a business plan presentation. Make your ideas more appealing with these professional slides. Download Collecting Identity Data For Personalized Marketing Ppt Professional Elements PDF from Slidegeeks today.
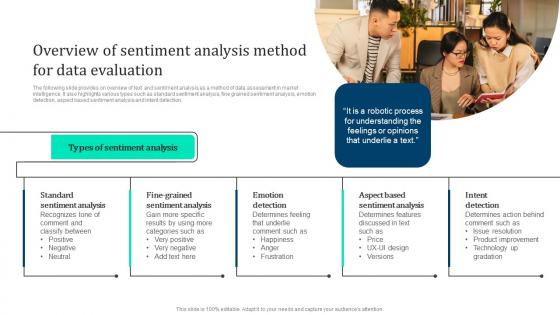
Overview Sentiment Analysis Method Marketing Intelligence Guide Data Gathering Sample Pdf
The following slide provides on overview of text and sentiment analysis as a method of data assessment in market intelligence. It also highlights various types such as standard sentiment analysis, fine grained sentiment analysis, emotion detection, aspect based sentiment analysis and intent detection. Do you know about Slidesgeeks Overview Sentiment Analysis Method Marketing Intelligence Guide Data Gathering Sample Pdf These are perfect for delivering any kind od presentation. Using it, create PowerPoint presentations that communicate your ideas and engage audiences. Save time and effort by using our pre designed presentation templates that are perfect for a wide range of topic. Our vast selection of designs covers a range of styles, from creative to business, and are all highly customizable and easy to edit. Download as a PowerPoint template or use them as Google Slides themes.
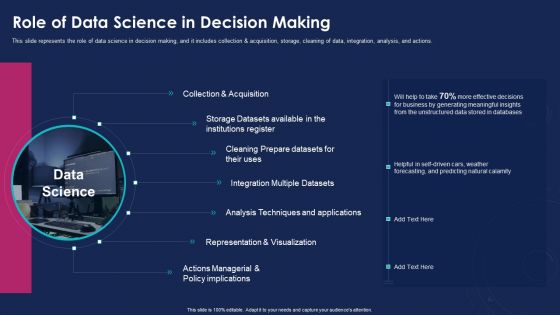
Data Analytics IT Role Of Data Science In Decision Making Ppt Infographics Shapes PDF
This slide represents the role of data science in decision making, and it includes collection and acquisition, storage, cleaning of data, integration, analysis, and actions. Presenting data analytics it role of data science in decision making ppt infographics shapes pdf to provide visual cues and insights. Share and navigate important information on seven stages that need your due attention. This template can be used to pitch topics like policy implications, representation and visualization, analysis techniques, integration multiple datasets, collection and acquisition. In addtion, this PPT design contains high resolution images, graphics, etc, that are easily editable and available for immediate download.

Employee Performance Improvement Plan Weekly Analysing Hr Data For Effective Decision Making
The following slide exhibits an employee performance enhancement plan for HR managers that helps in removing performance gaps. It includes current employee gap analysis, communicate performance expectations, training plan implementation, reward best performers, etc. Coming up with a presentation necessitates that the majority of the effort goes into the content and the message you intend to convey. The visuals of a PowerPoint presentation can only be effective if it supplements and supports the story that is being told. Keeping this in mind our experts created Employee Performance Improvement Plan Weekly Analysing Hr Data For Effective Decision Making to reduce the time that goes into designing the presentation. This way, you can concentrate on the message while our designers take care of providing you with the right template for the situation.

Working Of Attended Machine Driven Learning Data Ppt Samples PDF
This slide defines the process of performing tasks by attended automation systems. It also shows how bots collect data from multiple systems and generate reports based on that data. Deliver and pitch your topic in the best possible manner with this working of attended machine driven learning data ppt samples pdf. Use them to share invaluable insights on analysis, information, systems, data and impress your audience. This template can be altered and modified as per your expectations. So, grab it now.
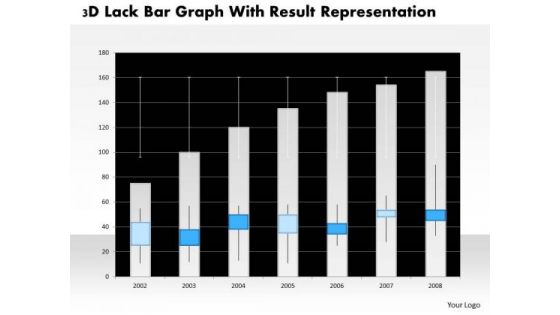
Business Diagram 3d Lack Bar Graph With Result Representation PowerPoint Slide
This business diagram has graphic of 3d lack bar graph. This diagram is a data visualization tool that gives you a simple way to present statistical information. This slide helps your audience examine and interpret the data you present.

Business Diagram Battery Connected With Bulb For Idea Generation PowerPoint Slide
This business slide displays battery icon connected with bulb. This diagram is a data visualization tool that gives you a simple way to present statistical information. This slide helps your audience examine and interpret the data you present.
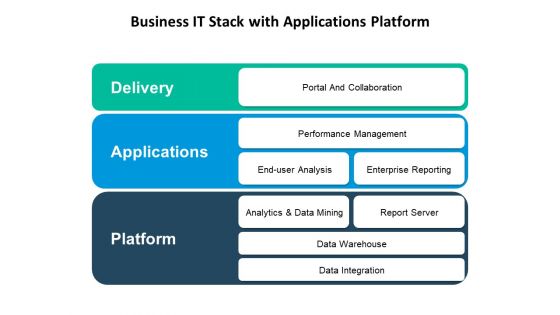
Business IT Stack With Applications Platform Ppt PowerPoint Presentation Inspiration Influencers PDF
Presenting this set of slides with name business it stack with applications platform ppt powerpoint presentation inspiration influencers pdf. This is a three stage process. The stages in this process are delivery, applications, platform, portal and collaboration, performance management, end user analysis, enterprise reporting, analytics and data mining, report server, data warehouse, data integration. This is a completely editable PowerPoint presentation and is available for immediate download. Download now and impress your audience.
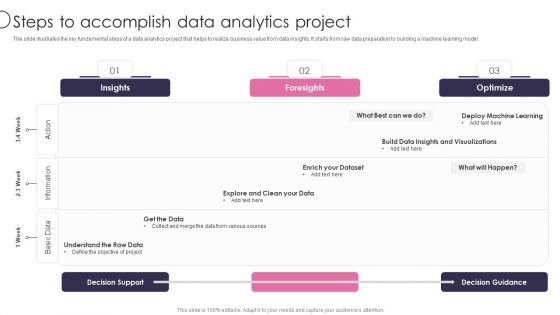
Information Transformation Process Toolkit Steps To Accomplish Data Analytics Project Introduction PDF
The slide illustrates the key fundamental steps of a data analytics project that helps to realize business value from data insights. It starts from raw data preparation to building a machine learning model. Deliver an awe inspiring pitch with this creative Information Transformation Process Toolkit Steps To Accomplish Data Analytics Project Introduction PDF bundle. Topics like Optimize, Foresights, Decision Guidance can be discussed with this completely editable template. It is available for immediate download depending on the needs and requirements of the user.
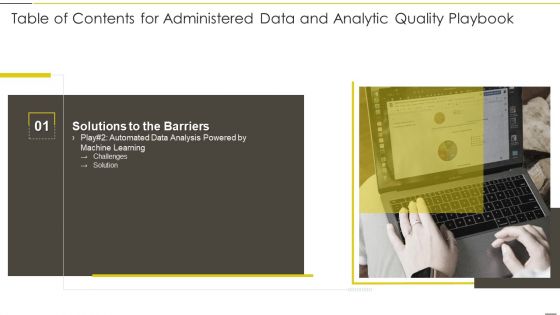
Table Of Contents For Administered Data And Analytic Quality Playbook Themes PDF
Presenting Table Of Contents For Administered Data And Analytic Quality Playbook Themes PDF to provide visual cues and insights. Share and navigate important information on one stags that need your due attention. This template can be used to pitch topics like Automated Data, Analysis Powered, Solutions Barriers In addtion, this PPT design contains high resolution images, graphics, etc, that are easily editable and available for immediate download.
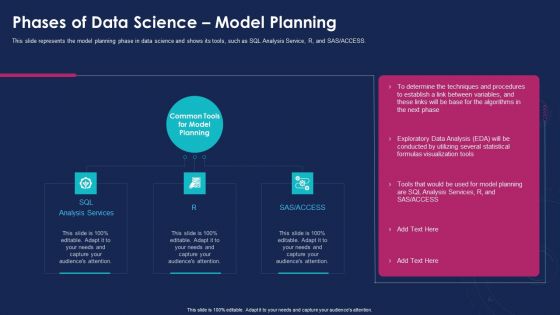
Data Analytics IT Phases Of Data Science Model Planning Ideas PDF
This slide represents the model planning phase in data science and shows its tools, such as SQL Analysis Service, R, and SAS or ACCESS. This is a data analytics it phases of data science model planning ideas pdf template with various stages. Focus and dispense information on three stages using this creative set, that comes with editable features. It contains large content boxes to add your information on topics like sql analysis services, r, sas or access. You can also showcase facts, figures, and other relevant content using this PPT layout. Grab it now.
Data Analytics IT Data Science In Healthcare Department Ppt Professional Icon PDF
This slide depicts the role of data science in healthcare departments and its benefits in different ways, such as image analysis, drug discovery, genetics and Genomics, predictive diagnosis, and NLP. Presenting data analytics it data science in healthcare department ppt professional icon pdf to provide visual cues and insights. Share and navigate important information on five stages that need your due attention. This template can be used to pitch topics like medical image analysis, drug discovery, genetics and genomics, predictive diagnosis, natural language processing. In addtion, this PPT design contains high resolution images, graphics, etc, that are easily editable and available for immediate download.

Best Practices To Create Marketing Document Portrait PDF
This slide outlines tips to develop marketing reports aimed at keeping marketing activities accountable to create value for company in competitive markets. It covers five practices schedule reports, gather feedback, create templates, use valuable data, data visualization. Presenting Best Practices To Create Marketing Document Portrait PDF to dispense important information. This template comprises five stages. It also presents valuable insights into the topics including Schedule Reports, Create Templates, Data Visualization. This is a completely customizable PowerPoint theme that can be put to use immediately. So, download it and address the topic impactfully.

Post Engagement Data From Social Platforms Data Analysis Template PDF
This slide covers the companys post engagement rate over different social media sites. It includes data related to post engagement rate of ABC company over different social media sites such as Instagram, Facebook and twitter. Pitch your topic with ease and precision using this Post Engagement Data From Social Platforms Data Analysis Template PDF. This layout presents information on Post Engagement Data, Social Platforms Data Analysis. It is also available for immediate download and adjustment. So, changes can be made in the color, design, graphics or any other component to create a unique layout.

Accounting Key Performance Indicators Ppt Powerpoint
This is a accounting key performance indicators ppt powerpoint. This is a four stage process. The stages in this process are cost per invoice, invoice processing speed, productivity per team member, variance analysis.
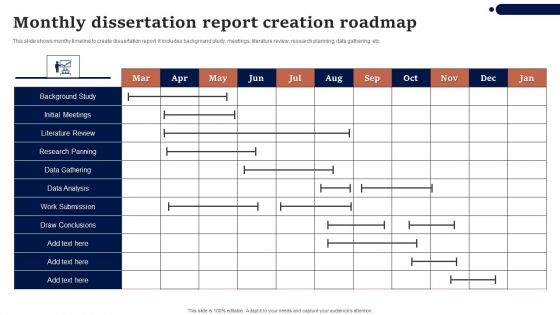
Monthly Dissertation Report Creation Roadmap Background PDF
This slide shows monthy timeline to create dissertation report. it includes background study, meetings, literature review, research planning, data gathering, etc. Pitch your topic with ease and precision using this Monthly Dissertation Report Creation Roadmap Background PDF. This layout presents information on Data Gathering, Data Analysis, Research Panning. It is also available for immediate download and adjustment. So, changes can be made in the color, design, graphics or any other component to create a unique layout.
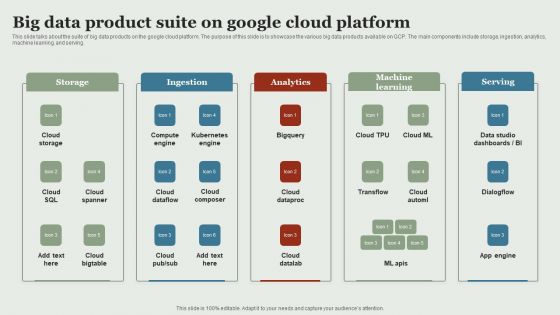
Google Cloud Service Models Big Data Product Suite On Google Cloud Platform Rules PDF
This slide talks about the suite of big data products on the google cloud platform. The purpose of this slide is to showcase the various big data products available on GCP. The main components include storage, ingestion, analytics, machine learning, and serving. Are you in need of a template that can accommodate all of your creative concepts This one is crafted professionally and can be altered to fit any style. Use it with Google Slides or PowerPoint. Include striking photographs, symbols, depictions, and other visuals. Fill, move around, or remove text boxes as desired. Test out color palettes and font mixtures. Edit and save your work, or work with colleagues. Download Google Cloud Service Models Big Data Product Suite On Google Cloud Platform Rules PDF and observe how to make your presentation outstanding. Give an impeccable presentation to your group and make your presentation unforgettable.
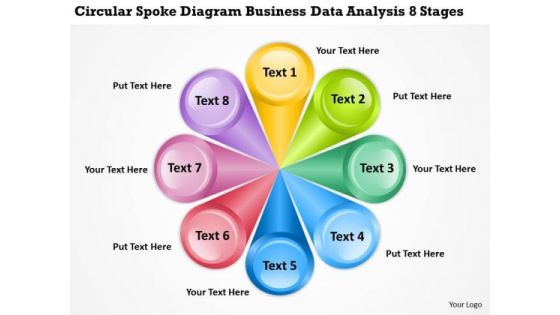
Diagram Business Data Analysis 8 Stages Real Estate Plan Examples PowerPoint Slides
We present our diagram business data analysis 8 stages real estate plan examples PowerPoint Slides.Use our Circle Charts PowerPoint Templates because You will get more than you ever bargained for. Use our Shapes PowerPoint Templates because Our PowerPoint Templates and Slides will help you be quick off the draw. Just enter your specific text and see your points hit home. Download our Business PowerPoint Templates because It can be used to Set your controls for the heart of the sun. Our PowerPoint Templates and Slides will be the propellant to get you there. Download our Signs PowerPoint Templates because you should Whip up a frenzy with our PowerPoint Templates and Slides. They will fuel the excitement of your team. Present our Curves and Lines PowerPoint Templates because Our PowerPoint Templates and Slides are effectively colour coded to prioritise your plans They automatically highlight the sequence of events you desire.Use these PowerPoint slides for presentations relating to diagram, model, business, chart, processes, sales, components, concept, vector, selling, distribution, marketing, abstract, management, illustration, icon, strategy, activities, executive, design, procedure, organization, advertising, conceptual, resource, promotion, editable. The prominent colors used in the PowerPoint template are Yellow, Green, Blue.

Stats Evaluation Ppt Template Presentation Examples
This is a stats evaluation ppt template presentation examples. This is a five stage process. The stages in this process are questionnaire, opinion, data, monitor, report.
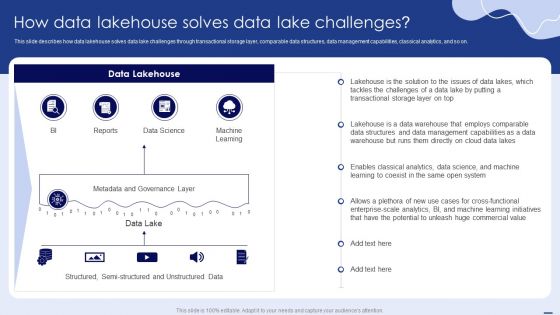
How Data Lakehouse Solves Data Lake Challenges Ppt PowerPoint Presentation Diagram Templates PDF
This slide describes how data lakehouse solves data lake challenges through transactional storage layer, comparable data structures, data management capabilities, classical analytics, and so on. Welcome to our selection of the How Data Lakehouse Solves Data Lake Challenges Ppt PowerPoint Presentation Diagram Templates PDF. These are designed to help you showcase your creativity and bring your sphere to life. Planning and Innovation are essential for any business that is just starting out. This collection contains the designs that you need for your everyday presentations. All of our PowerPoints are 100 percent editable, so you can customize them to suit your needs. This multi purpose template can be used in various situations. Grab these presentation templates today.
Actual Time Transaction Monitoring Software And Strategies TMS And Data Analytics Process Flow Icons PDF
This slide represents transaction monitoring system process flow. It provides information about data analytics, risk framework, alerting, ad hoc analysis, case management, external source entrance, stop list, politically exposed persons PEP, watch list, etc. There are so many reasons you need a Actual Time Transaction Monitoring Software And Strategies TMS And Data Analytics Process Flow Icons PDF. The first reason is you can not spend time making everything from scratch, Thus, Slidegeeks has made presentation templates for you too. You can easily download these templates from our website easily.
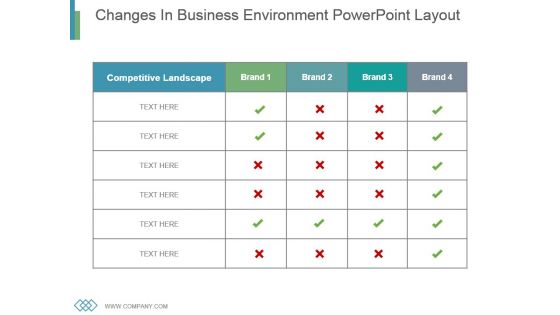
Changes In Business Environment Powerpoint Layout
This is a changes in business environment powerpoint layout. This is a four stage process. The stages in this process are business, marketing, management, competitive, sign.

Empowering The Future Key Emerging Market Trends In IoT Driven Smart Grid IoT SS V
This slide showcases emerging trends and opportunities that optimize and increase the sustainability of energy solutions. It includes trends such as renewable energy sources continued growth, distributed energy resources, electric vehicle charging, and a focus on cybersecurity. Slidegeeks is here to make your presentations a breeze with Empowering The Future Key Emerging Market Trends In IoT Driven Smart Grid IoT SS V With our easy-to-use and customizable templates, you can focus on delivering your ideas rather than worrying about formatting. With a variety of designs to choose from, you are sure to find one that suits your needs. And with animations and unique photos, illustrations, and fonts, you can make your presentation pop. So whether you are giving a sales pitch or presenting to the board, make sure to check out Slidegeeks first

Data Collection And Analysis Control Chart Ppt PowerPoint Presentation Visuals
This is a data collection and analysis control chart ppt powerpoint presentation visuals. This is a ten stage process. The stages in this process are upper limit, centerline, lower limit, plotted points.
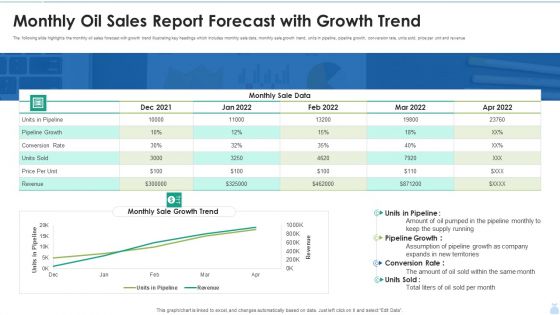
Monthly Oil Sales Report Forecast With Growth Trend Graphics PDF
The following slide highlights the monthly oil sales forecast with growth trend illustrating key headings which includes monthly sale data, monthly sale growth trend, units in pipeline, pipeline growth, conversion rate, units sold, price per unit and revenue. Showcasing this set of slides titled Monthly Oil Sales Report Forecast With Growth Trend Graphics PDF. The topics addressed in these templates are Pipeline Growth, Monthly Sale Data, Conversion Rate. All the content presented in this PPT design is completely editable. Download it and make adjustments in color, background, font etc. as per your unique business setting.
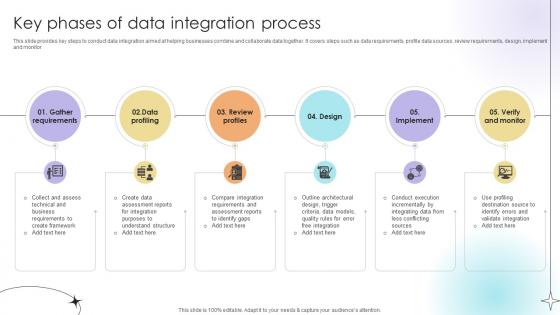
Key Phases Of Data Integration Process Data Analytics SS V
This slide provides key steps to conduct data integration aimed at helping businesses combine and collaborate data together. It covers steps such as data requirements, profile data sources, review requirements, design, implement and monitor.Slidegeeks is here to make your presentations a breeze with Key Phases Of Data Integration Process Data Analytics SS V With our easy-to-use and customizable templates, you can focus on delivering your ideas rather than worrying about formatting. With a variety of designs to choose from, you are sure to find one that suits your needs. And with animations and unique photos, illustrations, and fonts, you can make your presentation pop. So whether you are giving a sales pitch or presenting to the board, make sure to check out Slidegeeks first
Statistical Data Graph Icon Showing Financial Forecast Rules PDF
Presenting statistical data graph icon showing financial forecast rules pdf to dispense important information. This template comprises four stages. It also presents valuable insights into the topics including statistical data graph icon showing financial forecast. This is a completely customizable PowerPoint theme that can be put to use immediately. So, download it and address the topic impactfully.

How Much Money We Need Ppt PowerPoint Presentation Outline
This is a how much money we need ppt powerpoint presentation outline. This is a three stage process. The stages in this process are business, marketing, management, production, sales.

Process Mapping Flow Charting Ppt PowerPoint Presentation Slide Download
This is a process mapping flow charting ppt powerpoint presentation slide download. This is a ten stage process. The stages in this process are business, strategy, marketing, success, growth strategy, flowchart.
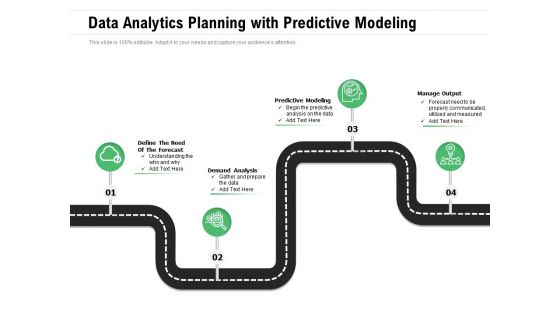
Data Analytics Planning With Predictive Modeling Ppt PowerPoint Presentation File Example Topics PDF
Presenting data analytics planning with predictive modeling ppt powerpoint presentation file example topics pdf to dispense important information. This template comprises four stages. It also presents valuable insights into the topics including analysis, communicated, predictive. This is a completely customizable PowerPoint theme that can be put to use immediately. So, download it and address the topic impactfully.
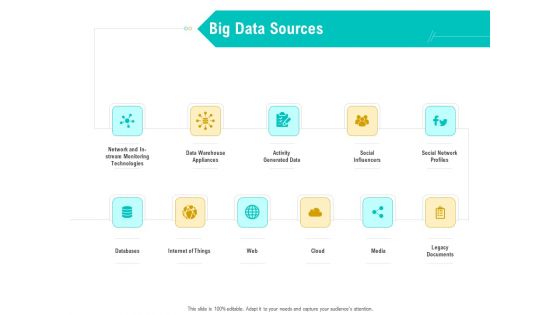
Business Data Analysis Big Data Sources Microsoft PDF
Presenting business data analysis big data sources microsoft pdf to provide visual cues and insights. Share and navigate important information on eleven stages that need your due attention. This template can be used to pitch topics like Data Warehouse Appliances, Activity Generated Data, Social Influencers, Social Network Profiles, Network And In Stream Monitoring Technologies. In addition, this PPT design contains high-resolution images, graphics, etc, that are easily editable and available for immediate download.
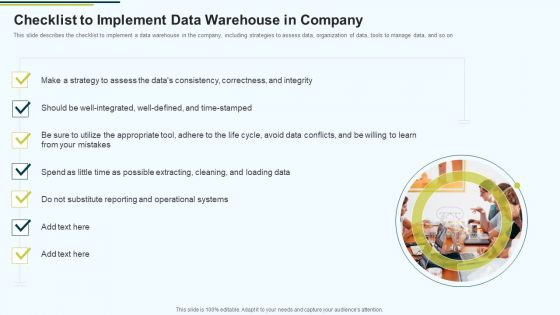
MIS Checklist To Implement Data Warehouse In Company Ppt PowerPoint Presentation Infographic Template Model PDF
This slide describes the checklist to implement a data warehouse in the company, including strategies to assess data, organization of data, tools to manage data, and so on.Presenting MIS Checklist To Implement Data Warehouse In Company Ppt PowerPoint Presentation Infographic Template Model PDF to provide visual cues and insights. Share and navigate important information on one stage that need your due attention. This template can be used to pitch topics like Consistency Correctness, Substitute Reporting And Operational, Possible Extracting In addtion, this PPT design contains high resolution images, graphics, etc, that are easily editable and available for immediate download.
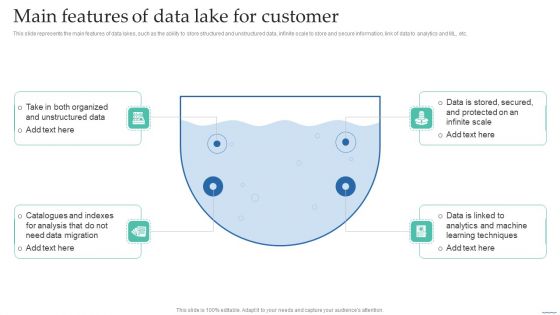
Main Features Of Data Lake For Customer Data Lake Creation With Hadoop Cluster Structure PDF
This slide represents the main features of data lakes, such as the ability to store structured and unstructured data, infinite scale to store and secure information, link of data to analytics and ML, etc.This modern and well-arranged Main Features Of Data Lake For Customer Data Lake Creation With Hadoop Cluster Structure PDF provides lots of creative possibilities. It is very simple to customize and edit with the Powerpoint Software. Just drag and drop your pictures into the shapes. All facets of this template can be edited with Powerpoint no extra software is necessary. Add your own material, put your images in the places assigned for them, adjust the colors, and then you can show your slides to the world, with an animated slide included.

Data Assimilation Technology And Product Architectures Analytics Ppt Infographics Good PDF
Deliver an awe inspiring pitch with this creative data assimilation technology and product architectures analytics ppt infographics good pdf bundle. Topics like data sources, analytics, integration, processors can be discussed with this completely editable template. It is available for immediate download depending on the needs and requirements of the user.

Data Analytics Software Model With Application Areas Ppt PowerPoint Presentation Inspiration Ideas PDF
Pitch your topic with ease and precision using this data analytics software model with application areas ppt powerpoint presentation inspiration ideas pdf. This layout presents information on device management, system rules, data analytics. It is also available for immediate download and adjustment. So, changes can be made in the color, design, graphics or any other component to create a unique layout.

Sentiment Analysis Method Sample Marketing Intelligence Guide Data Gathering Rules Pdf
This slide showcases sample of sentiment analysis method to analyze emotions behind user feedbacks and execute improvement strategies. It showcases elements such as comments, sentiments and response count overview. Want to ace your presentation in front of a live audience Our Sentiment Analysis Method Sample Marketing Intelligence Guide Data Gathering Rules Pdf can help you do that by engaging all the users towards you. Slidegeeks experts have put their efforts and expertise into creating these impeccable powerpoint presentations so that you can communicate your ideas clearly. Moreover, all the templates are customizable, and easy to edit and downloadable. Use these for both personal and commercial use.

Classified Data Memo Record With Strategic Goals SWOT Analysis Of The Company Mockup PDF
This slide shows companys strategic planning technique strengths, weaknesses, opportunities, and threats related to the business. This is a classified data memo record with strategic goals swot analysis of the company mockup pdf template with various stages. Focus and dispense information on four stages using this creative set, that comes with editable features. It contains large content boxes to add your information on topics like strengths, weaknesses, opportunities, threats. You can also showcase facts, figures, and other relevant content using this PPT layout. Grab it now.
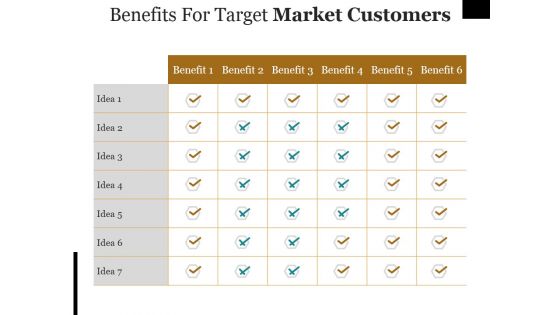
Benefits For Target Market Customers Ppt PowerPoint Presentation Professional Outfit
This is a benefits for target market customers ppt powerpoint presentation professional outfit. This is a six stage process. The stages in this process are tables, benefits, data, analysis, marketing.

 Home
Home