Survey Dashboard

Ready To Eat Food Market Analysis Ready To Eat Industry Snapshot United States Mockup PDF
This Ready To Eat Food Market Analysis Ready To Eat Industry Snapshot United States Mockup PDF from Slidegeeks makes it easy to present information on your topic with precision. It provides customization options, so you can make changes to the colors, design, graphics, or any other component to create a unique layout. It is also available for immediate download, so you can begin using it right away. Slidegeeks has done good research to ensure that you have everything you need to make your presentation stand out. Make a name out there for a brilliant performance.
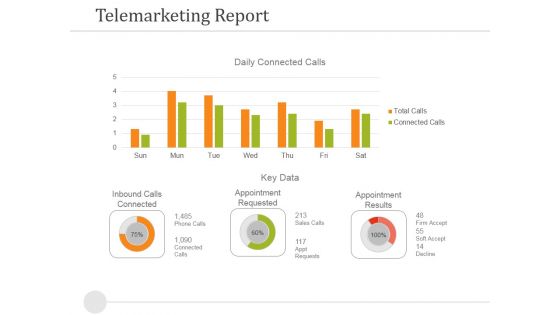
Telemarketing Report Template 1 Ppt PowerPoint Presentation Model Model
This is a telemarketing report template 1 ppt powerpoint presentation model model. This is a two stage process. The stages in this process are inbound calls connected, appointment requested, appointment results, key data.

Circular Spoke Diagram Business Data Analysis 8 Stages Ppt Film Plan PowerPoint Slides
We present our circular spoke diagram business data analysis 8 stages ppt film plan PowerPoint Slides.Download and present our Process and Flows PowerPoint Templates because Our PowerPoint Templates and Slides are aesthetically designed to attract attention. We gaurantee that they will grab all the eyeballs you need. Download and present our Spheres PowerPoint Templates because Our PowerPoint Templates and Slides will let Your superior ideas hit the target always and everytime. Download our Business PowerPoint Templates because They will Put your wonderful verbal artistry on display. Our PowerPoint Templates and Slides will provide you the necessary glam and glitter. Download and present our Shapes PowerPoint Templates because It will get your audience in sync. Download our Circle Charts PowerPoint Templates because Our PowerPoint Templates and Slides will generate and maintain the level of interest you desire. They will create the impression you want to imprint on your audience.Use these PowerPoint slides for presentations relating to Design, isolated, statistics, model, statement, interface, business, vector, presentation, glossy, internet, diagram, circle,brochure, description, report, marketing, level, abstract, steps, illustration, pie, chart, sphere, registry, catalog, section, futuristic, web, text,information,eight space, demonstration, navigation, pattern, structure, multiple. The prominent colors used in the PowerPoint template are Purple, Gray, White.

Data Analysis 8 Stages Ppt Business Plans For Non Profit Organizations PowerPoint Templates
We present our data analysis 8 stages ppt business plans for non profit organizations PowerPoint templates.Present our Process and Flows PowerPoint Templates because Our PowerPoint Templates and Slides will definately Enhance the stature of your presentation. Adorn the beauty of your thoughts with their colourful backgrounds. Present our Circle Charts PowerPoint Templates because you can Set pulses racing with our PowerPoint Templates and Slides. They will raise the expectations of your team. Download our Business PowerPoint Templates because Our PowerPoint Templates and Slides will let you Leave a lasting impression to your audiences. They possess an inherent longstanding recall factor. Use our Spheres PowerPoint Templates because our PowerPoint Templates and Slides are the string of your bow. Fire of your ideas and conquer the podium. Use our Shapes PowerPoint Templates because Our PowerPoint Templates and Slides are effectively colour coded to prioritise your plans They automatically highlight the sequence of events you desire.Use these PowerPoint slides for presentations relating to Design, isolated, statistics, model, statement, interface, business, vector, presentation, glossy, internet, diagram, circle,brochure, description, report, marketing, level, abstract, steps, illustration, pie, chart, sphere, registry, catalog, section, futuristic, web, text,information,eight space, demonstration, navigation, pattern, structure, multiple. The prominent colors used in the PowerPoint template are Green, Gray, Black.

Splunk Analysis Of Big Data To Assess Business Value Sample Pdf
Following slide showcases splunk big data analysis to evaluate business value. The purpose of this slide is to help businesses in forming better decisions by providing insights into their data. It includes components such as search, deploy, proactive monitoring, etc. Showcasing this set of slides titled Splunk Analysis Of Big Data To Assess Business Value Sample Pdf The topics addressed in these templates are Enterprise Scalability, Operational Intelligence All the content presented in this PPT design is completely editable. Download it and make adjustments in color, background, font etc. as per your unique business setting.

Summary Finance Transformation Program Checklist Related To Forecasting Clipart PDF
The slide provides program checklist related to forecasting and strategy under finance transformation. The slide provides the key performance indicators revenue, operating profit, net profit, return on investment, data accuracy etc. and requirement of forecasting and strategy implementation for each KPI. Deliver and pitch your topic in the best possible manner with this Summary Finance Transformation Program Checklist Related To Forecasting Clipart PDF. Use them to share invaluable insights on Key Performance Indicators, Forecasting Required, Not Required, Strategy Implemented, Return On Investment and impress your audience. This template can be altered and modified as per your expectations. So, grab it now.

Big Data Analytics Lifecycle What Is Big Data Analytics Ppt Layouts Portrait PDF
This slide represents the meaning of big data and the complete data handling process such as data collection, storage, research, analysis, visualization, volume, and network. Present like a pro with Big Data Analytics Lifecycle What Is Big Data Analytics Ppt Layouts Portrait PDF Create beautiful presentations together with your team, using our easy-to-use presentation slides. Share your ideas in real-time and make changes on the fly by downloading our templates. So whether youre in the office, on the go, or in a remote location, you can stay in sync with your team and present your ideas with confidence. With Slidegeeks presentation got a whole lot easier. Grab these presentations today.
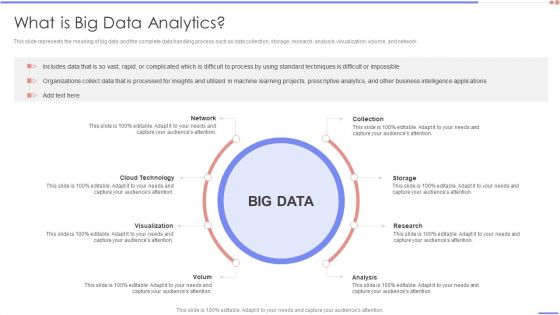
Data Analytics Management What Is Big Data Analytics Slides PDF
This slide represents the meaning of big data and the complete data handling process such as data collection, storage, research, analysis, visualization, volume, and network.This is a Data Analytics Management What Is Big Data Analytics Slides PDF template with various stages. Focus and dispense information on one stage using this creative set, that comes with editable features. It contains large content boxes to add your information on topics like Standard Techniques, Difficult Impossible, Intelligence. You can also showcase facts, figures, and other relevant content using this PPT layout. Grab it now.
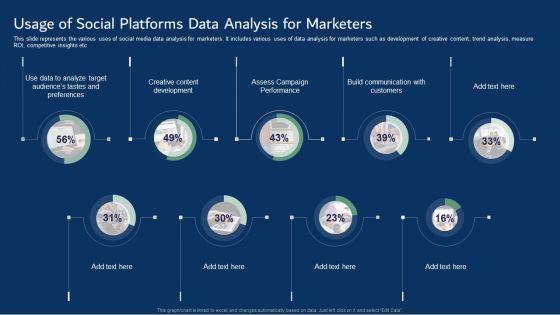
Usage Of Social Platforms Data Analysis For Marketers Information PDF
This slide represents the various uses of social media data analysis for marketers. It includes various uses of data analysis for marketers such as development of creative content, trend analysis, measure ROI, competitive insights etc. Showcasing this set of slides titled Usage Of Social Platforms Data Analysis For Marketers Information PDF. The topics addressed in these templates are Creative Content Development, Assess Campaign Performance, Build Communication. All the content presented in this PPT design is completely editable. Download it and make adjustments in color, background, font etc. as per your unique business setting.

Multi Segment Circle For Data Interpretation Powerpoint Template
This PowerPoint template has been designed with circular web diagram. This diagram is useful to display outline of a business plan. Visual effect helps in maintaining the flow of the discussion and provides more clarity to the subject.

Big Data Analytics Workflow Funnel Ppt PowerPoint Presentation Rules
This is a big data analytics workflow funnel ppt powerpoint presentation rules. This is a one stage process. The stages in this process are database, location, social, images, sensor data, email, clickstream, html, actionable intelligence.
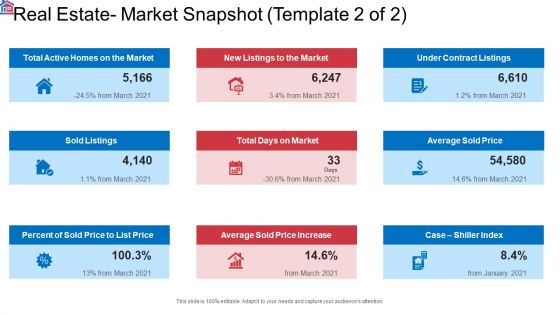
Market Research Analysis Of Housing Sector Real Estate Market Snapshot Price Formats PDF
This is a market research analysis of housing sector real estate market snapshot price formats pdf template with various stages. Focus and dispense information on nine stages using this creative set, that comes with editable features. It contains large content boxes to add your information on topics like price, market, sold listings, average sold price increase. You can also showcase facts, figures, and other relevant content using this PPT layout. Grab it now.

Market Research Analysis Of Housing Sector Real Estate Market Snapshot Average Ppt Outline Example File PDF
Presenting market research analysis of housing sector real estate market snapshot average ppt outline example file pdf to provide visual cues and insights. Share and navigate important information on four stages that need your due attention. This template can be used to pitch topics like sale, market, inventory, price. In addtion, this PPT design contains high resolution images, graphics, etc, that are easily editable and available for immediate download.
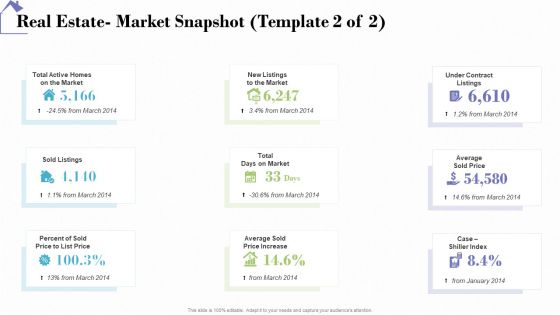
Industry Analysis Of Real Estate And Construction Sector Real Estate Market Snapshot Price Designs PDF
This is a industry analysis of real estate and construction sector real estate market snapshot price designs pdf template with various stages. Focus and dispense information on nine stages using this creative set, that comes with editable features. It contains large content boxes to add your information on topics like price, market, sold listings, average sold price increase. You can also showcase facts, figures, and other relevant content using this PPT layout. Grab it now.
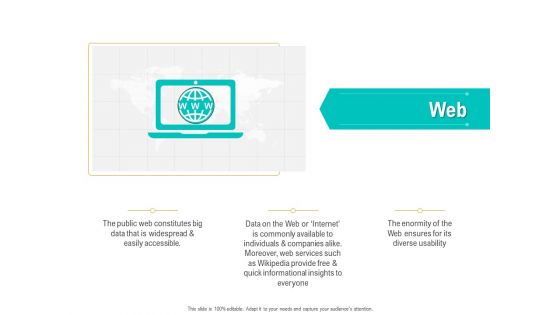
Business Data Analysis Web Mockup PDF
Presenting business data analysis web mockup pdf to provide visual cues and insights. Share and navigate important information on one stage that need your due attention. This template can be used to pitch topics like the public web constitutes big data that is widespread and easily accessible, the enormity of the web ensures for its diverse usability, data on the web or internet is commonly. In addtion, this PPT design contains high resolution images, graphics, etc, that are easily editable and available for immediate download.
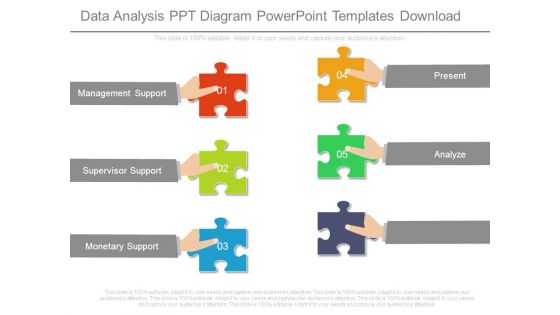
Data Analysis Ppt Diagram Powerpoint Templates Download
This is a data analysis ppt diagram powerpoint templates download. This is a five stage process. The stages in this process are management support, supervisor support, monetary support, present, analyze.
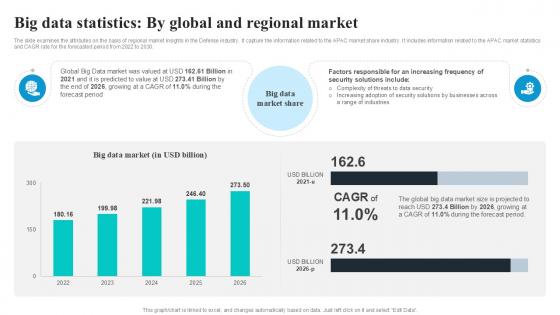
Big Data Statistics By Global Security Industry PPT Sample IR SS V
The slide examines the attributes on the basis of regional market insights in the Defense industry. It capture the information related to the APAC market share industry. It includes information related to the APAC market statistics and CAGR rate for the forecasted period from 2022 to 2030. Slidegeeks is one of the best resources for PowerPoint templates. You can download easily and regulate Big Data Statistics By Global Security Industry PPT Sample IR SS V for your personal presentations from our wonderful collection. A few clicks is all it takes to discover and get the most relevant and appropriate templates. Use our Templates to add a unique zing and appeal to your presentation and meetings. All the slides are easy to edit and you can use them even for advertisement purposes.
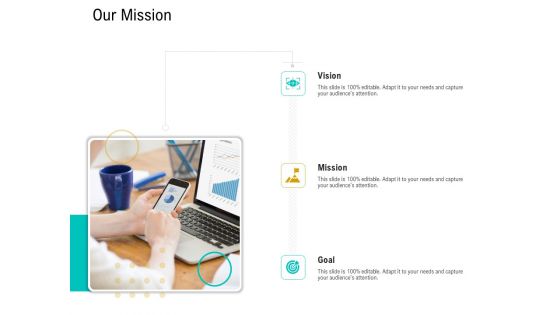
Business Data Analysis Our Mission Inspiration PDF
Presenting business data analysis our mission inspiration pdf to provide visual cues and insights. Share and navigate important information on one stage that need your due attention. This template can be used to pitch topics like vision, mission, goal. In addtion, this PPT design contains high resolution images, graphics, etc, that are easily editable and available for immediate download.
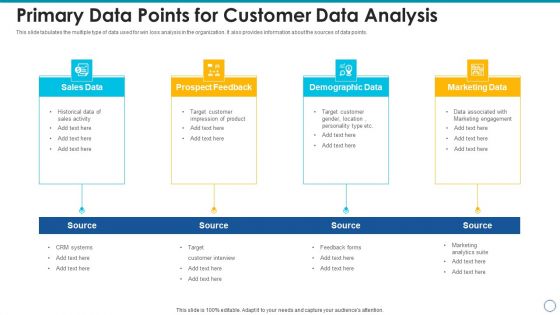
Primary Data Points For Customer Data Analysis Ideas PDF
This slide tabulates the multiple type of data used for win loss analysis in the organization. It also provides information about the sources of data points. Presenting primary data points for customer data analysis ideas pdf to dispense important information. This template comprises four stages. It also presents valuable insights into the topics including sales data, prospect feedback, demographic data, marketing data. This is a completely customizable PowerPoint theme that can be put to use immediately. So, download it and address the topic impactfully.

Competitor Analysis Ppt PowerPoint Presentation Outline Rules
This is a competitor analysis ppt powerpoint presentation outline rules. This is a seven stage process. The stages in this process are revenue, profit, market share, main activity, number of employee.
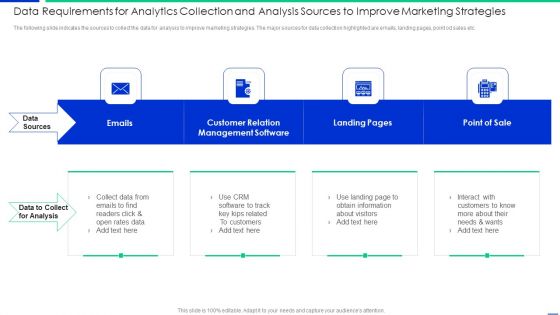
Data Requirements For Analytics Collection And Analysis Sources To Improve Marketing Strategies Download PDF
The following slide indicates the sources to collect the data for analysis to improve marketing strategies. The major sources for data collection highlighted are emails, landing pages, point od sales etc. Persuade your audience using this data requirements for analytics collection and analysis sources to improve marketing strategies download pdf. This PPT design covers four stages, thus making it a great tool to use. It also caters to a variety of topics including emails, management, customers. Download this PPT design now to present a convincing pitch that not only emphasizes the topic but also showcases your presentation skills.
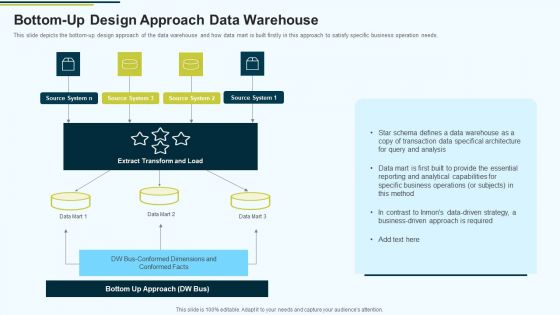
MIS Bottom Up Design Approach Data Warehouse Ppt PowerPoint Presentation Portfolio Show PDF
This slide depicts the bottom-up design approach of the data warehouse and how data mart is built firstly in this approach to satisfy specific business operation needs.Deliver an awe inspiring pitch with this creative MIS Bottom Up Design Approach Data Warehouse Ppt PowerPoint Presentation Portfolio Show PDF bundle. Topics like Schema Defines, Transaction Data Specifical, Reporting And Analytical can be discussed with this completely editable template. It is available for immediate download depending on the needs and requirements of the user.

Graphical Exploratory Data Analysis Powerpoint Slides Clipart
This is a graphical exploratory data analysis powerpoint slides clipart. This is a five stage process. The stages in this process are techniques, information, predictive, focuses, business.
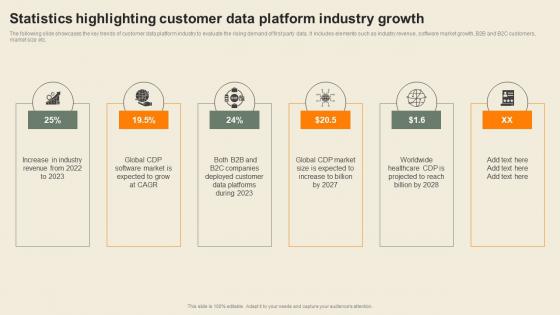
Statistics Highlighting Customer Data Platform Usability Of CDP Software Tool Demonstration Pdf
The following slide showcases the key trends of customer data platform industry to evaluate the rising demand of first party data. It includes elements such as industry revenue, software market growth, B2B and B2C customers, market size etc. Create an editable Statistics Highlighting Customer Data Platform Usability Of CDP Software Tool Demonstration Pdf that communicates your idea and engages your audience. Whether you are presenting a business or an educational presentation, pre-designed presentation templates help save time. Statistics Highlighting Customer Data Platform Usability Of CDP Software Tool Demonstration Pdf is highly customizable and very easy to edit, covering many different styles from creative to business presentations. Slidegeeks has creative team members who have crafted amazing templates. So, go and get them without any delay.
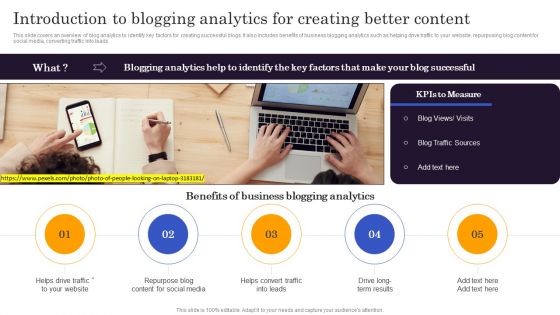
Marketers Guide To Data Analysis Optimization Introduction To Blogging Analytics For Creating Better Content Ideas PDF
This slide covers an overview of blog analytics to identify key factors for creating successful blogs. It also includes benefits of business blogging analytics such as helping drive traffic to your website, repurposing blog content for social media, converting traffic into leads. This Marketers Guide To Data Analysis Optimization Introduction To Blogging Analytics For Creating Better Content Ideas PDF is perfect for any presentation, be it in front of clients or colleagues. It is a versatile and stylish solution for organizing your meetings. The Marketers Guide To Data Analysis Optimization Introduction To Blogging Analytics For Creating Better Content Ideas PDF features a modern design for your presentation meetings. The adjustable and customizable slides provide unlimited possibilities for acing up your presentation. Slidegeeks has done all the homework before launching the product for you. So, do not wait, grab the presentation templates today
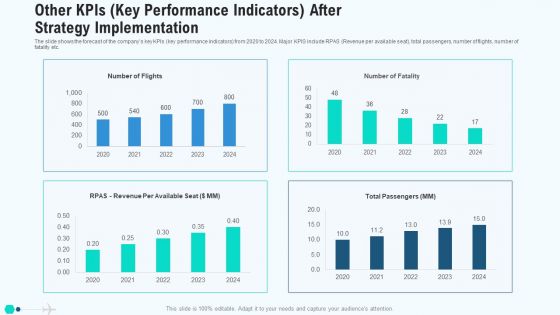
Other Kpis Key Performance Indicators After Strategy Implementation Mockup PDF
The slide shows the forecast of the companys key KPIs key performance indicators from 2020 to 2024. Major KPIS include RPAS Revenue per available seat, total passengers, number of flights, number of fatality etc. Deliver and pitch your topic in the best possible manner with this other kpis key performance indicators after strategy implementation mockup pdf. Use them to share invaluable insights on other kpis key performance indicators after strategy implementation and impress your audience. This template can be altered and modified as per your expectations. So, grab it now.
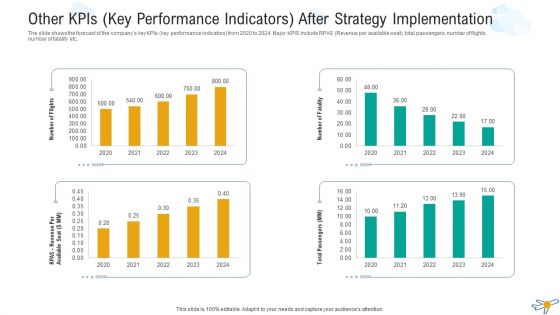
Other Kpis Key Performance Indicators After Strategy Implementation Microsoft PDF
The slide shows the forecast of the companys key KPIs key performance indicators from 2020 to 2024. Major KPIS include RPAS Revenue per available seat, total passengers, number of flights, number of fatality etc. Deliver and pitch your topic in the best possible manner with this other kpis key performance indicators after strategy implementation microsoft pdf. Use them to share invaluable insights on other kpis key performance indicators after strategy implementation and impress your audience. This template can be altered and modified as per your expectations. So, grab it now.

Current Analysis Analysing Retail Store Performance Optimizing Retail Operations With Digital DT SS V
This slide help analyse the declining performance of current key performance indicators of retail store. It includes marketing and sales, inventory management, customer relationship, data utilization, employee productivity, and competitive analysis.Whether you have daily or monthly meetings, a brilliant presentation is necessary. Current Analysis Analysing Retail Store Performance Optimizing Retail Operations With Digital DT SS V can be your best option for delivering a presentation. Represent everything in detail using Current Analysis Analysing Retail Store Performance Optimizing Retail Operations With Digital DT SS V and make yourself stand out in meetings. The template is versatile and follows a structure that will cater to your requirements. All the templates prepared by Slidegeeks are easy to download and edit. Our research experts have taken care of the corporate themes as well. So, give it a try and see the results.

Market Attractiveness Analysis Qualitative Data Analysis Data Protection Ppt PowerPoint Presentation Layouts Example
This is a market attractiveness analysis qualitative data analysis data protection ppt powerpoint presentation layouts example. This is a two stage process. The stages in this process are market attractiveness analysis, qualitative data analysis, data protection.
Magnify Glass Ppt PowerPoint Presentation Themes
This is a magnify glass ppt powerpoint presentation themes. This is a four stage process. The stages in this process are magnifier, search, analysis, marketing, strategy, success.
Magnifying Glass Ppt PowerPoint Presentation Portfolio Layout
This is a magnifying glass ppt powerpoint presentation portfolio layout. This is a six stage process. The stages in this process are magnifier, research, analysis, business, marketing.
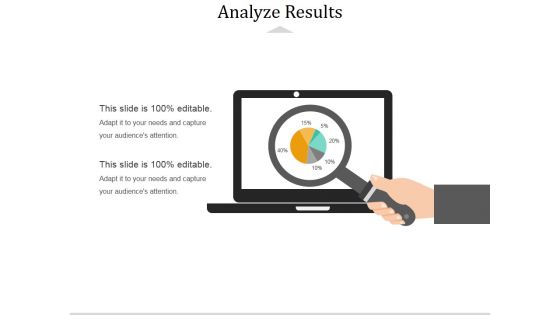
Analyze Results Ppt PowerPoint Presentation Professional Guide
This is a analyze results ppt powerpoint presentation professional guide. This is a two stage process. The stages in this process are magnifier, search, marketing, strategy, analysis, business.

Data Mining Link Analysis Presentation Powerpoint Example
This is a data mining link analysis presentation powerpoint example. This is a ten stage process. The stages in this process are polynomial networks, link analysis, spectral density, kohonen networks, data mining, radial basis functions, associated rules, support vector machines, decision trees, neural network.
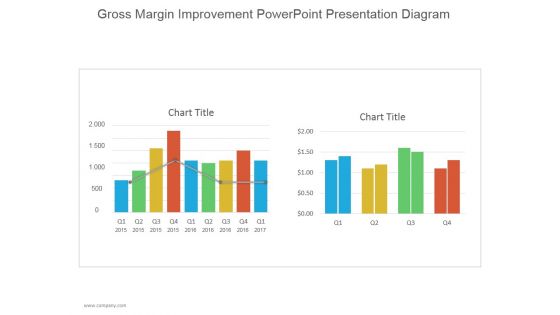
Gross Margin Improvement Ppt PowerPoint Presentation Tips
This is a gross margin improvement ppt powerpoint presentation tips. This is a two stage process. The stages in this process are chart title, business, strategy, marketing, line graph, chart and graph.
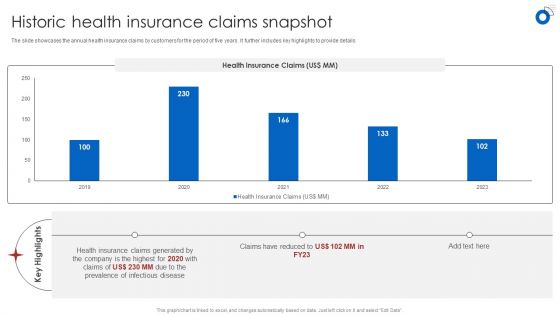
Insurance Business Financial Analysis Historic Health Insurance Claims Snapshot Diagrams PDF
The slide showcases the annual health insurance claims by customers for the period of five years. It further includes key highlights to provide details Boost your pitch with our creative Insurance Business Financial Analysis Historic Health Insurance Claims Snapshot Diagrams PDF. Deliver an awe-inspiring pitch that will mesmerize everyone. Using these presentation templates you will surely catch everyones attention. You can browse the ppts collection on our website. We have researchers who are experts at creating the right content for the templates. So you dont have to invest time in any additional work. Just grab the template now and use them.

Significant Stages Of Financial Audit System Ppt PowerPoint Presentation Backgrounds
This is a significant stages of financial audit system ppt powerpoint presentation backgrounds. This is a eight stage process. The stages in this process are planning of the audit, audit report, review of financial statements, testing of internal controls.

Communication Plan Detailed Ppt PowerPoint Presentation Slides Model
This is a communication plan detailed ppt powerpoint presentation slides model. This is a five stage process. The stages in this process are reports, presentations, project announcements, reviews and meetings, team morale.
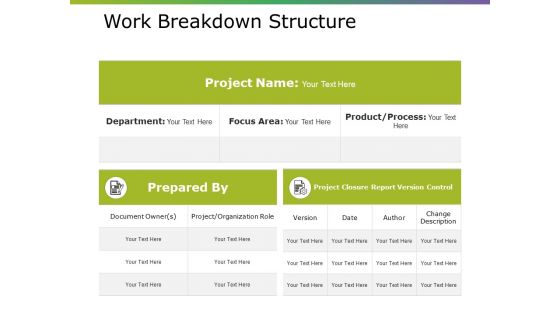
Work Breakdown Structure Ppt PowerPoint Presentation Portfolio Display
This is a work breakdown structure ppt powerpoint presentation portfolio display. This is a three stage process. The stages in this process are project name, prepared by, project closure report version control, department.

Work Breakdown Structure Ppt PowerPoint Presentation Professional Rules
This is a work breakdown structure ppt powerpoint presentation professional rules. This is a two stage process. The stages in this process are project name, department, focus area, product, project closure report version control.

Startup Businesses Sales Forecasting Process Mockup Pdf
This slide presents process for estimating and forecasting sales in startup business plan, helpful in determining true amount of potential revenue. It includes steps such as estimating sales run rate, adjusting seasonality, modifying sales based on market trends and accounting for business plan Pitch your topic with ease and precision using this Startup Businesses Sales Forecasting Process Mockup Pdf. This layout presents information on Sales Run Rate, Adjust Seasonality, Trends. It is also available for immediate download and adjustment. So, changes can be made in the color, design, graphics or any other component to create a unique layout.

Financial Forecasts Digital Physical Training Business Market Entry Plan GTM SS V
The slide outlines future projections showing the estimated growth of the by online fitness coaching business start-up for five years after launch It assists businesses in determining the direction of future trends.Retrieve professionally designed Financial Forecasts Digital Physical Training Business Market Entry Plan GTM SS V to effectively convey your message and captivate your listeners. Save time by selecting pre-made slideshows that are appropriate for various topics, from business to educational purposes. These themes come in many different styles, from creative to corporate, and all of them are easily adjustable and can be edited quickly. Access them as PowerPoint templates or as Google Slides themes. You do not have to go on a hunt for the perfect presentation because Slidegeeks got you covered from everywhere.
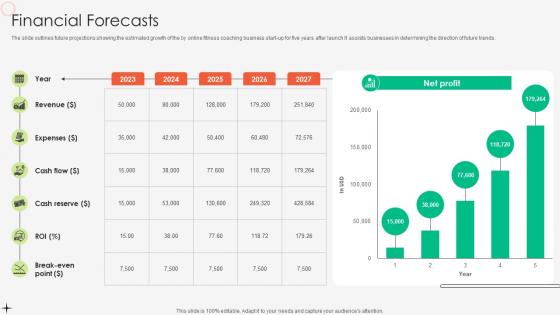
Financial Forecasts Online Fitness Tutoring Business Market Entry Plan GTM SS V
The slide outlines future projections showing the estimated growth of the by online fitness coaching business start-up for five years after launch It assists businesses in determining the direction of future trends.Slidegeeks has constructed Financial Forecasts Online Fitness Tutoring Business Market Entry Plan GTM SS V after conducting extensive research and examination. These presentation templates are constantly being generated and modified based on user preferences and critiques from editors. Here, you will find the most attractive templates for a range of purposes while taking into account ratings and remarks from users regarding the content. This is an excellent jumping-off point to explore our content and will give new users an insight into our top-notch PowerPoint Templates.
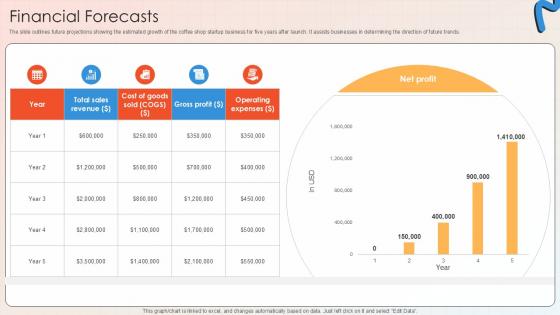
Financial Forecasts Apparel And Shoes E Commerce Market PPT Slide GTM SS V
The slide outlines future projections showing the estimated growth of the coffee shop startup business for five years after launch. It assists businesses in determining the direction of future trends. Present like a pro with Financial Forecasts Apparel And Shoes E Commerce Market PPT Slide GTM SS V. Create beautiful presentations together with your team, using our easy-to-use presentation slides. Share your ideas in real-time and make changes on the fly by downloading our templates. So whether you are in the office, on the go, or in a remote location, you can stay in sync with your team and present your ideas with confidence. With Slidegeeks presentation got a whole lot easier. Grab these presentations today.

Data Lineage Methods Features Of Data Lineage Tools Sample PDF
This slide talks about the features of data lineage tools that include visualization, customization and connection, reports, data catalogue, simple installation, and automated documentation. These features make information transparent, reliable, and ready for analysis. Slidegeeks is here to make your presentations a breeze with Data Lineage Methods Features Of Data Lineage Tools Sample PDF With our easy-to-use and customizable templates, you can focus on delivering your ideas rather than worrying about formatting. With a variety of designs to choose from, you are sure to find one that suits your needs. And with animations and unique photos, illustrations, and fonts, you can make your presentation pop. So whether you are giving a sales pitch or presenting to the board, make sure to check out Slidegeeks first
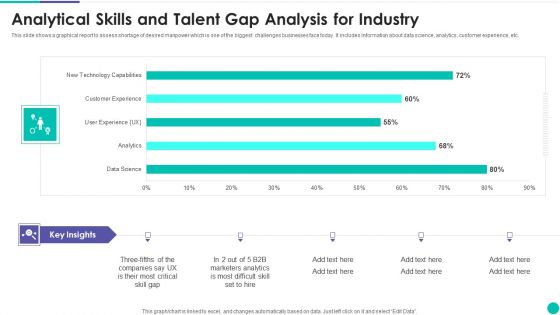
Analytical Skills And Talent Gap Analysis For Industry Template PDF
This slide shows a graphical report to assess shortage of desired manpower which is one of the biggest challenges businesses face today. It includes information about data science, analytics, customer experience, etc. Showcasing this set of slides titled Analytical Skills And Talent Gap Analysis For Industry Template PDF. The topics addressed in these templates are Marketers, Analytics, Data Science. All the content presented in this PPT design is completely editable. Download it and make adjustments in color, background, font etc. as per your unique business setting.

Data Warehousing IT What Is Operational Data Store Ppt Infographic Template Images PDF
This slide illustrates the operational data store and its architecture, including data sources such as unstructured and structured, ETL operations, and applications. Deliver and pitch your topic in the best possible manner with this data warehousing it what is operational data store ppt infographic template images pdf. Use them to share invaluable insights on modeling, reporting, bi system, application, data sources, operational data store, enterprise data warehouse and impress your audience. This template can be altered and modified as per your expectations. So, grab it now.
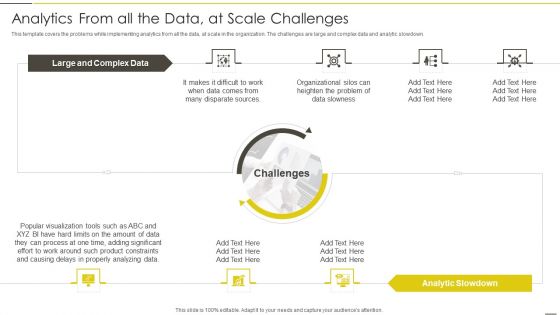
Administered Data And Analytic Quality Playbook Analytics From All The Data Information PDF
This template covers the problems while implementing analytics from all the data, at scale in the organization. The challenges are large and complex data and analytic slowdown.Deliver an awe inspiring pitch with this creative Administered Data And Analytic Quality Playbook Analytics From All The Data Information PDF bundle. Topics like Disparate Sources, Organizational Silos, Heighten Problem can be discussed with this completely editable template. It is available for immediate download depending on the needs and requirements of the user.
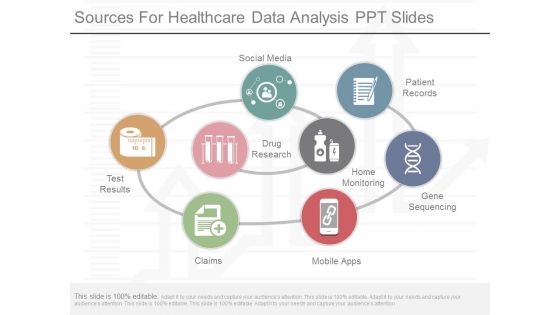
Sources For Healthcare Data Analysis Ppt Slides
This is a sources for healthcare data analysis ppt slides. This is a eight stage process. The stages in this process are social media, drug research, patient records, home monitoring, gene sequencing, mobile apps, claims, test results.

Toolkit For Data Science And Analytics Transition Data Analytics Project Plan Designs PDF
This slide shows the data analytics lifecycle covering multiple stages starting from presenting the business case to data identification, data validation, analysis and ending at data visualization and utilization of results. Present like a pro with Toolkit For Data Science And Analytics Transition Data Analytics Project Plan Designs PDF Create beautiful presentations together with your team, using our easy to use presentation slides. Share your ideas in real time and make changes on the fly by downloading our templates. So whether you are in the office, on the go, or in a remote location, you can stay in sync with your team and present your ideas with confidence. With Slidegeeks presentation got a whole lot easier. Grab these presentations today.
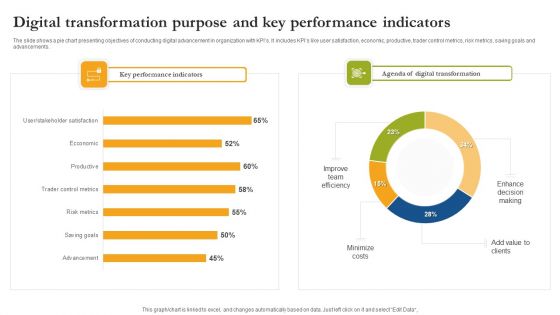
Digital Transformation Purpose And Key Performance Indicators Formats PDF
The slide shows a pie chart presenting objectives of conducting digital advancement in organization with KPIs. It includes KPIs like user satisfaction, economic, productive, trader control metrics, risk metrics, saving goals and advancements. Pitch your topic with ease and precision using this Digital Transformation Purpose And Key Performance Indicators Formats PDF. This layout presents information on Key Performance Indicators, Digital Transformation, Minimize Costs. It is also available for immediate download and adjustment. So, changes can be made in the color, design, graphics or any other component to create a unique layout.

Administered Data And Analytic Quality Playbook How To Overcome Analytics From All The Data Guidelines PDF
This template illustrates that the high performance computation engine of the analytics software company, the data platform connects to various data sources, automates the data preparation workflow, and scales to big data scenarios.Deliver and pitch your topic in the best possible manner with this Administered Data And Analytic Quality Playbook How To Overcome Analytics From All The Data Guidelines PDF Use them to share invaluable insights on Generation Analytics, Across Enterprise, Preparation Capabilities and impress your audience. This template can be altered and modified as per your expectations. So, grab it now.

Other Kpis Key Performance Indicators After Strategy Implementation Professional PDF
The slide shows the forecast of the companys key KPIs key performance indicators from 2020 to 2024. Major KPIS include RPAS Revenue per available seat, total passengers, number of flights, number of fatality etc.Deliver and pitch your topic in the best possible manner with this other KPIs key performance indicators after strategy implementation professional pdf. Use them to share invaluable insights on total passengers, number of flights, 2020 to 2024 and impress your audience. This template can be altered and modified as per your expectations. So, grab it now.

Data Lake Architecture Future Of Data Analysis Comparison Between Data Warehouse Diagrams PDF
This slide represents the comparison between data warehouse, data lake and data lakehouse based on the period and components of both, along with information insights carried out.Deliver and pitch your topic in the best possible manner with this Data Lake Architecture Future Of Data Analysis Comparison Between Data Warehouse Diagrams PDF. Use them to share invaluable insights on Data Warehouse, Unstructured Data, Streaming Analytics and impress your audience. This template can be altered and modified as per your expectations. So, grab it now.

Types Of Actions As Per Target Audience Comprehensive Guide Formats Pdf
This slide mentions the various actions to be performed by target audiences for which brand story is formulated by marketers. The key goals include- Inciting Action, Conveying values, Imparting knowledge and fostering collaboration. The Types Of Actions As Per Target Audience Comprehensive Guide Formats Pdf is a compilation of the most recent design trends as a series of slides. It is suitable for any subject or industry presentation, containing attractive visuals and photo spots for businesses to clearly express their messages. This template contains a variety of slides for the user to input data, such as structures to contrast two elements, bullet points, and slides for written information. Slidegeeks is prepared to create an impression.

Business Line Review Powerpoint Show
This is a business line review powerpoint show. This is a four stage process. The stages in this process are business, marketing, management, strategy, growth.
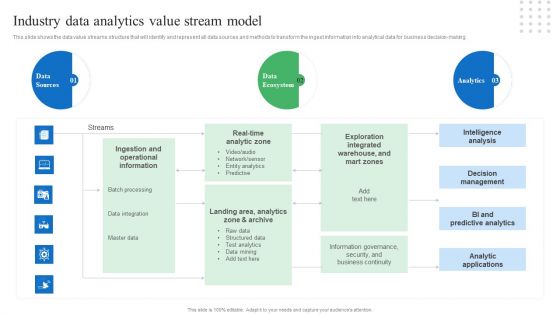
Toolkit For Data Science And Analytics Transition Industry Data Analytics Value Stream Model Brochure PDF
This slide shows the data value streams structure that will identify and represent all data sources and methods to transform the ingest information into analytical data for business decision-making. Whether you have daily or monthly meetings, a brilliant presentation is necessary. Toolkit For Data Science And Analytics Transition Industry Data Analytics Value Stream Model Brochure PDF can be your best option for delivering a presentation. Represent everything in detail using Toolkit For Data Science And Analytics Transition Industry Data Analytics Value Stream Model Brochure PDF and make yourself stand out in meetings. The template is versatile and follows a structure that will cater to your requirements. All the templates prepared by Slidegeeks are easy to download and edit. Our research experts have taken care of the corporate themes as well. So, give it a try and see the results.
Big Data Use Statistics Icon Ppt Ideas Layouts pdf
Pitch your topic with ease and precision using this Big Data Use Statistics Icon Ppt Ideas Layouts pdf. This layout presents information on Big Data, Use Statistics, Icon. It is also available for immediate download and adjustment. So, changes can be made in the color, design, graphics or any other component to create a unique layout.

Business Diagram 3d Thumb Chart And Tablet For Data Representation PowerPoint Slide
This business diagram displays graphic of 3d thumb up chart with icons on computer screen. This business slide contains the concept of business data representation. Use this diagram to build professional presentations for your viewers.

Pie Chart Infographic For Data Analysis PowerPoint Templates
This is one of the most downloaded PowerPoint template. This slide can be used for various purposes and to explain a number of processes. This can be included in your presentation to explain each step of a process and even include its relevance and importance in a single diagram. Using the uneven circular structure of the pie chart, the presenter can also explain random steps or highlight particular steps of process or parts of an organization or business that need special attention of any kind to the audience. Additionally, you can use this slide to show a transformation process or highlight key features of a product.
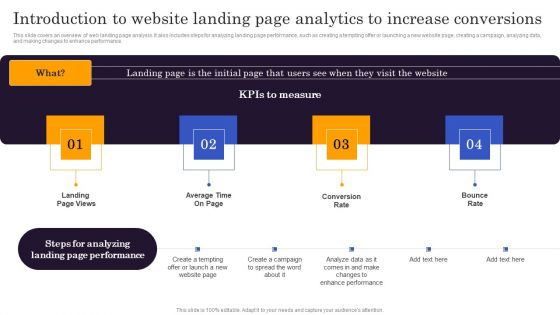
Marketers Guide To Data Analysis Optimization Introduction To Website Landing Page Analytics To Increase Portrait PDF
This slide covers an overview of web landing page analysis. It also includes steps for analyzing landing page performance, such as creating a tempting offer or launching a new website page, creating a campaign, analyzing data, and making changes to enhance performance. Retrieve professionally designed Marketers Guide To Data Analysis Optimization Introduction To Website Landing Page Analytics To Increase Portrait PDF to effectively convey your message and captivate your listeners. Save time by selecting pre made slideshows that are appropriate for various topics, from business to educational purposes. These themes come in many different styles, from creative to corporate, and all of them are easily adjustable and can be edited quickly. Access them as PowerPoint templates or as Google Slides themes. You do not have to go on a hunt for the perfect presentation because Slidegeeks got you covered from everywhere.

 Home
Home