Summary Of Year

Big Data Market Forecast Ppt PowerPoint Presentation Ideas Information
This is a big data market forecast ppt powerpoint presentation ideas information. This is a five stage process. The stages in this process are years, planning, growth, business, marketing.

Line Bubble Chart Ppt PowerPoint Presentation Portfolio Slide Portrait
This is a line bubble chart ppt powerpoint presentation portfolio slide portrait. This is a six stage process. The stages in this process are highest profit, financial year, profit in sales, growth, business.

Key Timelines And Deadline Ppt PowerPoint Presentation Styles Vector
This is a key timelines and deadline ppt powerpoint presentation styles vector. This is a four stage process. The stages in this process are years, planning, business, marketing, management.

Mid Term Goals Timeline Ppt PowerPoint Presentation Infographics Demonstration
This is a mid term goals timeline ppt powerpoint presentation infographics demonstration. This is a four stage process. The stages in this process are timeline, year, management, business, planning.

Scatter Bubble Chart Ppt PowerPoint Presentation Professional Graphics Pictures
This is a scatter bubble chart ppt powerpoint presentation professional graphics pictures. This is a one stage process. The stages in this process are profit in sales, financial year, highest profit, product.
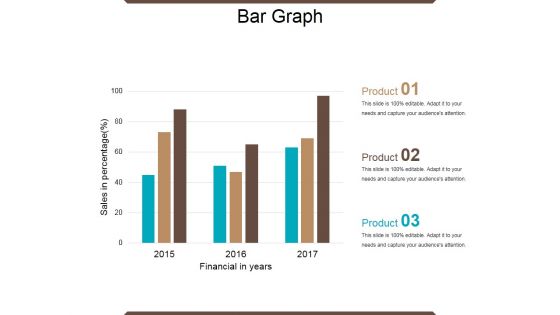
Bar Graph Ppt PowerPoint Presentation Ideas Graphic Tips
This is a bar graph ppt powerpoint presentation ideas graphic tips. This is a three stage process. The stages in this process are financial year, sales in percentage, product, bar graph, growth.

Clustered Column Line Ppt PowerPoint Presentation Show Influencers
This is a clustered column line ppt powerpoint presentation show influencers. This is a four stage process. The stages in this process are financial year, sales in percentage, product, growth, success.
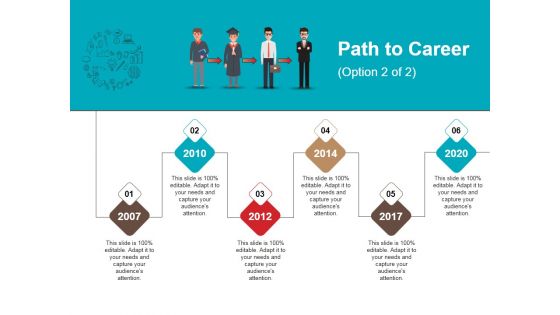
Path To Career Ppt PowerPoint Presentation Slides Professional
This is a path to career ppt powerpoint presentation slides professional. This is a six stage process. The stages in this process are year, growth, success, time planning, business.

Path To Career Ppt PowerPoint Presentation Professional Picture
This is a path to career ppt powerpoint presentation professional picture. This is a six stage process. The stages in this process are year, growth, success, time planning, business.

Clustered Column Ppt PowerPoint Presentation Ideas Graphic Tips
This is a clustered column ppt powerpoint presentation ideas graphic tips. This is a two stage process. The stages in this process are financial year, sales in percentage, product, graph, business.
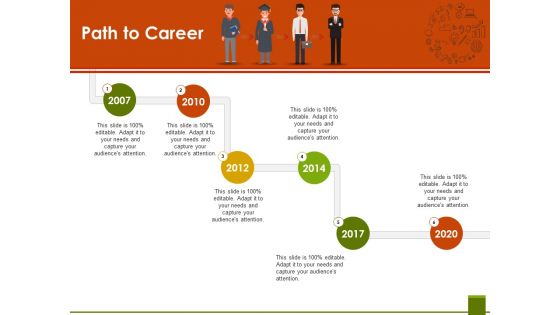
Path To Career Ppt PowerPoint Presentation Pictures Objects
This is a path to career ppt powerpoint presentation pictures objects. This is a six stage process. The stages in this process are path to career, years, business, management, timelines.

Process Management In Tqm Ppt PowerPoint Presentation Show Aids
This is a process management in tqm ppt powerpoint presentation show aids. This is a five stage process. The stages in this process are process, management, years, business, icons.
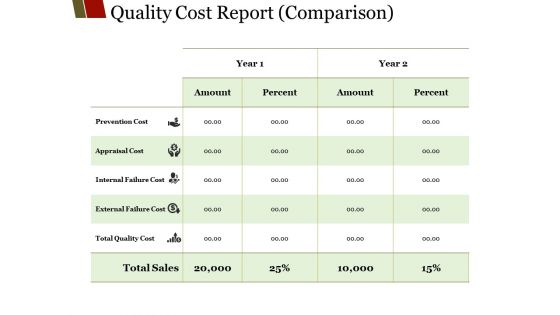
Quality Cost Report Comparison Ppt PowerPoint Presentation Visual Aids Model
This is a quality cost report comparison ppt powerpoint presentation visual aids model. This is a five stage process. The stages in this process are amount, percent, year, prevention cost, prevention cost.
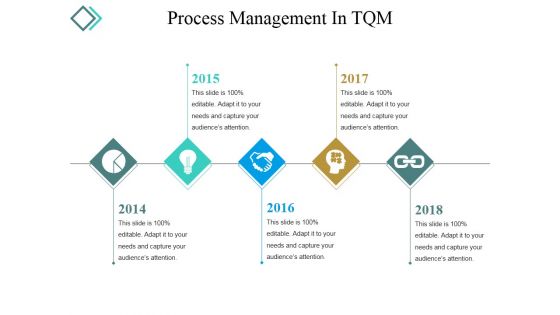
Process Management In Tqm Ppt PowerPoint Presentation Infographics Gridlines
This is a process management in tqm ppt powerpoint presentation infographics gridlines. This is a five stage process. The stages in this process are year, growth, success, time planning, business.
Scatter Bubble Chart Ppt PowerPoint Presentation Icon Elements
This is a scatter bubble chart ppt powerpoint presentation icon elements. This is a six stage process. The stages in this process are highest profit, profit, financial year, product.

Bar Chart Ppt PowerPoint Presentation Professional Graphics Download
This is a bar chart ppt powerpoint presentation professional graphics download. This is a seven stage process. The stages in this process are sales in percentage, financial years, chart, business.
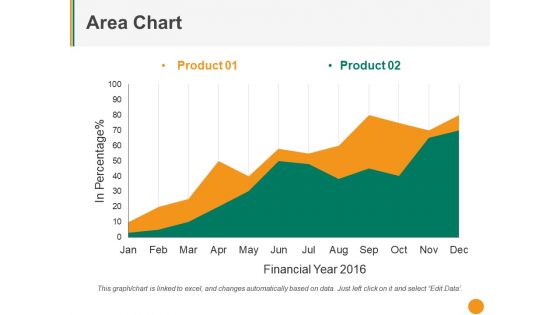
Area Chart Ppt PowerPoint Presentation File Graphic Tips
This is a area chart ppt powerpoint presentation file graphic tips. This is a two stage process. The stages in this process are product, in percentage, financial year, business, growth.

Process Management In Tqm Ppt PowerPoint Presentation Portfolio Information
This is a process management in tqm ppt powerpoint presentation portfolio information. This is a five stage process. The stages in this process are process, management, years, business, icons.

Bar Graph Ppt PowerPoint Presentation Infographics Graphics Design
This is a bar graph ppt powerpoint presentation infographics graphics design. This is a five stage process. The stages in this process are bar graph, business, years, marketing, management.
Planning Process In Tqm Ppt PowerPoint Presentation Icon Graphics Example
This is a planning process in tqm ppt powerpoint presentation icon graphics example. This is a four stage process. The stages in this process are timelines, years, business, management.
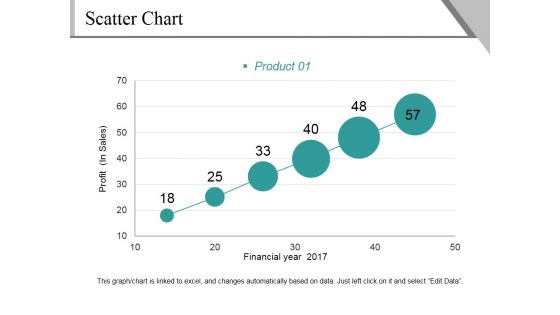
Scatter Chart Ppt PowerPoint Presentation File Background Image
This is a scatter chart ppt powerpoint presentation file background image. This is a six stage process. The stages in this process are profit, financial year, product, growth, success.
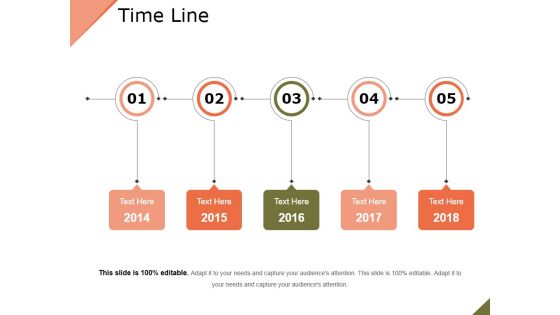
Time Line Ppt PowerPoint Presentation Show Graphics Pictures
This is a time line ppt powerpoint presentation show graphics pictures. This is a five stage process. The stages in this process are year, growth, success, time planning, business.
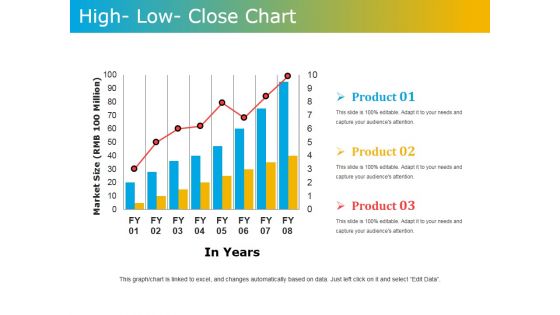
High Low Close Chart Ppt PowerPoint Presentation Model Graphics Tutorials
This is a high low close chart ppt powerpoint presentation model graphics tutorials. This is a three stage process. The stages in this process are market size, in years, product.
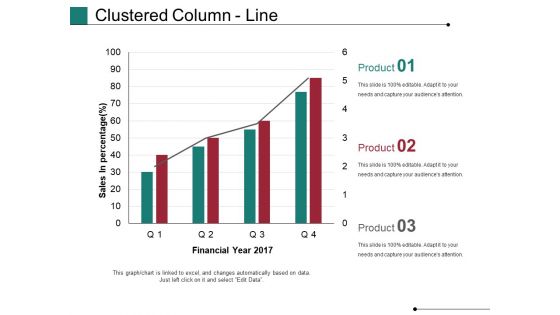
Clustered Column Line Ppt PowerPoint Presentation Model Rules
This is a clustered column line ppt powerpoint presentation model rules. This is a four stage process. The stages in this process are financial year, sales in percentage, business, marketing, growth, graph.
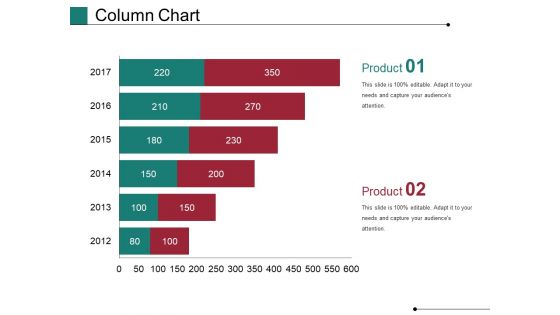
Column Chart Ppt PowerPoint Presentation Show Master Slide
This is a column chart ppt powerpoint presentation show master slide. This is a six stage process. The stages in this process are financial, years, business, marketing, finance, graph.
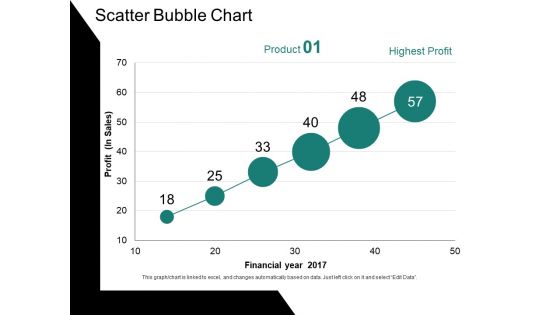
Scatter Bubble Chart Ppt PowerPoint Presentation Ideas Gallery
This is a scatter bubble chart ppt powerpoint presentation ideas gallery. This is a six stage process. The stages in this process are profit, financial year, chart, business, growth.
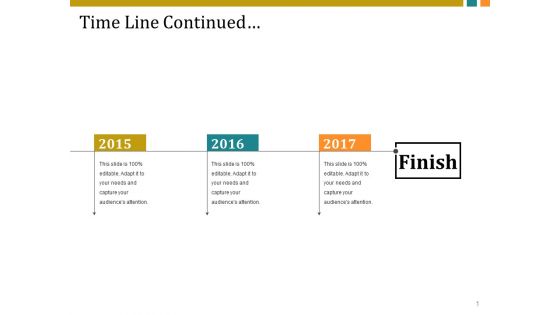
Time Line Continued Ppt PowerPoint Presentation Slides Example
This is a time line continued ppt powerpoint presentation slides example. This is a three stage process. The stages in this process are finish, timeline, business, management, planning, years.
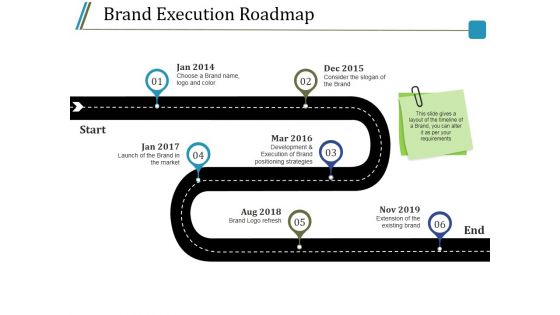
Brand Execution Roadmap Ppt PowerPoint Presentation Model Introduction
This is a brand execution roadmap ppt powerpoint presentation model introduction. This is a six stage process. The stages in this process are brand logo refresh, extension of the existing brand, timeline, year, growth.

Line Chart Ppt PowerPoint Presentation Infographics Graphic Images
This is a line chart ppt powerpoint presentation infographics graphic images. This is a two stage process. The stages in this process are sales in percentage, financial years, growth, business, marketing.
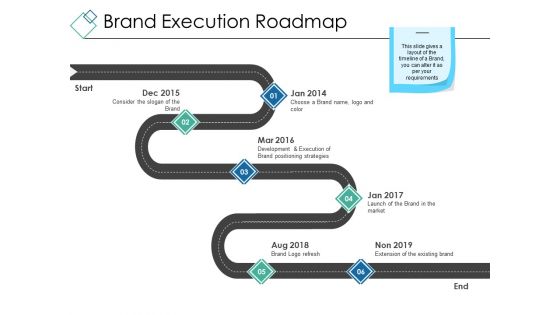
Brand Execution Roadmap Ppt PowerPoint Presentation Styles Design Inspiration
This is a brand execution roadmap ppt powerpoint presentation styles design inspiration. This is a six stage process. The stages in this process are start, end, roadmap, years, business.

Column Chart Ppt PowerPoint Presentation Gallery Graphics Example
This is a column chart ppt powerpoint presentation gallery graphics example. This is a two stage process. The stages in this process are expenditure in, years, business, marketing, growth.
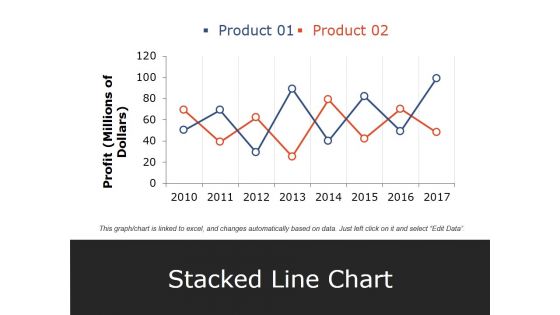
Stacked Line Chart Ppt PowerPoint Presentation Pictures Elements
This is a stacked line chart ppt powerpoint presentation pictures elements. This is a two stage process. The stages in this process are product, profit, stacked line chart, year, business.
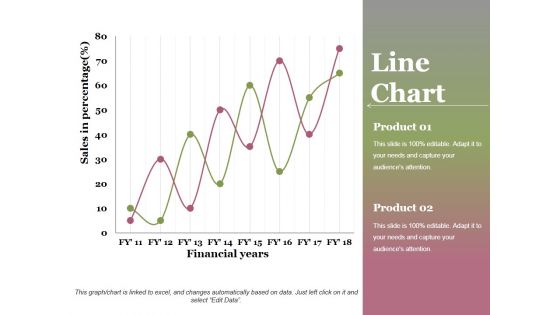
Line Chart Ppt PowerPoint Presentation Professional Graphics Design
This is a line chart ppt powerpoint presentation professional graphics design. This is a two stage process. The stages in this process are financial years, sales in percentage, product, growth, success.
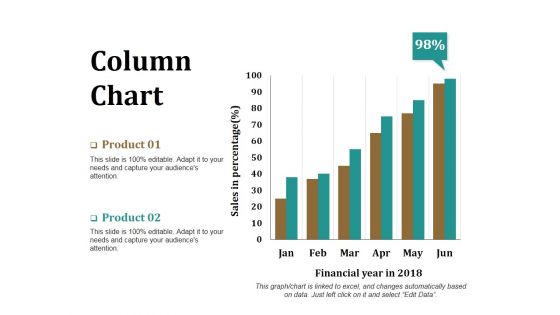
Column Chart Ppt PowerPoint Presentation Model Graphics Download
This is a column chart ppt powerpoint presentation model graphics download. This is a two stage process. The stages in this process are product, financial year, sales in percentage, bar graph, success.

Line Chart Ppt PowerPoint Presentation File Example File
This is a line chart ppt powerpoint presentation file example file. This is a two stage process. The stages in this process are product, in percentage, in years, growth, success.
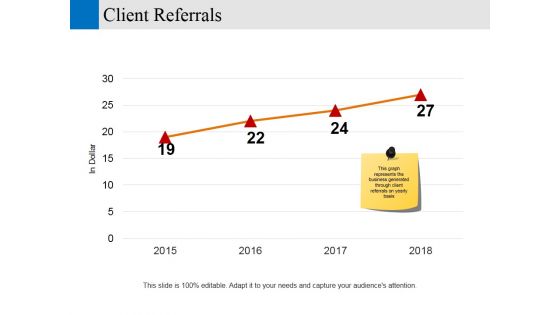
client referrals ppt powerpoint presentation visual aids show
This is a client referrals ppt powerpoint presentation visual aids show. This is a four stage process. The stages in this process are in dollar, years, business, marketing, growth.

Scatter Bubble Chart Ppt PowerPoint Presentation Gallery Designs Download
This is a scatter bubble chart ppt powerpoint presentation gallery designs download. This is a six stage process. The stages in this process are financial year, profit, business, marketing, strategy.
Clustered Column Line Ppt PowerPoint Presentation Icon Good
This is a clustered column line ppt powerpoint presentation icon good. This is a three stage process. The stages in this process are product, financial year, bar graph, business, growth.
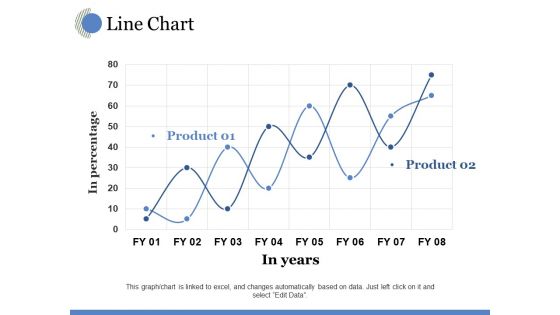
Line Chart Ppt PowerPoint Presentation Model Visual Aids
This is a line chart ppt powerpoint presentation model visual aids. This is a two stage process. The stages in this process are in years, in percentage, growth, business, marketing.
Sales Performance Of Competitors Ppt PowerPoint Presentation Show Icon
This is a sales performance of competitors ppt powerpoint presentation show icon. This is a three stage process. The stages in this process are own business, competitor, year, business, marketing.

Sales Performance Of Competitors Ppt PowerPoint Presentation Portfolio Sample
This is a sales performance of competitors ppt powerpoint presentation portfolio sample. This is a three stage process. The stages in this process are business, marketing, finance, graph, years.
Sales Kpi Tracker Ppt PowerPoint Presentation Gallery Shapes
This is a sales kpi tracker ppt powerpoint presentation gallery shapes. This is a six stage process. The stages in this process are target growth, leads created, sales ratio, last year, stretched growth.
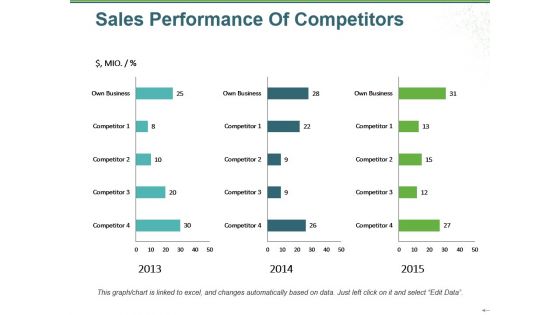
Sales Performance Of Competitors Ppt PowerPoint Presentation Portfolio Examples
This is a sales performance of competitors ppt powerpoint presentation portfolio examples. This is a three stage process. The stages in this process are own business, competitor, year, step, marketing.

Bar Diagram Ppt PowerPoint Presentation Pictures Background Image
This is a bar diagram ppt powerpoint presentation pictures background image. This is a three stage process. The stages in this process are financial in years, sales in percentage, bar graph, growth, success.

Column Chart Ppt PowerPoint Presentation Slides Visual Aids
This is a column chart ppt powerpoint presentation slides visual aids. This is a six stage process. The stages in this process are bar graph, growth, success, sales in percentage, financial year.

Column Chart Ppt PowerPoint Presentation Portfolio Slide Download
This is a column chart ppt powerpoint presentation portfolio slide download. This is a two stage process. The stages in this process are product, year, bar graph, success, business.
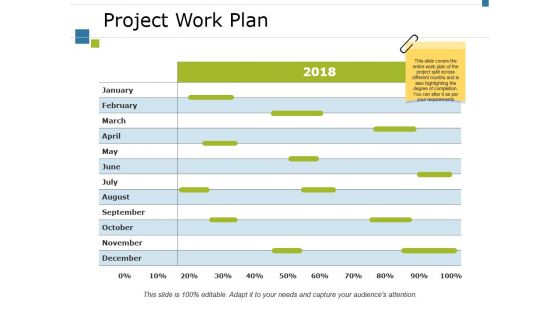
Project Work Plan Ppt PowerPoint Presentation Slides Example Introduction
This is a project work plan ppt powerpoint presentation slides example introduction. This is a nine stage process. The stages in this process are calendar, time planning, year, month, business.
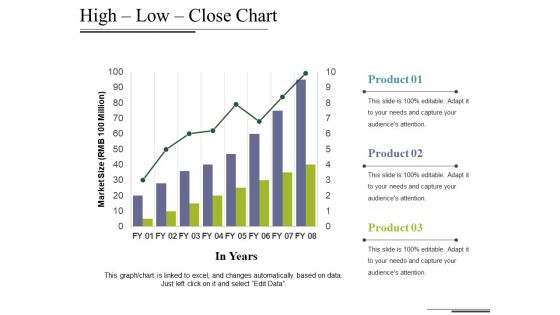
High Low Close Chart Ppt PowerPoint Presentation Styles Maker
This is a high low close chart ppt powerpoint presentation styles maker. This is a three stage process. The stages in this process are market size, in years, growth, business, marketing, graph.
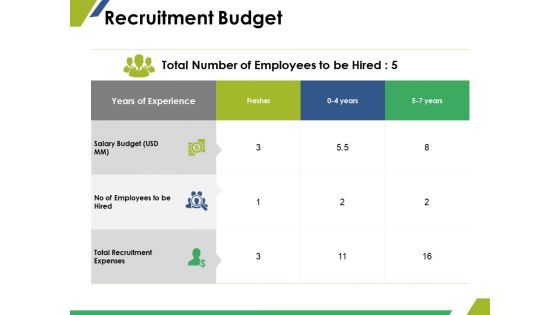
Recruitment Budget Ppt PowerPoint Presentation Show Graphic Tips
This is a recruitment budget ppt powerpoint presentation show graphic tips. This is a three stage process. The stages in this process are fresher, years, salary budget, no of employees to be hired, total recruitment expenses.

Sales Performance Of Competitors Ppt PowerPoint Presentation Inspiration Example
This is a sales performance of competitors ppt powerpoint presentation inspiration example. This is a three stage process. The stages in this process are business, marketing, year, bar graph, finance.

Competitive Landscape Model Ppt PowerPoint Presentation Complete Deck With Slides
This is a competitive landscape model ppt powerpoint presentation complete deck with slides. This is a one stage process. The stages in this process are competitive, landscape, model, year, business.
Major Roadblocks Or Obstacles Ppt PowerPoint Presentation Icon Topics
This is a major roadblocks or obstacles ppt powerpoint presentation icon topics. This is a four stage process. The stages in this process are timeline, strategy, planning, years, management.

Key Highlights Ppt PowerPoint Presentation Gallery Background Images
This is a key highlights ppt powerpoint presentation gallery background images. This is a eight stage process. The stages in this process are average roce, certified welders, countries, leader in automobile, years.

Column Chart Ppt PowerPoint Presentation Gallery Slide Portrait
This is a column chart ppt powerpoint presentation gallery slide portrait. This is a two stage process. The stages in this process are sales in percentage, financial year, product, bar graph, growth.
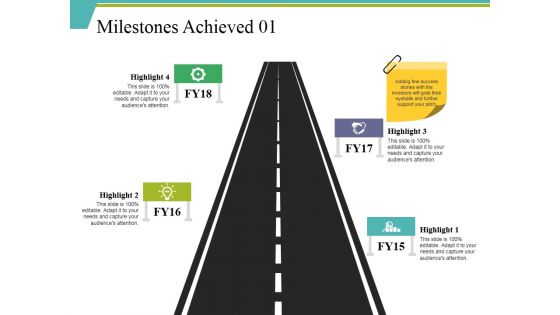
Milestones Achieved 1 Ppt PowerPoint Presentation Ideas Slide Download
This is a milestones achieved 1 ppt powerpoint presentation ideas slide download. This is a four stage process. The stages in this process are year, growth, success, time planning, highlight.

Bar Chart Ppt PowerPoint Presentation Visual Aids Diagrams
This is a bar chart ppt powerpoint presentation visual aids diagrams. This is a two stage process. The stages in this process are business, marketing, financial years, sales in percentage, graph.
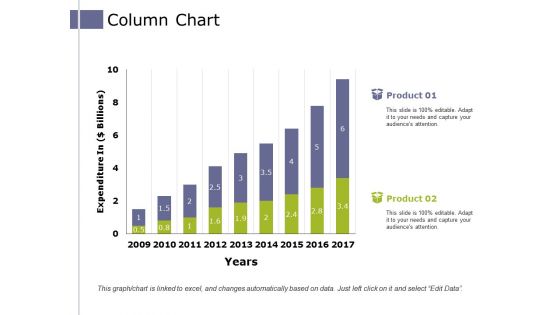
Column Chart Ppt PowerPoint Presentation Styles Graphics Design
This is a column chart ppt powerpoint presentation styles graphics design. This is a two stage process. The stages in this process are expenditure in, product, years, growth, success.
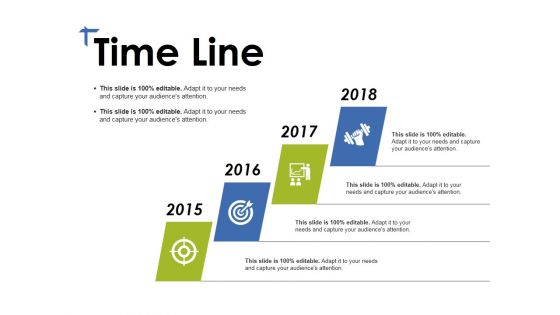
Time Line Ppt PowerPoint Presentation File Design Ideas
This is a time line ppt powerpoint presentation file design ideas. This is a four stage process. The stages in this process are year, growth, success, time planning, business.
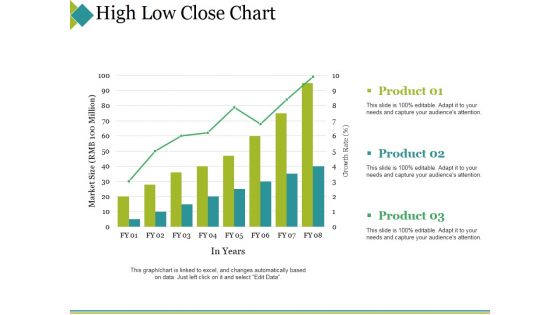
High Low Close Chart Ppt PowerPoint Presentation Portfolio Topics
This is a high low close chart ppt powerpoint presentation portfolio topics. This is a three stage process. The stages in this process are product, market size, in years, success, bar graph.
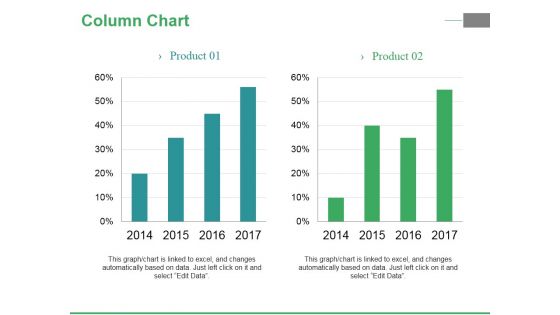
Column Chart Ppt PowerPoint Presentation Pictures Graphic Images
This is a column chart ppt powerpoint presentation pictures graphic images. This is a two stage process. The stages in this process are product, years, growth, success, bar graph.

 Home
Home