Startup Executive Summary
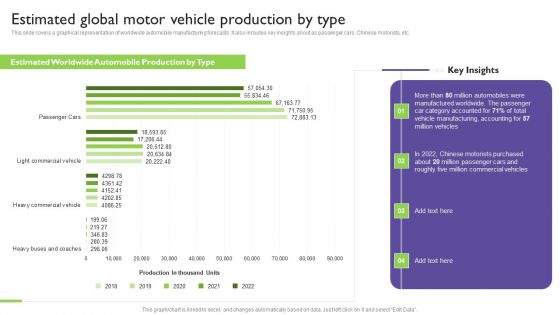
Global Automotive Industry Analysis Estimated Global Motor Vehicle Production By Type Graphics PDF
This slide covers a graphical representation of worldwide automobile manufacturing forecasts. It also includes key insights about as passenger cars, Chinese motorists, etc. Coming up with a presentation necessitates that the majority of the effort goes into the content and the message you intend to convey. The visuals of a PowerPoint presentation can only be effective if it supplements and supports the story that is being told. Keeping this in mind our experts created Global Automotive Industry Analysis Estimated Global Motor Vehicle Production By Type Graphics PDF to reduce the time that goes into designing the presentation. This way, you can concentrate on the message while our designers take care of providing you with the right template for the situation.

BI Technique For Data Informed Decisions Sap Analytics Cloud Dashboard For Financial Reporting Portrait PDF
This slide illustrates the SAP Analytics Cloud dashboard for financial reporting in terms of net revenue, operating profit, cost of goods sold, profitability trend and net revenue by country. It also provides details of net worth of incoming order and order distribution by country. Coming up with a presentation necessitates that the majority of the effort goes into the content and the message you intend to convey. The visuals of a PowerPoint presentation can only be effective if it supplements and supports the story that is being told. Keeping this in mind our experts created BI Technique For Data Informed Decisions Sap Analytics Cloud Dashboard For Financial Reporting Portrait PDF to reduce the time that goes into designing the presentation. This way, you can concentrate on the message while our designers take care of providing you with the right template for the situation.

Cios Guide To Optimize Determine Suitable IT Cost Optimization Solutions With Cost Microsoft PDF
This slide provides information regarding selection of suitable IT cost optimization solution by analyzing on various parameters such as optimizing hybrid cloud, data value maximization, secure infrastructure, etc. with cost. Coming up with a presentation necessitates that the majority of the effort goes into the content and the message you intend to convey. The visuals of a PowerPoint presentation can only be effective if it supplements and supports the story that is being told. Keeping this in mind our experts created Cios Guide To Optimize Determine Suitable IT Cost Optimization Solutions With Cost Microsoft PDF to reduce the time that goes into designing the presentation. This way, you can concentrate on the message while our designers take care of providing you with the right template for the situation.
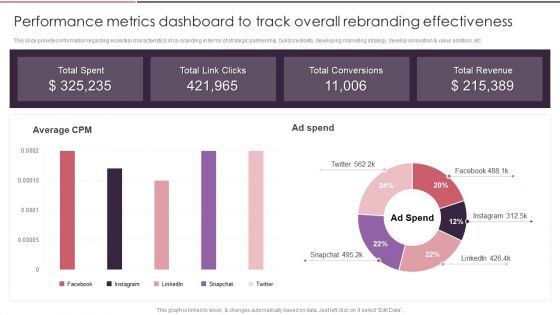
Rebranding Brand Fresh Face Development Performance Metrics Dashboard To Track Overall Rules PDF
This slide provides information regarding essential characteristics of co-branding in terms of strategic partnership, build credibility, developing marketing strategy, develop innovation and value addition, etc. Coming up with a presentation necessitates that the majority of the effort goes into the content and the message you intend to convey. The visuals of a PowerPoint presentation can only be effective if it supplements and supports the story that is being told. Keeping this in mind our experts created Rebranding Brand Fresh Face Development Performance Metrics Dashboard To Track Overall Rules PDF to reduce the time that goes into designing the presentation. This way, you can concentrate on the message while our designers take care of providing you with the right template for the situation.

Formulating Video Marketing Strategies To Enhance Sales Measuring ROI Of Video Marketing Rules PDF
The following slide illustrates a chart highlighting the return on investment ROI from different social media platforms using video marketing strategy. The key channels are facebook, instagram and YouTube. Coming up with a presentation necessitates that the majority of the effort goes into the content and the message you intend to convey. The visuals of a PowerPoint presentation can only be effective if it supplements and supports the story that is being told. Keeping this in mind our experts created Formulating Video Marketing Strategies To Enhance Sales Measuring ROI Of Video Marketing Rules PDF to reduce the time that goes into designing the presentation. This way, you can concentrate on the message while our designers take care of providing you with the right template for the situation.
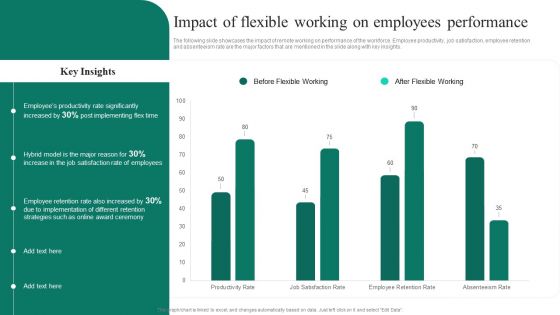
Adopting Flexible Work Policy Impact Of Flexible Working On Employees Performance Ideas PDF
The following slide showcases the impact of remote working on performance of the workforce. Employee productivity, job satisfaction, employee retention and absenteeism rate are the major factors that are mentioned in the slide along with key insights. Coming up with a presentation necessitates that the majority of the effort goes into the content and the message you intend to convey. The visuals of a PowerPoint presentation can only be effective if it supplements and supports the story that is being told. Keeping this in mind our experts created Adopting Flexible Work Policy Impact Of Flexible Working On Employees Performance Ideas PDF to reduce the time that goes into designing the presentation. This way, you can concentrate on the message while our designers take care of providing you with the right template for the situation.
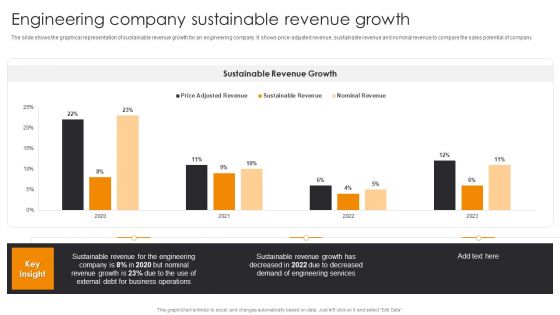
Engineering Company Sustainable Revenue Growth Engineering Company Financial Analysis Report Clipart PDF
The slide shows the graphical representation of sustainable revenue growth for an engineering company. It shows price-adjusted revenue, sustainable revenue and nominal revenue to compare the sales potential of company. Coming up with a presentation necessitates that the majority of the effort goes into the content and the message you intend to convey. The visuals of a PowerPoint presentation can only be effective if it supplements and supports the story that is being told. Keeping this in mind our experts created Engineering Company Sustainable Revenue Growth Engineering Company Financial Analysis Report Clipart PDF to reduce the time that goes into designing the presentation. This way, you can concentrate on the message while our designers take care of providing you with the right template for the situation.

Tactical Approach For Vendor Reskilling KPI Dashboard For Supplier Monitoring Slides PDF
The slide depicts the KPI dashboard for the supplier monitoring. It provides information regarding the monthly purchase value, number of contracted suppliers, scheduled and completed audits along with vendors quality performance. Coming up with a presentation necessitates that the majority of the effort goes into the content and the message you intend to convey. The visuals of a PowerPoint presentation can only be effective if it supplements and supports the story that is being told. Keeping this in mind our experts created Tactical Approach For Vendor Reskilling KPI Dashboard For Supplier Monitoring Slides PDF to reduce the time that goes into designing the presentation. This way, you can concentrate on the message while our designers take care of providing you with the right template for the situation.
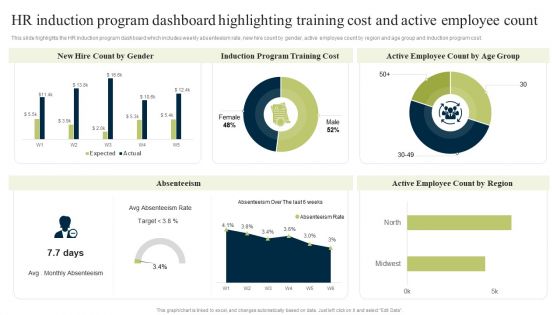
New Staff Onboarding Program HR Induction Program Dashboard Highlighting Training Cost And Active Employee Count Graphics PDF
This slide highlights the HR induction program dashboard which includes weekly absenteeism rate, new hire count by gender, active employee count by region and age group and induction program cost. Coming up with a presentation necessitates that the majority of the effort goes into the content and the message you intend to convey. The visuals of a PowerPoint presentation can only be effective if it supplements and supports the story that is being told. Keeping this in mind our experts created New Staff Onboarding Program HR Induction Program Dashboard Highlighting Training Cost And Active Employee Count Graphics PDF to reduce the time that goes into designing the presentation. This way, you can concentrate on the message while our designers take care of providing you with the right template for the situation.
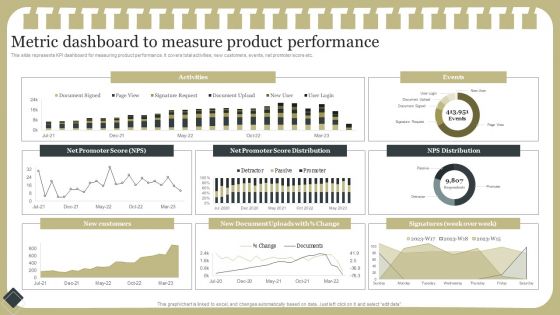
Effective Product Development Strategy Metric Dashboard To Measure Product Performance Information PDF
This slide represents KPI dashboard for measuring product performance. It covers total activities, new customers, events, net promoter score etc.Coming up with a presentation necessitates that the majority of the effort goes into the content and the message you intend to convey. The visuals of a PowerPoint presentation can only be effective if it supplements and supports the story that is being told. Keeping this in mind our experts created Effective Product Development Strategy Metric Dashboard To Measure Product Performance Information PDF to reduce the time that goes into designing the presentation. This way, you can concentrate on the message while our designers take care of providing you with the right template for the situation.
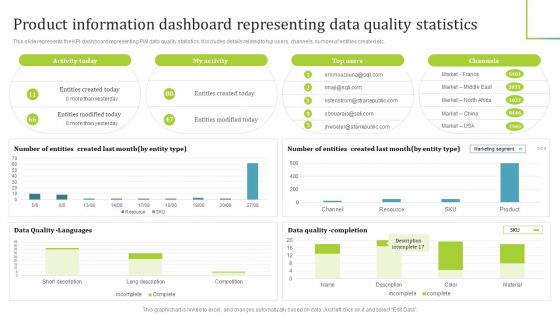
PIM Software Deployment To Enhance Conversion Rates Product Information Dashboard Representing Data Quality Statistics Download PDF
This slide represents the KPI dashboard representing PIM data quality statistics. It includes details related to top users, channels, number of entities created etc. Coming up with a presentation necessitates that the majority of the effort goes into the content and the message you intend to convey. The visuals of a PowerPoint presentation can only be effective if it supplements and supports the story that is being told. Keeping this in mind our experts created PIM Software Deployment To Enhance Conversion Rates Product Information Dashboard Representing Data Quality Statistics Download PDF to reduce the time that goes into designing the presentation. This way, you can concentrate on the message while our designers take care of providing you with the right template for the situation.
Elastic NLB Network Load Balancers Performance Tracker Dashboard Background PDF
This slide shows the dashboard for tracking the network load balancers performance by covering details of balancer status, balancer session, balancer throughput, etc. Coming up with a presentation necessitates that the majority of the effort goes into the content and the message you intend to convey. The visuals of a PowerPoint presentation can only be effective if it supplements and supports the story that is being told. Keeping this in mind our experts created Elastic NLB Network Load Balancers Performance Tracker Dashboard Background PDF to reduce the time that goes into designing the presentation. This way, you can concentrate on the message while our designers take care of providing you with the right template for the situation.
Social Networks Marketing To Improve Facebook Advertising Performance Tracking Icons PDF
This slide shows the dashboard to track and measure the performance of Facebook advertising campaign. It includes key metrics such as ad spend, cost per thousand, cost per click, click through rate etc. Coming up with a presentation necessitates that the majority of the effort goes into the content and the message you intend to convey. The visuals of a PowerPoint presentation can only be effective if it supplements and supports the story that is being told. Keeping this in mind our experts created Social Networks Marketing To Improve Facebook Advertising Performance Tracking Icons PDF to reduce the time that goes into designing the presentation. This way, you can concentrate on the message while our designers take care of providing you with the right template for the situation.

Retail Store Operations Sales Dashboards For Retail Store Structure PDF
This slide illustrates the dashboard retail store sales forecasting providing information regarding sales per employee, price unit every transaction, total number of customers and average value of customer transaction. Coming up with a presentation necessitates that the majority of the effort goes into the content and the message you intend to convey. The visuals of a PowerPoint presentation can only be effective if it supplements and supports the story that is being told. Keeping this in mind our experts created Retail Store Operations Sales Dashboards For Retail Store Structure PDF to reduce the time that goes into designing the presentation. This way, you can concentrate on the message while our designers take care of providing you with the right template for the situation.

Coca Cola Emotional Marketing Strategy Forecasting Market Share Amongst Major Brands Pictures PDF
This slide showcases projecting market share amongst major players. It provides details about compound annual growth rate CAGR, market cap, customer emotions, brand image, storytelling, product differentiation, sales volume, etc. Coming up with a presentation necessitates that the majority of the effort goes into the content and the message you intend to convey. The visuals of a PowerPoint presentation can only be effective if it supplements and supports the story that is being told. Keeping this in mind our experts created Coca Cola Emotional Marketing Strategy Forecasting Market Share Amongst Major Brands Pictures PDF to reduce the time that goes into designing the presentation. This way, you can concentrate on the message while our designers take care of providing you with the right template for the situation.
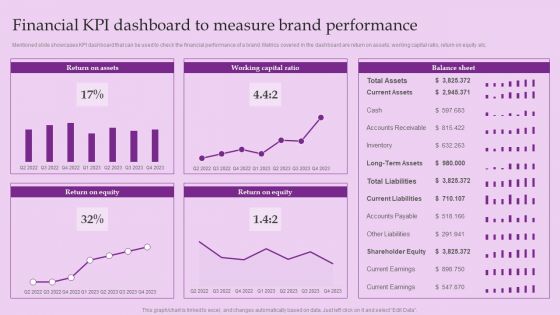
Financial KPI Dashboard To Measure Brand Performance Brand And Equity Evaluation Techniques Elements PDF
Mentioned slide showcases KPI dashboard that can be used to check the financial performance of a brand. Metrics covered in the dashboard are return on assets, working capital ratio, return on equity etc.Coming up with a presentation necessitates that the majority of the effort goes into the content and the message you intend to convey. The visuals of a PowerPoint presentation can only be effective if it supplements and supports the story that is being told. Keeping this in mind our experts created Financial KPI Dashboard To Measure Brand Performance Brand And Equity Evaluation Techniques Elements PDF to reduce the time that goes into designing the presentation. This way, you can concentrate on the message while our designers take care of providing you with the right template for the situation.

Optimizing Social Networks Social Media Campaign Performance Dashboard Guidelines PDF
This slide shows social media promotional campaign performance dashboard. It provides information about followers, reach, clicks, leads, shares, likes, comments, engagement, etc. Coming up with a presentation necessitates that the majority of the effort goes into the content and the message you intend to convey. The visuals of a PowerPoint presentation can only be effective if it supplements and supports the story that is being told. Keeping this in mind our experts created Optimizing Social Networks Social Media Campaign Performance Dashboard Guidelines PDF to reduce the time that goes into designing the presentation. This way, you can concentrate on the message while our designers take care of providing you with the right template for the situation.

Strengthening Brand Performance Metrics Dashboard To Track Overall Rebranding Themes PDF
This slide provides information regarding essential characteristics of co-branding in terms of strategic partnership, build credibility, developing marketing strategy, develop innovation and value addition, etc. Coming up with a presentation necessitates that the majority of the effort goes into the content and the message you intend to convey. The visuals of a PowerPoint presentation can only be effective if it supplements and supports the story that is being told. Keeping this in mind our experts created Strengthening Brand Performance Metrics Dashboard To Track Overall Rebranding Themes PDF to reduce the time that goes into designing the presentation. This way, you can concentrate on the message while our designers take care of providing you with the right template for the situation.
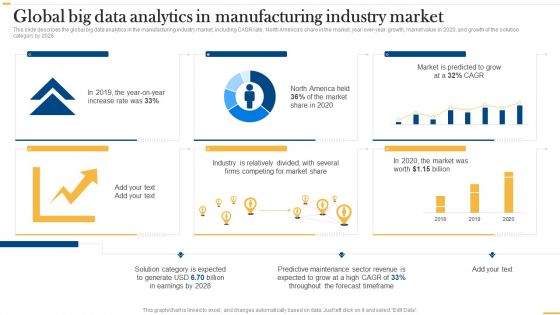
Deploying AI To Enhance Global Big Data Analytics In Manufacturing Industry Market Professional PDF
This slide describes the global big data analytics in the manufacturing industry market, including CAGR rate, North Americas share in the market, year-over-year growth, market value in 2020, and growth of the solution category by 2028. Coming up with a presentation necessitates that the majority of the effort goes into the content and the message you intend to convey. The visuals of a PowerPoint presentation can only be effective if it supplements and supports the story that is being told. Keeping this in mind our experts created Deploying AI To Enhance Global Big Data Analytics In Manufacturing Industry Market Professional PDF to reduce the time that goes into designing the presentation. This way, you can concentrate on the message while our designers take care of providing you with the right template for the situation.
Guide For Brand Why Brand Extension Is A Popular Marketing Strategy Icons PDF
Following slide illustrates the graphs that provides key statistics on why brand extension is considered as famous marketing strategy. Statistics covered are related to rate of trial, conversion rate, repeat purchase rate and brand survival rate. Coming up with a presentation necessitates that the majority of the effort goes into the content and the message you intend to convey. The visuals of a PowerPoint presentation can only be effective if it supplements and supports the story that is being told. Keeping this in mind our experts created Guide For Brand Why Brand Extension Is A Popular Marketing Strategy Icons PDF to reduce the time that goes into designing the presentation. This way, you can concentrate on the message while our designers take care of providing you with the right template for the situation.
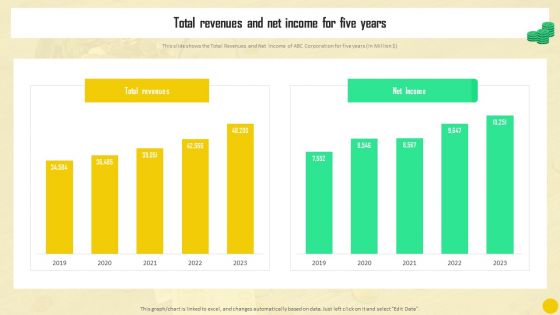
Financial Reporting To Analyze Total Revenues And Net Income For Five Years Guidelines PDF
This slide shows the Total Revenues and Net Income of ABC Corporation for five years in Million dollar Coming up with a presentation necessitates that the majority of the effort goes into the content and the message you intend to convey. The visuals of a PowerPoint presentation can only be effective if it supplements and supports the story that is being told. Keeping this in mind our experts created Financial Reporting To Analyze Total Revenues And Net Income For Five Years Guidelines PDF to reduce the time that goes into designing the presentation. This way, you can concentrate on the message while our designers take care of providing you with the right template for the situation.

Profitability Modelling Framework Enhancing Customer Profitability By Assessing Key Sample PDF
This slide provides details about how customer profitability is analyzed based upon the revenue generated, net margin, etc as they are considered as decision making factors directly affect customer profitability. Coming up with a presentation necessitates that the majority of the effort goes into the content and the message you intend to convey. The visuals of a PowerPoint presentation can only be effective if it supplements and supports the story that is being told. Keeping this in mind our experts created Profitability Modelling Framework Enhancing Customer Profitability By Assessing Key Sample PDF to reduce the time that goes into designing the presentation. This way, you can concentrate on the message while our designers take care of providing you with the right template for the situation.
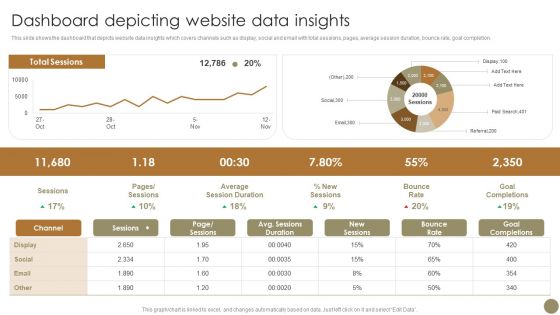
Echniques To Enhance Brand Dashboard Depicting Website Data Insights Clipart PDF
This slide shows the dashboard that depicts website data insights which covers channels such as display, social and email with total sessions, pages, average session duration, bounce rate, goal completion. Coming up with a presentation necessitates that the majority of the effort goes into the content and the message you intend to convey. The visuals of a PowerPoint presentation can only be effective if it supplements and supports the story that is being told. Keeping this in mind our experts created Echniques To Enhance Brand Dashboard Depicting Website Data Insights Clipart PDF to reduce the time that goes into designing the presentation. This way, you can concentrate on the message while our designers take care of providing you with the right template for the situation.

Boosting Product Sales Through Branding Dashboard Depicting Website Data Brochure PDF
This slide shows the dashboard that depicts website data insights which covers channels such as display, social and email with total sessions, pages, average session duration, bounce rate, goal completion. Coming up with a presentation necessitates that the majority of the effort goes into the content and the message you intend to convey. The visuals of a PowerPoint presentation can only be effective if it supplements and supports the story that is being told. Keeping this in mind our experts created Boosting Product Sales Through Branding Dashboard Depicting Website Data Brochure PDF to reduce the time that goes into designing the presentation. This way, you can concentrate on the message while our designers take care of providing you with the right template for the situation.
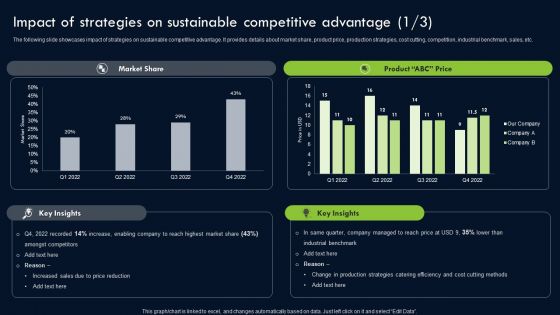
Transforming Sustainability Into Competitive Impact Of Strategies On Sustainable Slides PDF
The following slide showcases impact of strategies on sustainable competitive advantage. It provides details about market share, product price, production strategies, cost cutting, competition, industrial benchmark, sales, etc. Coming up with a presentation necessitates that the majority of the effort goes into the content and the message you intend to convey. The visuals of a PowerPoint presentation can only be effective if it supplements and supports the story that is being told. Keeping this in mind our experts created Transforming Sustainability Into Competitive Impact Of Strategies On Sustainable Slides PDF to reduce the time that goes into designing the presentation. This way, you can concentrate on the message while our designers take care of providing you with the right template for the situation.
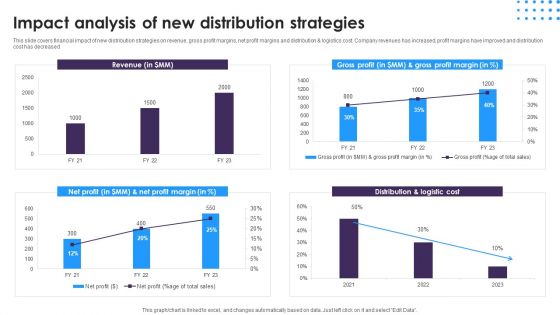
Omnichannel Distribution System To Satisfy Customer Needs Impact Analysis Of New Distribution Strategies Ideas PDF
This slide covers financial impact of new distribution strategies on revenue, gross profit margins, net profit margins and distribution and logistics cost. Company revenues has increased, profit margins have improved and distribution cost has decreased. Coming up with a presentation necessitates that the majority of the effort goes into the content and the message you intend to convey. The visuals of a PowerPoint presentation can only be effective if it supplements and supports the story that is being told. Keeping this in mind our experts created Omnichannel Distribution System To Satisfy Customer Needs Impact Analysis Of New Distribution Strategies Ideas PDF to reduce the time that goes into designing the presentation. This way, you can concentrate on the message while our designers take care of providing you with the right template for the situation.
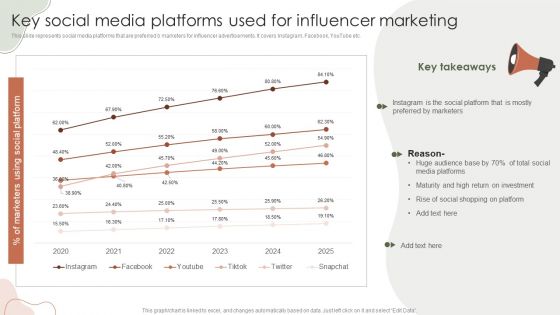
Digital Marketing Approach For Brand Awareness Key Social Media Platforms Used For Influencer Marketing Infographics PDF
This slide represents social media platforms that are preferred b marketers for influencer advertisements. It covers Instagram, Facebook, YouTube etc. Coming up with a presentation necessitates that the majority of the effort goes into the content and the message you intend to convey. The visuals of a PowerPoint presentation can only be effective if it supplements and supports the story that is being told. Keeping this in mind our experts created Digital Marketing Approach For Brand Awareness Key Social Media Platforms Used For Influencer Marketing Infographics PDF to reduce the time that goes into designing the presentation. This way, you can concentrate on the message while our designers take care of providing you with the right template for the situation.
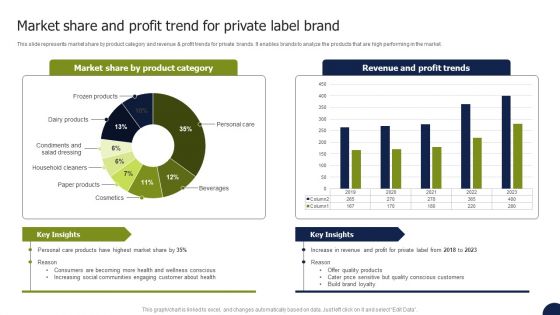
Private Labelling Strategies To Gain Market Share And Profit Trend For Private Label Brand Sample PDF
This slide represents market share by product category and revenue and profit trends for private brands. It enables brands to analyze the products that are high performing in the market. Coming up with a presentation necessitates that the majority of the effort goes into the content and the message you intend to convey. The visuals of a PowerPoint presentation can only be effective if it supplements and supports the story that is being told. Keeping this in mind our experts created Private Labelling Strategies To Gain Market Share And Profit Trend For Private Label Brand Sample PDF to reduce the time that goes into designing the presentation. This way, you can concentrate on the message while our designers take care of providing you with the right template for the situation.
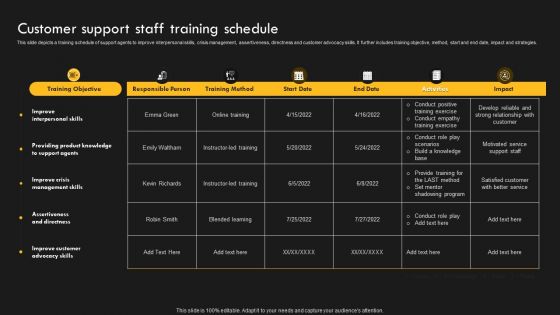
Service Improvement Techniques For Client Retention Customer Support Staff Training Schedule Clipart PDF
This slide showcases dashboard depicting major customer service KPIs. The performance metrics covered are search exit rate, CSAT, average first response time, tickets solved, etc. Coming up with a presentation necessitates that the majority of the effort goes into the content and the message you intend to convey. The visuals of a PowerPoint presentation can only be effective if it supplements and supports the story that is being told. Keeping this in mind our experts created Service Improvement Techniques For Client Retention Customer Support Staff Training Schedule Clipart PDF to reduce the time that goes into designing the presentation. This way, you can concentrate on the message while our designers take care of providing you with the right template for the situation.

Company Rules And Regulations Manual Target And Incentive Policy In The Company Download PDF
This slide highlights the policy to determine employee target and incentive which includes incentive form, pay levels, salary fixed vs variable, pay levels, payout frequency and performance measures. Coming up with a presentation necessitates that the majority of the effort goes into the content and the message you intend to convey. The visuals of a PowerPoint presentation can only be effective if it supplements and supports the story that is being told. Keeping this in mind our experts created Company Rules And Regulations Manual Target And Incentive Policy In The Company Download PDF to reduce the time that goes into designing the presentation. This way, you can concentrate on the message while our designers take care of providing you with the right template for the situation.
Staff Performance Evaluation Process Providing Employee Performance Ratings Contd Icons PDF
This slide shows the employee performance rating sheet in which reviewer give rating to each employee competency on the basis of their past performance. Coming up with a presentation necessitates that the majority of the effort goes into the content and the message you intend to convey. The visuals of a PowerPoint presentation can only be effective if it supplements and supports the story that is being told. Keeping this in mind our experts created Staff Performance Evaluation Process Providing Employee Performance Ratings Contd Icons PDF to reduce the time that goes into designing the presentation. This way, you can concentrate on the message while our designers take care of providing you with the right template for the situation.

Intelligent Manufacturing Global Spending On Industrial Internet Of Things Technologies Infographics PDF
This slide depicts the global spending on the industrial internet of things technologies from 2019 to 2027. The market is segmented as IoT security, IoT hardware, IoT services, IoT software and total. Coming up with a presentation necessitates that the majority of the effort goes into the content and the message you intend to convey. The visuals of a PowerPoint presentation can only be effective if it supplements and supports the story that is being told. Keeping this in mind our experts created Intelligent Manufacturing Global Spending On Industrial Internet Of Things Technologies Infographics PDF to reduce the time that goes into designing the presentation. This way, you can concentrate on the message while our designers take care of providing you with the right template for the situation.
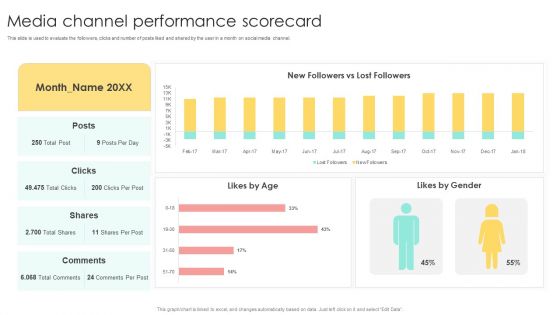
Media Advertising Media Channel Performance Scorecard Clipart PDF
This slide is used to evaluate the followers, clicks and number of posts liked and shared by the user in a month on social media channel. Coming up with a presentation necessitates that the majority of the effort goes into the content and the message you intend to convey. The visuals of a PowerPoint presentation can only be effective if it supplements and supports the story that is being told. Keeping this in mind our experts created Media Advertising Media Channel Performance Scorecard Clipart PDF to reduce the time that goes into designing the presentation. This way, you can concentrate on the message while our designers take care of providing you with the right template for the situation.
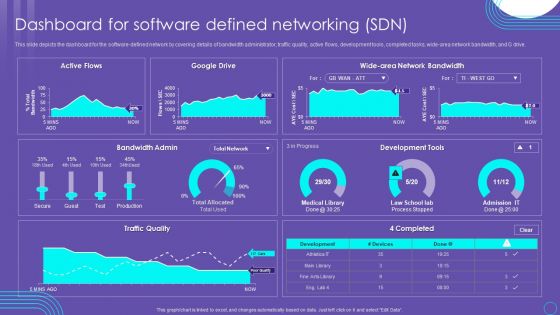
SDN Security Architecture Dashboard For Software Defined Networking SDN Mockup PDF
This slide depicts the dashboard for the software defined network by covering details of bandwidth administrator, traffic quality, active flows, development tools, completed tasks, wide area network bandwidth, and G drive. Coming up with a presentation necessitates that the majority of the effort goes into the content and the message you intend to convey. The visuals of a PowerPoint presentation can only be effective if it supplements and supports the story that is being told. Keeping this in mind our experts created SDN Security Architecture Dashboard For Software Defined Networking SDN Mockup PDF to reduce the time that goes into designing the presentation. This way, you can concentrate on the message while our designers take care of providing you with the right template for the situation.
Company Profile For Online Video Service Provider Subscribers Growth Journey Icons PDF
The following slide highlights the graphical representation of Disney plus growth journey. It depicts number of subscriber in millions, OTT platform launch year and launch of services in different countries. Coming up with a presentation necessitates that the majority of the effort goes into the content and the message you intend to convey. The visuals of a PowerPoint presentation can only be effective if it supplements and supports the story that is being told. Keeping this in mind our experts created Company Profile For Online Video Service Provider Subscribers Growth Journey Icons PDF to reduce the time that goes into designing the presentation. This way, you can concentrate on the message while our designers take care of providing you with the right template for the situation.

Tech Solution Company Elevator Pitch Deck Financial Projections Guidelines PDF
This slide caters to the details related to the forecast of companies future. It highlights revenue, cost of goods sold, net profit, operating profit, and CAGR Compound annual growth rate recorded which indicates positive performance and future growth potential. Coming up with a presentation necessitates that the majority of the effort goes into the content and the message you intend to convey. The visuals of a PowerPoint presentation can only be effective if it supplements and supports the story that is being told. Keeping this in mind our experts created Tech Solution Company Elevator Pitch Deck Financial Projections Guidelines PDF to reduce the time that goes into designing the presentation. This way, you can concentrate on the message while our designers take care of providing you with the right template for the situation.

Strategies For Successful Customer Base Development In B2b M Commerce Share Of B2b Buyers Purchase From Social Media Clipart PDF
This slide represents share of b2b buyers making purchase due to social media and metaverse. It covers social media ads, live demonstration, video posts etc. Coming up with a presentation necessitates that the majority of the effort goes into the content and the message you intend to convey. The visuals of a PowerPoint presentation can only be effective if it supplements and supports the story that is being told. Keeping this in mind our experts created Strategies For Successful Customer Base Development In B2b M Commerce Share Of B2b Buyers Purchase From Social Media Clipart PDF to reduce the time that goes into designing the presentation. This way, you can concentrate on the message while our designers take care of providing you with the right template for the situation.

Corporate Training Program Forecasted Increase In Company Annual Production In Next 5 Years Themes PDF
The following slide showcases the expected increase in company annual production rate in coming 5 years due to factors like increased productivity and efficiency of company employees after training program. Coming up with a presentation necessitates that the majority of the effort goes into the content and the message you intend to convey. The visuals of a PowerPoint presentation can only be effective if it supplements and supports the story that is being told. Keeping this in mind our experts created Corporate Training Program Employee Satisfaction Level After Training Program Slides PDF to reduce the time that goes into designing the presentation. This way, you can concentrate on the message while our designers take care of providing you with the right template for the situation.

Training Feedback Dashboard To Enhance Program Effectiveness Themes PDF
This slide covers KPI dashboard to assess training effectiveness. It involves details such as net promoter score, training satisfaction rate, engagement score and drop out rate. Coming up with a presentation necessitates that the majority of the effort goes into the content and the message you intend to convey. The visuals of a PowerPoint presentation can only be effective if it supplements and supports the story that is being told. Keeping this in mind our experts created Training Feedback Dashboard To Enhance Program Effectiveness Themes PDF to reduce the time that goes into designing the presentation. This way, you can concentrate on the message while our designers take care of providing you with the right template for the situation.

Developing A Strategic Private Label Branding Approach Penetration Of Online Private Labels Based Product Sample PDF
This slide represents digital private label penetration in market in different product categories based on various factors. It covers factors such as price, accessibility, assortment and returns and reviews. Coming up with a presentation necessitates that the majority of the effort goes into the content and the message you intend to convey. The visuals of a PowerPoint presentation can only be effective if it supplements and supports the story that is being told. Keeping this in mind our experts created Developing A Strategic Private Label Branding Approach Penetration Of Online Private Labels Based Product Sample PDF to reduce the time that goes into designing the presentation. This way, you can concentrate on the message while our designers take care of providing you with the right template for the situation.

Online Store Investment Pitch Deck Key Facts Elements PDF
This slide caters to details about the explosive growth opportunities of the Company and its ability to emerge as a popular e commerce platform. Coming up with a presentation necessitates that the majority of the effort goes into the content and the message you intend to convey. The visuals of a PowerPoint presentation can only be effective if it supplements and supports the story that is being told. Keeping this in mind our experts created Online Store Investment Pitch Deck Key Facts Elements PDF to reduce the time that goes into designing the presentation. This way, you can concentrate on the message while our designers take care of providing you with the right template for the situation.

Over The Top Platform Company Profile Paid Subscriber Base Download PDF
The following slide highlights the number of paid subscribers of Disney streaming services. It shows increase in the subscribers numbers in domestic and international market. Coming up with a presentation necessitates that the majority of the effort goes into the content and the message you intend to convey. The visuals of a PowerPoint presentation can only be effective if it supplements and supports the story that is being told. Keeping this in mind our experts created Over The Top Platform Company Profile Paid Subscriber Base Download PDF to reduce the time that goes into designing the presentation. This way, you can concentrate on the message while our designers take care of providing you with the right template for the situation.
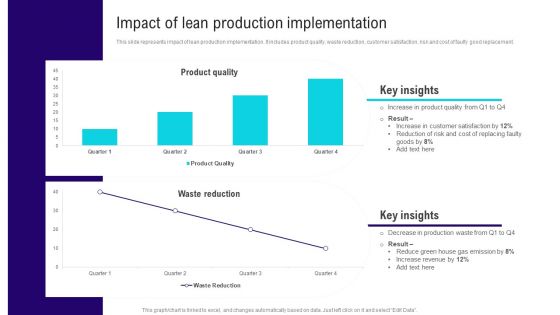
Implementing Lean Production Tool And Techniques Impact Of Lean Production Implementation Background PDF
This slide represents impact of lean production implementation. It includes product quality, waste reduction, customer satisfaction, risk and cost of faulty good replacement. Coming up with a presentation necessitates that the majority of the effort goes into the content and the message you intend to convey. The visuals of a PowerPoint presentation can only be effective if it supplements and supports the story that is being told. Keeping this in mind our experts created Implementing Lean Production Tool And Techniques Impact Of Lean Production Implementation Background PDF to reduce the time that goes into designing the presentation. This way, you can concentrate on the message while our designers take care of providing you with the right template for the situation.
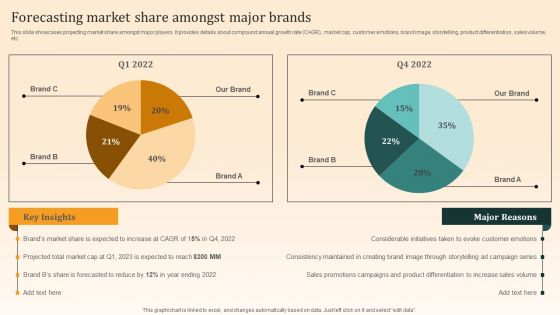
Nike Emotional Branding Strategy Forecasting Market Share Amongst Major Brands Microsoft PDF
This slide showcases projecting market share amongst major players. It provides details about compound annual growth rate CAGR, market cap, customer emotions, brand image, storytelling, product differentiation, sales volume, etc. Coming up with a presentation necessitates that the majority of the effort goes into the content and the message you intend to convey. The visuals of a PowerPoint presentation can only be effective if it supplements and supports the story that is being told. Keeping this in mind our experts created Nike Emotional Branding Strategy Forecasting Market Share Amongst Major Brands Microsoft PDF to reduce the time that goes into designing the presentation. This way, you can concentrate on the message while our designers take care of providing you with the right template for the situation.

Employee Retention And Turnover Rates Monitoring Dashboard Professional PDF
This slide showcases a dashboard to supervise and monitor employee retention and turnover score. It includes key components such as active employees, hires, exits, retention rate, turnover rate, etc. Coming up with a presentation necessitates that the majority of the effort goes into the content and the message you intend to convey. The visuals of a PowerPoint presentation can only be effective if it supplements and supports the story that is being told. Keeping this in mind our experts created Employee Retention And Turnover Rates Monitoring Dashboard Professional PDF to reduce the time that goes into designing the presentation. This way, you can concentrate on the message while our designers take care of providing you with the right template for the situation.

Reinforcement Learning Principles And Techniques Performance Tracking Dashboard Reinforcement Learning Mockup PDF
This slide represents the performance tracking dashboard for the reinforcement learning model based on different time frames and categories. Coming up with a presentation necessitates that the majority of the effort goes into the content and the message you intend to convey. The visuals of a PowerPoint presentation can only be effective if it supplements and supports the story that is being told. Keeping this in mind our experts created Reinforcement Learning Principles And Techniques Performance Tracking Dashboard Reinforcement Learning Mockup PDF to reduce the time that goes into designing the presentation. This way, you can concentrate on the message while our designers take care of providing you with the right template for the situation.
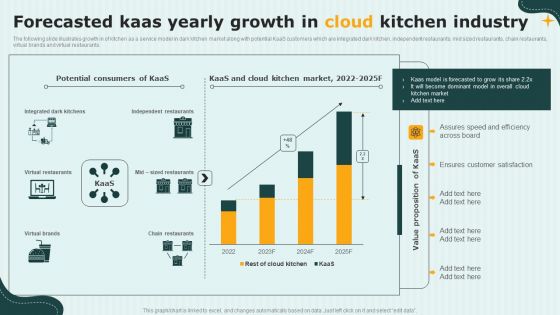
International Cloud Kitchen Industry Analysis Forecasted Kaas Yearly Growth In Cloud Kitchen Industry Slides PDF
The following slide illustrates growth in of kitchen as a service model in dark kitchen market along with potential KaaS customers which are integrated dark kitchen, independent restaurants, mid sized restaurants, chain restaurants, virtual brands and virtual restaurants. Coming up with a presentation necessitates that the majority of the effort goes into the content and the message you intend to convey. The visuals of a PowerPoint presentation can only be effective if it supplements and supports the story that is being told. Keeping this in mind our experts created International Cloud Kitchen Industry Analysis Forecasted Kaas Yearly Growth In Cloud Kitchen Industry Slides PDF to reduce the time that goes into designing the presentation. This way, you can concentrate on the message while our designers take care of providing you with the right template for the situation.
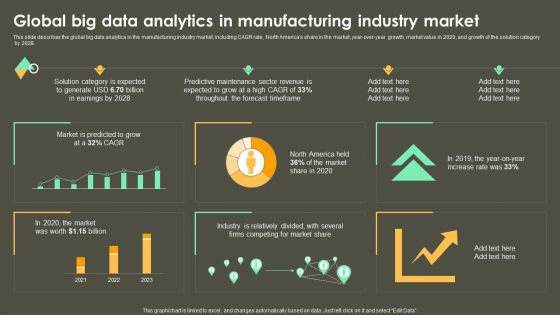
Iot Integration In Manufacturing Global Big Data Analytics In Manufacturing Industry Market Infographics PDF
This slide describes the global big data analytics in the manufacturing industry market, including CAGR rate, North Americas share in the market, year-over-year growth, market value in 2020, and growth of the solution category by 2028. Coming up with a presentation necessitates that the majority of the effort goes into the content and the message you intend to convey. The visuals of a PowerPoint presentation can only be effective if it supplements and supports the story that is being told. Keeping this in mind our experts created Iot Integration In Manufacturing Global Big Data Analytics In Manufacturing Industry Market Infographics PDF to reduce the time that goes into designing the presentation. This way, you can concentrate on the message while our designers take care of providing you with the right template for the situation.

Regenerative Artificial Intelligence Systems Impact Of Chatgpt On Artificial Intelligence Tokens Diagrams PDF
This slide depicts the change in the prices of five artificial intelligence tokens after the launch of OpenAIs ChatGPT model. These artificial intelligence tokens are DeepBrain Chain, Numeraire, Fetch.ai, SingularityNET, and Alethea Artificial Liquid Intelligence. Coming up with a presentation necessitates that the majority of the effort goes into the content and the message you intend to convey. The visuals of a PowerPoint presentation can only be effective if it supplements and supports the story that is being told. Keeping this in mind our experts created Regenerative Artificial Intelligence Systems Impact Of Chatgpt On Artificial Intelligence Tokens Diagrams PDF to reduce the time that goes into designing the presentation. This way, you can concentrate on the message while our designers take care of providing you with the right template for the situation.
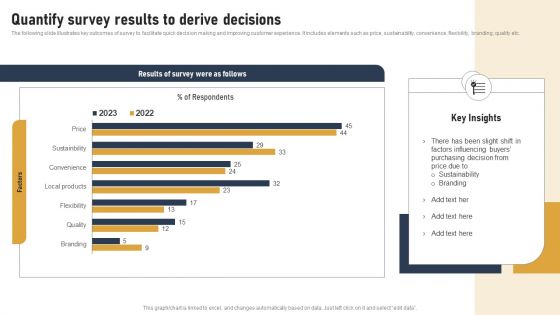
Incorporating Real Time Marketing For Improved Consumer Quantify Survey Results To Derive Decisions Information PDF
The following slide illustrates key outcomes of survey to facilitate quick decision making and improving customer experience. It includes elements such as price, sustainability, convenience, flexibility, branding, quality etc. Coming up with a presentation necessitates that the majority of the effort goes into the content and the message you intend to convey. The visuals of a PowerPoint presentation can only be effective if it supplements and supports the story that is being told. Keeping this in mind our experts created Incorporating Real Time Marketing For Improved Consumer Quantify Survey Results To Derive Decisions Information PDF to reduce the time that goes into designing the presentation. This way, you can concentrate on the message while our designers take care of providing you with the right template for the situation.

Historical Timeline Details Of The Company One Pager Documents
This page covers details regarding the history details of the company such as companys establishment, handsets operations, etc. Presenting you an exemplary Historical Timeline Details Of The Company One Pager Documents. Our one-pager comprises all the must-have essentials of an inclusive document. You can edit it with ease, as its layout is completely editable. With such freedom, you can tweak its design and other elements to your requirements. Download this Historical Timeline Details Of The Company One Pager Documents brilliant piece now.
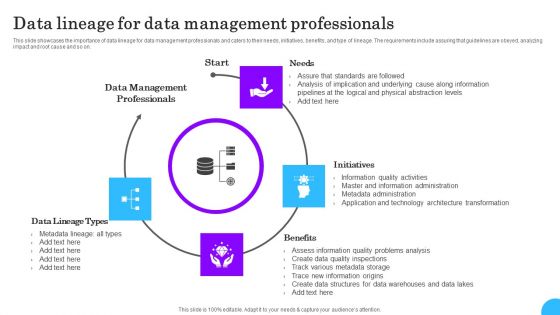
Comprehensive Analysis Of Different Data Lineage Classification Data Lineage For Data Management Download PDF
This slide showcases the importance of data lineage for data management professionals and caters to their needs, initiatives, benefits, and type of lineage. The requirements include assuring that guidelines are obeyed, analyzing impact and root cause and so on. Crafting an eye-catching presentation has never been more straightforward. Let your presentation shine with this tasteful yet straightforward Comprehensive Analysis Of Different Data Lineage Classification Data Lineage For Data Management Download PDF template. It offers a minimalistic and classy look that is great for making a statement. The colors have been employed intelligently to add a bit of playfulness while still remaining professional. Construct the ideal Comprehensive Analysis Of Different Data Lineage Classification Data Lineage For Data Management Download PDF that effortlessly grabs the attention of your audience Begin now and be certain to wow your customers
Community Engagement Platform Fundraising Pitch Deck Competitor Analysis Icons PDF
Following slide demonstrates comparative assessment between alumni management platforms, it includes key features such as description, founded year, founder, location, company type, and company stage. Do you have to make sure that everyone on your team knows about any specific topic I yes, then you should give Community Engagement Platform Fundraising Pitch Deck Competitor Analysis Icons PDF a try. Our experts have put a lot of knowledge and effort into creating this impeccable Community Engagement Platform Fundraising Pitch Deck Competitor Analysis Icons PDF. You can use this template for your upcoming presentations, as the slides are perfect to represent even the tiniest detail. You can download these templates from the Slidegeeks website and these are easy to edit. So grab these today.
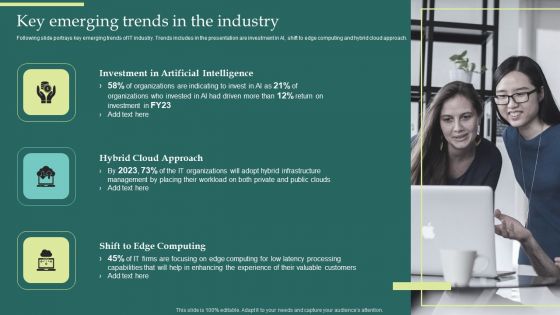
Product Portfolios And Strategic Key Emerging Trends In The Industry Themes PDF
Following slide portrays key emerging trends of IT industry. Trends includes in the presentation are investment in AI, shift to edge computing and hybrid cloud approach. Coming up with a presentation necessitates that the majority of the effort goes into the content and the message you intend to convey. The visuals of a PowerPoint presentation can only be effective if it supplements and supports the story that is being told. Keeping this in mind our experts created Product Portfolios And Strategic Key Emerging Trends In The Industry Themes PDF to reduce the time that goes into designing the presentation. This way, you can concentrate on the message while our designers take care of providing you with the right template for the situation.

Diverging Six Factors Sequential Flow Target Process PowerPoint Slides
We present our diverging six factors sequential flow Target Process PowerPoint Slides.Use our Advertising PowerPoint Templates because this unique template give you an enthusiastic response and a purposeful Aye- Aye Sir. Download our Business PowerPoint Templates because it will demonstrate the strength of character under severe stress. Shine the torch ahead and bring the light to shine on all. Present our Arrows PowerPoint Templates because you understand the illness and its causes. Use our Circle Charts PowerPoint Templates because this PPt Enlighten others on your team with your views. Download our Shapes PowerPoint Templates because the mind is always whirring with new ideas.Use these PowerPoint slides for presentations relating to 3d, abstract, abstraction, arrow, background, black, blue, bottom, clip-art, collection color, computer, cool, curve, design, direct, direction, down, glass, graphic, green horizontal, icon, illustration, index, information, isolated, left, modern, navigation, next object, perspective, pink, pointer, pointing, red, right, round, set, show, sign, simple specify, style, symbol, turn, up, way. The prominent colors used in the PowerPoint template are Blue, Gray, White. Presenters tell us our diverging six factors sequential flow Target Process PowerPoint Slides are Pleasant. Presenters tell us our black PowerPoint templates and PPT Slides are Magnificent. PowerPoint presentation experts tell us our diverging six factors sequential flow Target Process PowerPoint Slides are Handsome. We assure you our background PowerPoint templates and PPT Slides are Chic. Customers tell us our diverging six factors sequential flow Target Process PowerPoint Slides are Fashionable. People tell us our abstraction PowerPoint templates and PPT Slides look good visually.

Strategic Brand Playbook Sample People Imagery Brand Strategy Playbook Background PDF
This template covers sample people photos selection guidelines for brand playbook. It also covers the description of the images along with download resolution. Coming up with a presentation necessitates that the majority of the effort goes into the content and the message you intend to convey. The visuals of a PowerPoint presentation can only be effective if it supplements and supports the story that is being told. Keeping this in mind our experts created Strategic Brand Playbook Sample People Imagery Brand Strategy Playbook Background PDF to reduce the time that goes into designing the presentation. This way, you can concentrate on the message while our designers take care of providing you with the right template for the situation.

Diverging Six Factors Sequential Flow Circular Arrow Process PowerPoint Slides
We present our diverging six factors sequential flow Circular Arrow Process PowerPoint Slides.Download our Advertising PowerPoint Templates because you have the ideas and plans on how to achieve success. Download and present our Business PowerPoint Templates because you are ready to flap your wings and launch off. All poised are you to touch the sky with glory. Download and present our Arrows PowerPoint Templates because you will be able to Highlight these individual targets and the paths to their achievement. Download and present our Circle Charts PowerPoint Templates because watching them will strengthen your companys sinews. Download our Shapes PowerPoint Templates because if making a mark is your obsession, then let others get Obsessed with you.Use these PowerPoint slides for presentations relating to 3d, abstract, abstraction, arrow, background, black, blue, bottom, clip-art, collection color, computer, cool, curve, design, direct, direction, down, glass, graphic, green horizontal, icon, illustration, index, information, isolated, left, modern, navigation, next object, perspective, pink, pointer, pointing, red, right, round, set, show, sign, simple specify, style, symbol, turn, up, way. The prominent colors used in the PowerPoint template are Purple, Gray, White. Presenters tell us our diverging six factors sequential flow Circular Arrow Process PowerPoint Slides are Majestic. Presenters tell us our background PowerPoint templates and PPT Slides are Lush. PowerPoint presentation experts tell us our diverging six factors sequential flow Circular Arrow Process PowerPoint Slides are Nostalgic. We assure you our bottom PowerPoint templates and PPT Slides are Magnificent. Customers tell us our diverging six factors sequential flow Circular Arrow Process PowerPoint Slides are Adorable. People tell us our clip-art PowerPoint templates and PPT Slides are Fabulous.
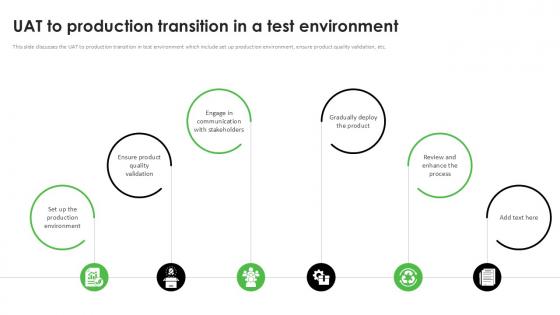
UAT To Production Transition In A Test Environment Acceptance Testing PPT Example
This slide discusses the UAT to production transition in test environment which include set up production environment, ensure product quality validation, etc. Do you know about Slidesgeeks UAT To Production Transition In A Test Environment Acceptance Testing PPT Example These are perfect for delivering any kind od presentation. Using it, create PowerPoint presentations that communicate your ideas and engage audiences. Save time and effort by using our pre designed presentation templates that are perfect for a wide range of topic. Our vast selection of designs covers a range of styles, from creative to business, and are all highly customizable and easy to edit. Download as a PowerPoint template or use them as Google Slides themes.

Instagram Marketing Campaign For Comprehensive Guide To Wholesale Ppt Sample
This slide highlights Instagram marketing campaign run by B2b business which helps in improving brand awareness and drive more sales. It provides information regarding marketing objectives, campaign types, strategy, start date, responsibility and progress status. This Instagram Marketing Campaign For Comprehensive Guide To Wholesale Ppt Sample from Slidegeeks makes it easy to present information on your topic with precision. It provides customization options, so you can make changes to the colors, design, graphics, or any other component to create a unique layout. It is also available for immediate download, so you can begin using it right away. Slidegeeks has done good research to ensure that you have everything you need to make your presentation stand out. Make a name out there for a brilliant performance.
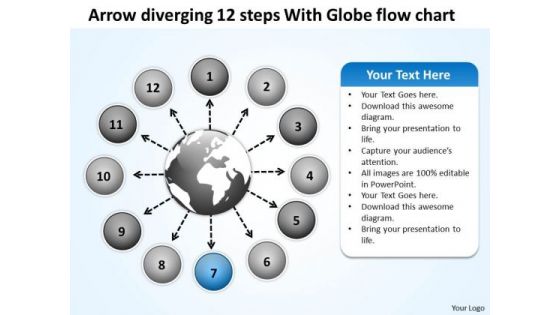
Arrow Diverging 12 Steps With Globe Flow Chart Circular PowerPoint Slides
We present our arrow diverging 12 steps with globe flow chart Circular PowerPoint Slides.Use our Circle Charts PowerPoint Templates because this diagram put it all together to form the complete picture and reach the goal. Use our Arrows PowerPoint Templates because the chart is designed to give you the flavour of the kind of tools you may need and the work that is performed in the lifecycle. Present our Globe PowerPoint Templates because you require care and diligence to function well. Use our Business PowerPoint Templates because this is the unerring accuracy in reaching the target. the effortless ability to launch into flight. Use our Flow Charts PowerPoint Templates because your marketing strategies can funnel down to the cone, stage by stage, refining as you go along.Use these PowerPoint slides for presentations relating to 3d, abstract, aim, arrow, background, business, career, chart, circle, color, concept, creative, curve, design, development, direction, financial, flowing, gain, graph, green, group, growth, higher, illustration, increase, isolated, motion, moving, moving up, path, prediction, progress, red, series, shape, sign, success, symbol, target, turn, twisted, up, upload, upward, way, white, win. The prominent colors used in the PowerPoint template are Blue, Gray, White. PowerPoint presentation experts tell us our arrow diverging 12 steps with globe flow chart Circular PowerPoint Slides are Energetic. PowerPoint presentation experts tell us our career PowerPoint templates and PPT Slides are Delightful. Presenters tell us our arrow diverging 12 steps with globe flow chart Circular PowerPoint Slides have awesome images to get your point across. Presenters tell us our background PowerPoint templates and PPT Slides are Clever. You can be sure our arrow diverging 12 steps with globe flow chart Circular PowerPoint Slides are Enchanting. We assure you our chart PowerPoint templates and PPT Slides are Bold.

 Home
Home