Spiral Diagram
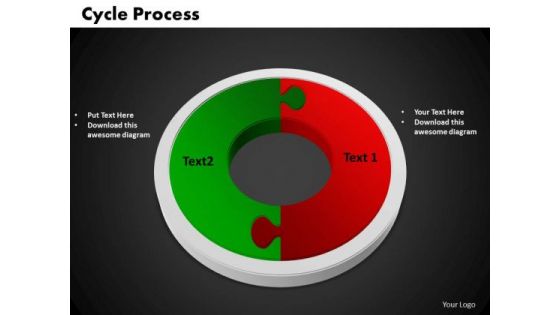
PowerPoint Presentation Cycle Process Chart Ppt Themes
PowerPoint Presentation Cycle Process Chart PPT Themes-Cycle Diagrams are a type of graphics that shows how items are related to one another in a repeating cycle. In a cycle diagram, you can explain the main events in the cycle, how they interact, and how the cycle repeats.-PowerPoint Presentation Cycle Process Chart PPT Themes-Background, Business, Chart, Circle, Circular, Marketing, Management, Flow, Graph, Process, Round, Segmented, Sequence, Wheel, Diagram, Division, Continuity, Template, Web, Illustration
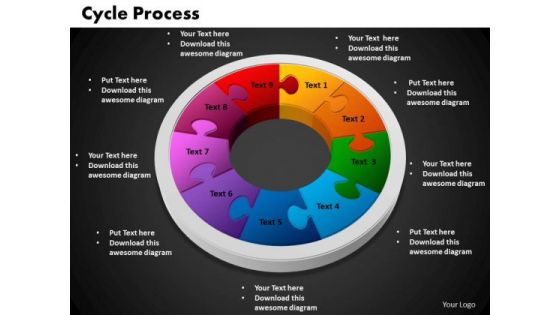
PowerPoint Template Cycle Process Chart Ppt Themes
PowerPoint Template Cycle Process Chart PPT Themes-Cycle Diagrams are a type of graphics that shows how items are related to one another in a repeating cycle. In a cycle diagram, you can explain the main events in the cycle, how they interact, and how the cycle repeats.-PowerPoint Template Cycle Process Chart PPT Themes-Background, Business, Chart, Circle, Circular, Marketing, Management, Flow, Graph, Process, Round, Segmented, Sequence, Wheel, Diagram, Division, Continuity, Template, Web, Illustration

Ppt 3d Circumference Of A Circle PowerPoint Presentation Shaped Text Arrow Templates
PPT 3d circumference of a circle powerpoint presentation shaped text arrow Templates-This diagram consists of Four colorful Interconnected elements which can be useful to present an organized view of business services and processes. You can apply other 3D Styles and shapes to the slide to enhance your presentations. -PPT 3d circumference of a circle powerpoint presentation shaped text arrow Templates-3d, advertisement, advertising, air, arrow, blank, bus, car, collection, content, design, element, flyer, gas, icon, illustration, information, isolated, label, light, location, locator, map, mark, marker, marketing, needle, new, place, plane, point, pointer, promotion, promotional, rounded, set, shadow, sign, station, symbol, tag, text, tip, traffic, train, transport, urgent, vector

PowerPoint Template Chart Cycle Process Ppt Theme
PowerPoint Template Chart Cycle Process PPT Theme-Cycle Diagrams are a type of graphics that shows how items are related to one another in a repeating cycle. In a cycle diagram, you can explain the main events in the cycle, how they interact, and how the cycle repeats. These Diagrams can be used to interact visually and logically with audiences. -PowerPoint Template Chart Cycle Process PPT Theme
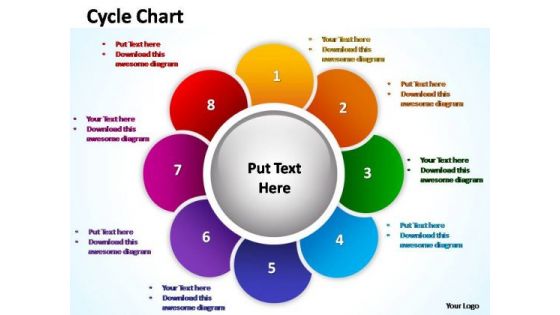
PowerPoint Theme Leadership Cycle Chart Ppt Layout
PowerPoint Theme Leadership Cycle Chart PPT Layout-Cycle Diagrams are a type of graphics that shows how items are related to one another in a repeating cycle. In a cycle diagram, you can explain the main events in the cycle, how they interact, and how the cycle repeats. These Diagrams can be used to interact visually and logically with audiences. -PowerPoint Theme Leadership Cycle Chart PPT Layout

PowerPoint Theme Marketing Cycle Chart Ppt Templates
PowerPoint Theme Marketing Cycle Chart PPT Templates-Cycle Diagrams are a type of graphics that shows how items are related to one another in a repeating cycle. In a cycle diagram, you can explain the main events in the cycle, how they interact, and how the cycle repeats. These Diagrams can be used to interact visually and logically with audiences. -PowerPoint Theme Marketing Cycle Chart PPT Templates
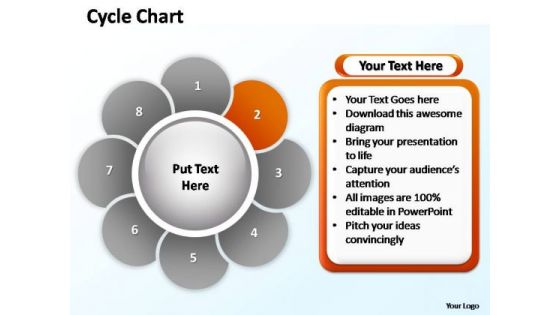
PowerPoint Themes Marketing Cycle Chart Ppt Designs
PowerPoint Themes Marketing Cycle Chart PPT Designs-Cycle Diagrams are a type of graphics that shows how items are related to one another in a repeating cycle. In a cycle diagram, you can explain the main events in the cycle, how they interact, and how the cycle repeats. These Diagrams can be used to interact visually and logically with audiences. -PowerPoint Themes Marketing Cycle Chart PPT Designs
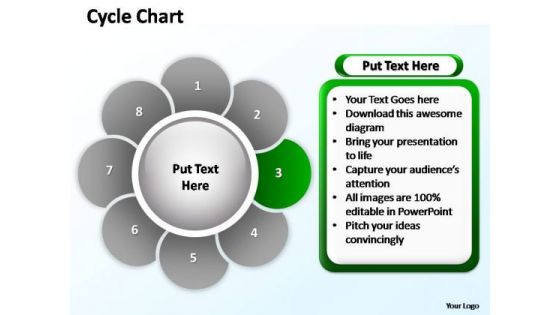
PowerPoint Themes Teamwork Cycle Chart Ppt Template
PowerPoint Themes Teamwork Cycle Chart PPT Template-Cycle Diagrams are a type of graphics that shows how items are related to one another in a repeating cycle. In a cycle diagram, you can explain the main events in the cycle, how they interact, and how the cycle repeats. These Diagrams can be used to interact visually and logically with audiences. -PowerPoint Themes Teamwork Cycle Chart PPT Template

PowerPoint Theme Editable Cycle Chart Ppt Backgrounds
PowerPoint Theme Editable Cycle Chart PPT Backgrounds-Cycle Diagrams are a type of graphics that shows how items are related to one another in a repeating cycle. In a cycle diagram, you can explain the main events in the cycle, how they interact, and how the cycle repeats. These Diagrams can be used to interact visually and logically with audiences. -PowerPoint Theme Editable Cycle Chart PPT Backgrounds

PowerPoint Backgrounds Chart Cycle Process Ppt Themes
PowerPoint Backgrounds Chart Cycle Process PPT Themes-Cycle Diagrams are a type of graphics that shows how items are related to one another in a repeating cycle. In a cycle diagram, you can explain the main events in the cycle, how they interact, and how the cycle repeats. These Diagrams can be used to interact visually and logically with audiences.-PowerPoint Backgrounds Chart Cycle Process PPT Themes
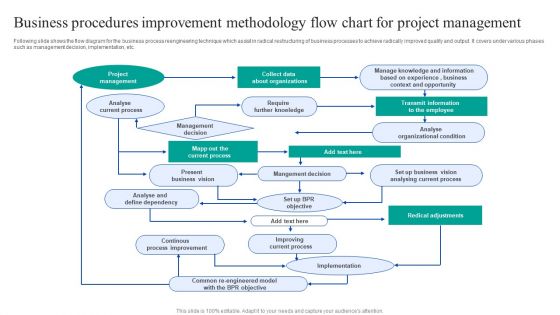
Business Procedures Improvement Methodology Flow Chart For Project Management Ideas PDF
Following slide shows the flow diagram for the business process reengineering technique which assist in radical restructuring of business processes to achieve radically improved quality and output. It covers under various phases such as management decision, implementation, etc. Persuade your audience using this Business Procedures Improvement Methodology Flow Chart For Project Management Ideas PDF. This PPT design covers one stages, thus making it a great tool to use. It also caters to a variety of topics including Project Management, Collect Data Organizations, Redical Adjustments. Download this PPT design now to present a convincing pitch that not only emphasizes the topic but also showcases your presentation skills.
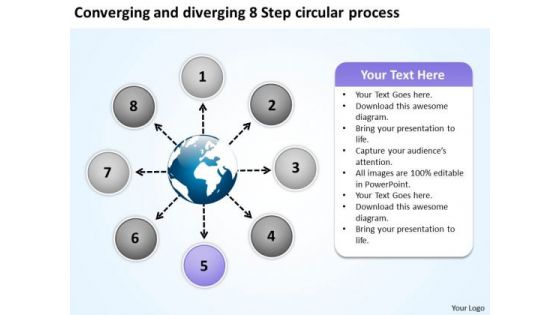
And Diverging 8 Step Circular Process Flow Chart PowerPoint Templates
We present our and diverging 8 step circular process Flow Chart PowerPoint templates.Use our Process and flows PowerPoint Templates because this diagram helps you to explain your strategy to co-ordinate activities of these seperate groups. Download our Flow charts PowerPoint Templates because you have some hits, you had some misses. Download our Arrows PowerPoint Templates because they have always been a source of inspiration for us all. Download our Circle charts PowerPoint Templates because you have the process in your head, our template design showing will illuminate your thoughts. Download our Ring charts PowerPoint Templates because this diagram helps to reaffirm to your team your faith in maintaining the highest ethical standards.Use these PowerPoint slides for presentations relating to Around, arrow, business, chart, circle, circular, circulation, commerce, concept, curving, cycle, diagram, direction, e-commerce, element, finance, financial, flow, flowchart, flowing, global, globe, internet, investment, market, motion, movement, moving, presentation, process, recession, recycle, repeat, repetitive, ring, rotation, round, savings, shape, step, structure, symbol, teamwork. The prominent colors used in the PowerPoint template are Blue, White, Green. You can be sure our and diverging 8 step circular process Flow Chart PowerPoint templates are Ritzy. Presenters tell us our business PowerPoint templates and PPT Slides will help them to explain complicated concepts. We assure you our and diverging 8 step circular process Flow Chart PowerPoint templates are Efficacious. Customers tell us our business PowerPoint templates and PPT Slides are aesthetically designed to attract attention. We guarantee that they will grab all the eyeballs you need. Presenters tell us our and diverging 8 step circular process Flow Chart PowerPoint templates will make the presenter look like a pro even if they are not computer savvy. You can be sure our circulation PowerPoint templates and PPT Slides are Swanky.
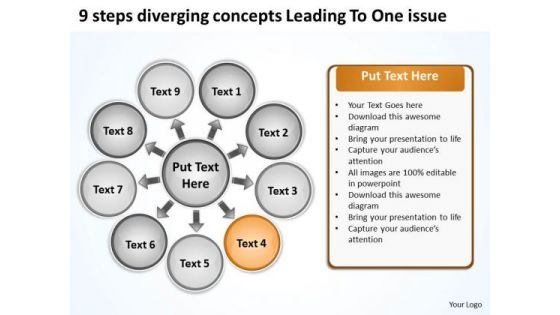
9 Steps Diverging Concepts Leading To One Issue Arrows Chart Software PowerPoint Slides
We present our 9 steps diverging concepts leading to one issue Arrows Chart Software PowerPoint Slides.Use our Circle charts PowerPoint Templates because you can asked to strive to give true form to your great dream. Use our Shapes PowerPoint Templates because the graphic is a symbol of growth and success. Present our Ring charts PowerPoint Templates because this diagram helps to reaffirm to your team your faith in maintaining the highest ethical standards. Present our Process and Flows PowerPoint Templates because you will be able to Highlight these individual targets and the paths to their achievement. Download and present our Signs PowerPoint Templates because this diagram helps in examine each brilliant thought in thorough detail highlighting all the pros and cons as minutely as possible.Use these PowerPoint slides for presentations relating to Business, chart, circle, colors, concept, corporate, cycle, data, design, detail, development, diagram, engineering, graphic, ideas, illustration, image, implement, implementation, life, lifecycle, management, model, objects, organization, plan, process, product, professional, project, quality, schema, shape, stack, stage, steps, strategy, structure, success, symbol. The prominent colors used in the PowerPoint template are Green, Black, White. You can be sure our 9 steps diverging concepts leading to one issue Arrows Chart Software PowerPoint Slides are Dynamic. Presenters tell us our concept PowerPoint templates and PPT Slides are Dynamic. We assure you our 9 steps diverging concepts leading to one issue Arrows Chart Software PowerPoint Slides are aesthetically designed to attract attention. We guarantee that they will grab all the eyeballs you need. Customers tell us our concept PowerPoint templates and PPT Slides are Royal. Presenters tell us our 9 steps diverging concepts leading to one issue Arrows Chart Software PowerPoint Slides have awesome images to get your point across. You can be sure our circle PowerPoint templates and PPT Slides are Quaint.
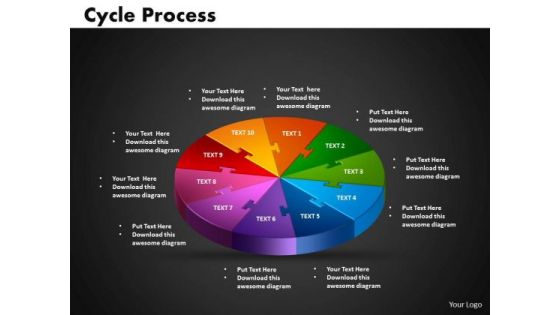
PowerPoint Theme Cycle Growth Ppt Design
PowerPoint Theme Cycle Growth PPT Design-Cycle Diagrams are a type of graphics that shows how items are related to one another in a repeating cycle. In a cycle diagram, you can explain the main events in the cycle, how they interact, and how the cycle repeats. -PowerPoint Theme Cycle Growth PPT Design-Business, Chart, Circle, Cycle, Marketing, Manage, Investment, Information, Growth, Graph, Flow, Process, Progress, Recycle, Rotation, Sequence, Sphere, Plan, Diagram, Direction

PowerPoint Theme Cycle Process Ppt Presentation
PowerPoint Theme Cycle Process PPT Presentation-Cycle Diagrams are a type of graphics that shows how items are related to one another in a repeating cycle. In a cycle diagram, you can explain the main events in the cycle, how they interact, and how the cycle repeats. -PowerPoint Theme Cycle Process PPT Presentation-Business, Chart, Circle, Cycle, Marketing, Manage, Investment, Information, Growth, Graph, Flow, Process, Progress, Recycle, Rotation, Sequence, Sphere, Plan, Diagram, Direction
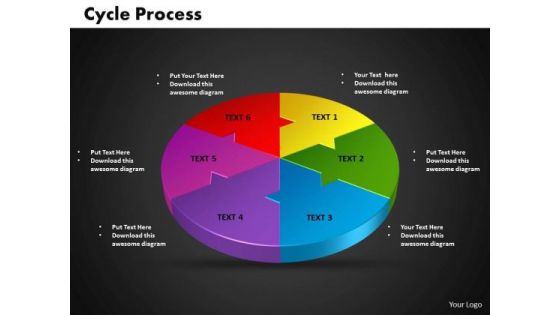
PowerPoint Themes Cycle Business Ppt Template
PowerPoint Themes Cycle Business PPT Template-Cycle Diagrams are a type of graphics that shows how items are related to one another in a repeating cycle. In a cycle diagram, you can explain the main events in the cycle, how they interact, and how the cycle repeats.-PowerPoint Themes Cycle Business PPT Template-Business, Chart, Circle, Cycle, Marketing, Manage, Investment, Information, Growth, Graph, Flow, Process, Progress, Recycle, Rotation, Sequence, Sphere, Plan, Diagram, Direction

PowerPoint Template Cycle Process Business Ppt Theme
PowerPoint Template Cycle Process Business PPT Theme-Cycle Diagrams are a type of graphics that shows how items are related to one another in a repeating cycle. In a cycle diagram, you can explain the main events in the cycle, how they interact, and how the cycle repeats.-PowerPoint Template Cycle Process Business PPT Theme-Background, Business, Chart, Circle, Circular, Marketing, Management, Flow, Graph, Process, Round, Segmented, Sequence, Wheel, Diagram, Division, Continuity, Template, Web, Illustration
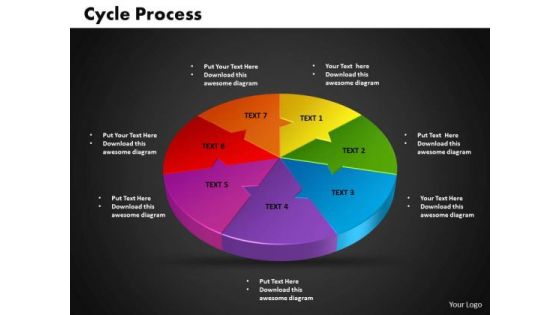
PowerPoint Template Cycle Process Ppt Themes
PowerPoint Template Cycle Process PPT Themes-Cycle Diagrams are a type of graphics that shows how items are related to one another in a repeating cycle. In a cycle diagram, you can explain the main events in the cycle, how they interact, and how the cycle repeats.-PowerPoint Template Cycle Process PPT Themes-Background, Business, Chart, Circle, Circular, Marketing, Management, Flow, Graph, Process, Round, Segmented, Sequence, Wheel, Diagram, Division, Continuity, Template, Web, Illustration

PowerPoint Template Cycle Process Success Ppt Theme
PowerPoint Template Cycle Process Success PPT Theme-Cycle Diagrams are a type of graphics that shows how items are related to one another in a repeating cycle. In a cycle diagram, you can explain the main events in the cycle, how they interact, and how the cycle repeats.-PowerPoint Template Cycle Process Success PPT Theme-Background, Business, Chart, Circle, Circular, Marketing, Management, Flow, Graph, Process, Round, Segmented, Sequence, Wheel, Diagram, Division, Continuity, Template, Web, Illustration
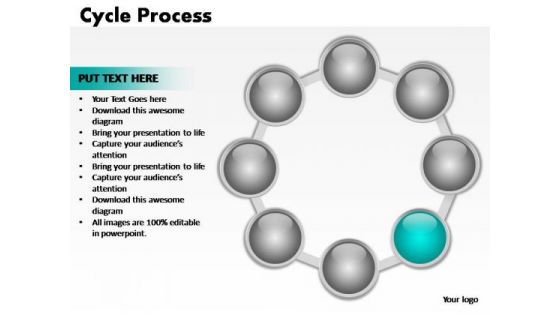
PowerPoint Themes Teamwork Cycle Process Ppt Design
PowerPoint Themes Teamwork Cycle Process PPT Design-Cycle Diagrams are a type of graphics that shows how items are related to one another in a repeating cycle. In a cycle diagram, you can explain the main events in the cycle, how they interact, and how the cycle repeats. These Diagrams can be used to interact visually and logically with audiences. -PowerPoint Themes Teamwork Cycle Process PPT Design
PowerPoint Themes Teamwork Cycle Process Ppt Process
PowerPoint Themes Teamwork Cycle Process PPT Process-Cycle Diagrams are a type of graphics that shows how items are related to one another in a repeating cycle. In a cycle diagram, you can explain the main events in the cycle, how they interact, and how the cycle repeats. These Diagrams can be used to interact visually and logically with audiences. -PowerPoint Themes Teamwork Cycle Process PPT Process

PowerPoint Theme Process Cycle Process Ppt Designs
PowerPoint Theme Process Cycle Process PPT Designs-Cycle Diagrams are a type of graphics that shows how items are related to one another in a repeating cycle. In a cycle diagram, you can explain the main events in the cycle, how they interact, and how the cycle repeats. These Diagrams can be used to interact visually and logically with audiences. -PowerPoint Theme Process Cycle Process PPT Designs

PowerPoint Presentation Cycle Process Chart Ppt Designs
PowerPoint Presentation Cycle Process Chart PPT Designs-Cycle Diagrams are a type of graphics that shows how items are related to one another in a repeating cycle. In a cycle diagram, you can explain the main events in the cycle, how they interact, and how the cycle repeats.-PowerPoint Presentation Cycle Process Chart PPT Designs-Background, Business, Chart, Circle, Circular, Marketing, Management, Flow, Graph, Process, Round, Segmented, Sequence, Wheel, Diagram, Division, Continuity, Template, Web, Illustration
PowerPoint Backgrounds Leadership Cycle Process Ppt Theme
PowerPoint Backgrounds Leadership Cycle Process PPT Theme-Cycle Diagrams are a type of graphics that shows how items are related to one another in a repeating cycle. In a cycle diagram, you can explain the main events in the cycle, how they interact, and how the cycle repeats. These Diagrams can be used to interact visually and logically with audiences.-PowerPoint Backgrounds Leadership Cycle Process PPT Theme
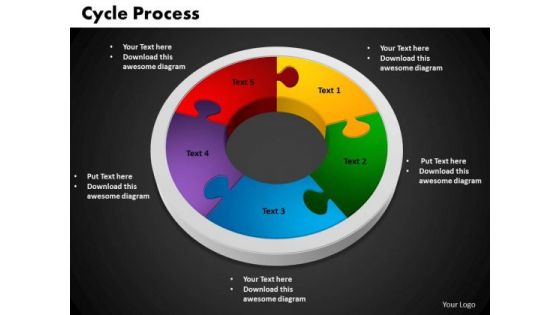
PowerPoint Slides Cycle Process Chart Ppt Template
PowerPoint Slides Cycle Process Chart PPT Template-Cycle Diagrams are a type of graphics that shows how items are related to one another in a repeating cycle. In a cycle diagram, you can explain the main events in the cycle, how they interact, and how the cycle repeats.-PowerPoint Slides Cycle Process Chart PPT Template-Cycle, Design, Diagram, Element, Graph, Business, Chart, Circular, Connect, Connection, Puzzle, Round, Solving, Step, Together, Putting, Mystery, Linking, Infographic, Icon,

Cmbd App Configuration Mapping For Tech Teams Guidelines PDF
The following slide display flow diagram for CMBD application mapping framework with its key components. It further includes elements such as cost allocation, risk analysis, cause and effect, etc. Persuade your audience using this Cmbd App Configuration Mapping For Tech Teams Guidelines PDF. This PPT design covers three stages, thus making it a great tool to use. It also caters to a variety of topics including Functional Component, Application Instance, Risk Analysis. Download this PPT design now to present a convincing pitch that not only emphasizes the topic but also showcases your presentation skills.

Pyramid Guidelines Model To Maximize Profits Guidelines PDF
The following slide presents a diagram of pyramid principle showing ideas to develop strategy for increasing business profits in upcoming years. It includes key elements like business goals, key measures to achieve goals and supporting insights. Persuade your audience using this Pyramid Guidelines Model To Maximize Profits Guidelines PDF. This PPT design covers Six stages, thus making it a great tool to use. It also caters to a variety of topics including Maximize Revenues, Minimize Costs And Expenditures. Download this PPT design now to present a convincing pitch that not only emphasizes the topic but also showcases your presentation skills.
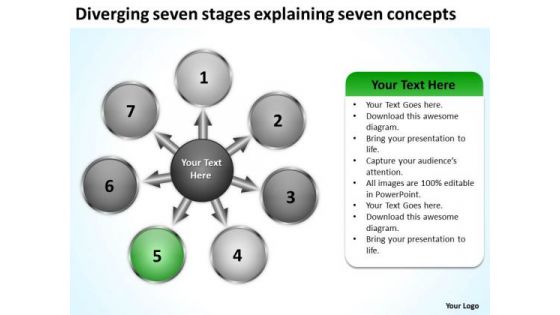
Diverging Seven Stages Explaining Concepts Circular Chart PowerPoint Slides
We present our diverging seven stages explaining concepts Circular Chart PowerPoint Slides.Present our Business PowerPoint Templates because a brainwave has occurred to you after review. You know just how to push the graph skyward. Download our Circle Charts PowerPoint Templates because educate your staff on the means to provide the required support for speedy recovery. Present our Arrows PowerPoint Templates because this Diagram pinpoints the critical paths and areas in your process and set the timelines for their completion. Present our Shapes PowerPoint Templates because the plans are in your head, stage by stage, year by year. Download and present our Flow charts PowerPoint Templates because this diagram provides multiple options for taking in and making sense of information.Use these PowerPoint slides for presentations relating to Arrows, blank, business, central, centralized, chart, circle, circular, circulation concept, conceptual, converging, design, diagram, empty, executive, icon, idea illustration, management, map, mapping, moa, model, numbers, organization outwards, pointing, procedure, process, radial, radiating, relationship, resource sequence, sequential, seven, square, strategy, template. The prominent colors used in the PowerPoint template are Green, Gray, White. Presenters tell us our diverging seven stages explaining concepts Circular Chart PowerPoint Slides will help you be quick off the draw. Just enter your specific text and see your points hit home. Presenters tell us our circulation PowerPoint templates and PPT Slides are Spiffy. PowerPoint presentation experts tell us our diverging seven stages explaining concepts Circular Chart PowerPoint Slides are Nifty. We assure you our centralized PowerPoint templates and PPT Slides are Glamorous. Customers tell us our diverging seven stages explaining concepts Circular Chart PowerPoint Slides are Multicolored. People tell us our circle PowerPoint templates and PPT Slides are Bold.
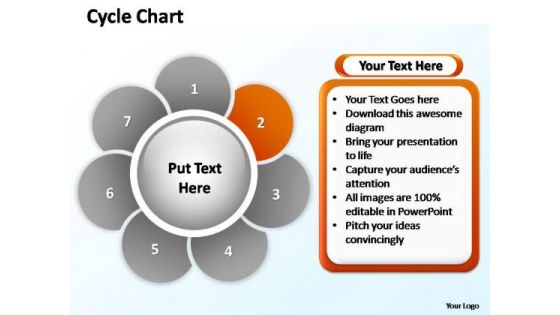
PowerPoint Slides Growth Cycle Chart Ppt Presentation
PowerPoint Slides Growth Cycle Chart PPT Presentation-Cycle Diagrams are a type of graphics that shows how items are related to one another in a repeating cycle. In a cycle diagram, you can explain the main events in the cycle, how they interact, and how the cycle repeats. These Diagrams can be used to interact visually and logically with audiences. -PowerPoint Slides Growth Cycle Chart PPT Presentation
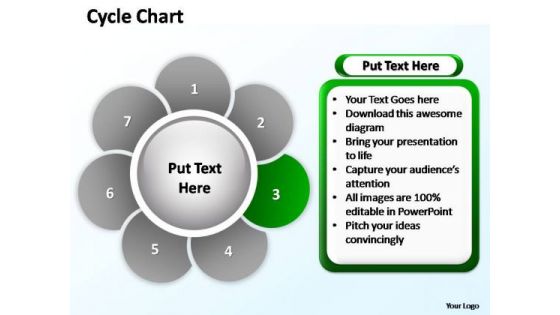
PowerPoint Slides Strategy Cycle Chart Ppt Layouts
PowerPoint Slides Strategy Cycle Chart PPT Layouts-Cycle Diagrams are a type of graphics that shows how items are related to one another in a repeating cycle. In a cycle diagram, you can explain the main events in the cycle, how they interact, and how the cycle repeats. These Diagrams can be used to interact visually and logically with audiences. -PowerPoint Slides Strategy Cycle Chart PPT Layouts
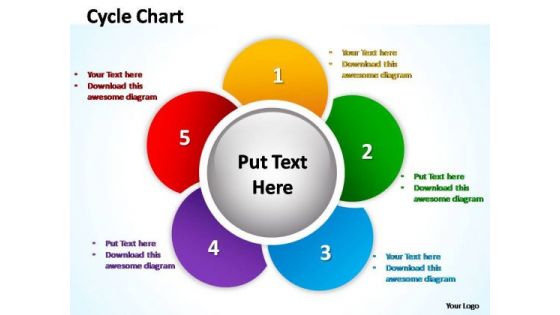
PowerPoint Backgrounds Growth Cycle Chart Ppt Design
PowerPoint Backgrounds Growth Cycle Chart PPT Design-Cycle Diagrams are a type of graphics that shows how items are related to one another in a repeating cycle. In a cycle diagram, you can explain the main events in the cycle, how they interact, and how the cycle repeats. These Diagrams can be used to interact visually and logically with audiences.-PowerPoint Backgrounds Growth Cycle Chart PPT Design

PowerPoint Backgrounds Image Cycle Chart Ppt Slide
PowerPoint Backgrounds Image Cycle Chart PPT Slide-Cycle Diagrams are a type of graphics that shows how items are related to one another in a repeating cycle. In a cycle diagram, you can explain the main events in the cycle, how they interact, and how the cycle repeats. These Diagrams can be used to interact visually and logically with audiences.-PowerPoint Backgrounds Image Cycle Chart PPT Slide
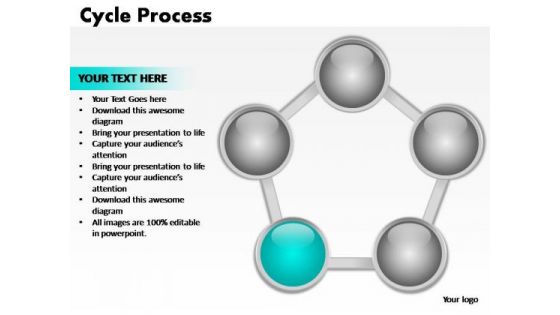
PowerPoint Design Chart Cycle Process Ppt Backgrounds
PowerPoint Design Chart Cycle Process PPT Backgrounds-Cycle Diagrams are a type of graphics that shows how items are related to one another in a repeating cycle. In a cycle diagram, you can explain the main events in the cycle, how they interact, and how the cycle repeats. These Diagrams can be used to interact visually and logically with audiences.-PowerPoint Design Chart Cycle Process PPT Backgrounds
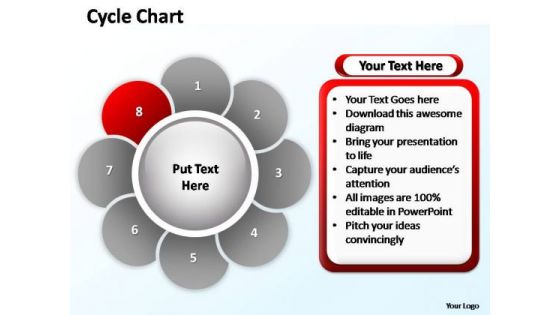
PowerPoint Design Image Cycle Chart Ppt Templates
PowerPoint Design Image Cycle Chart PPT Templates-Cycle Diagrams are a type of graphics that shows how items are related to one another in a repeating cycle. In a cycle diagram, you can explain the main events in the cycle, how they interact, and how the cycle repeats. These Diagrams can be used to interact visually and logically with audiences.-PowerPoint Design Image Cycle Chart PPT Templates
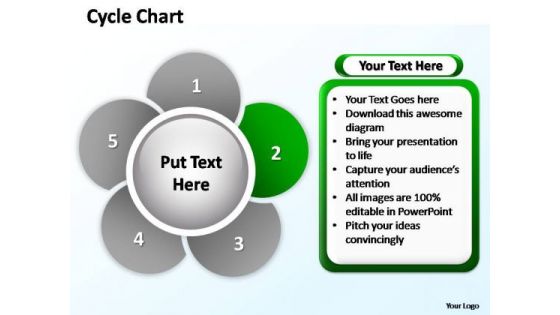
PowerPoint Designs Business Cycle Chart Ppt Slides
PowerPoint Designs Business Cycle Chart PPT Slides-Cycle Diagrams are a type of graphics that shows how items are related to one another in a repeating cycle. In a cycle diagram, you can explain the main events in the cycle, how they interact, and how the cycle repeats. These Diagrams can be used to interact visually and logically with audiences. -PowerPoint Designs Business Cycle Chart PPT Slides
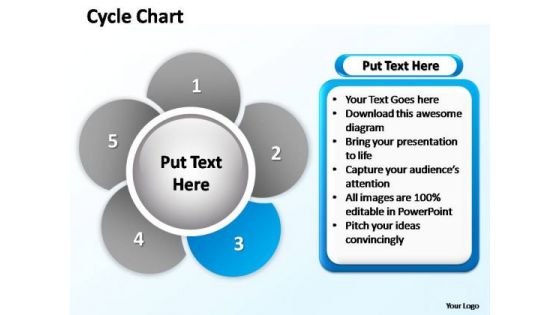
PowerPoint Designs Company Cycle Chart Ppt Process
PowerPoint Designs Company Cycle Chart PPT Process-Cycle Diagrams are a type of graphics that shows how items are related to one another in a repeating cycle. In a cycle diagram, you can explain the main events in the cycle, how they interact, and how the cycle repeats. These Diagrams can be used to interact visually and logically with audiences. -PowerPoint Designs Company Cycle Chart PPT Process

PowerPoint Designs Image Cycle Chart Ppt Layout
PowerPoint Designs Image Cycle Chart PPT Layout-Cycle Diagrams are a type of graphics that shows how items are related to one another in a repeating cycle. In a cycle diagram, you can explain the main events in the cycle, how they interact, and how the cycle repeats. These Diagrams can be used to interact visually and logically with audiences. -PowerPoint Designs Image Cycle Chart PPT Layout

3 Square Arrows Diverging Factors Of Business Process Cycle Chart PowerPoint Templates
We present our 3 square arrows diverging factors of business process Cycle Chart PowerPoint templates.Present our Business PowerPoint Templates because you have churned your mind and come upwith solutions. Use our Boxes PowerPoint Templates because it helps you to satiate the brains of your team with a taste of the final product. Use our Arrows PowerPoint Templates because this diagram helps to reaffirm to your team your faith in maintaining the highest ethical standards. Use our Circle Charts PowerPoint Templates because it helps to anticipate the doubts and questions in the minds of your colleagues and enlighten them with your inspired strategy to garner desired success. Use our Flow Charts PowerPoint Templates because this diagram is designed to help your audience to develop their thoughts along the way.Use these PowerPoint slides for presentations relating to abstract, arrow, backdrop, background, banner, blank, blue, box, bright, brochure, business, chart, circle, color, colorful, concept, cube, description, design, diagram, element, empty, flyer, form, frame, graphic, illustration, item, management, marketing, message, modern, network, pink, place, presentation, purple, red, shape, sign, site, square, style, symbol, template, text, vector, web, website, yellow. The prominent colors used in the PowerPoint template are Yellow, Green lime , Green. Presenters tell us our 3 square arrows diverging factors of business process Cycle Chart PowerPoint templates are Whimsical. You can be sure our box PowerPoint templates and PPT Slides are Flirty. Professionals tell us our 3 square arrows diverging factors of business process Cycle Chart PowerPoint templates are Tasteful. People tell us our bright PowerPoint templates and PPT Slides are Fantastic. People tell us our 3 square arrows diverging factors of business process Cycle Chart PowerPoint templates are Wonderful. Professionals tell us our blank PowerPoint templates and PPT Slides are Tasteful.

PowerPoint Backgrounds Chart Circular Process Ppt Design Slides
PowerPoint Backgrounds Chart Circular Process PPT Design Slides-Cycle Diagrams are a type of graphics that shows how items are related to one another in a repeating cycle. In a cycle diagram, you can explain the main events in the cycle, how they interact, and how the cycle repeats. These Diagrams can be used to interact visually and logically with audiences.-PowerPoint Backgrounds Chart Circular Process PPT Design Slides
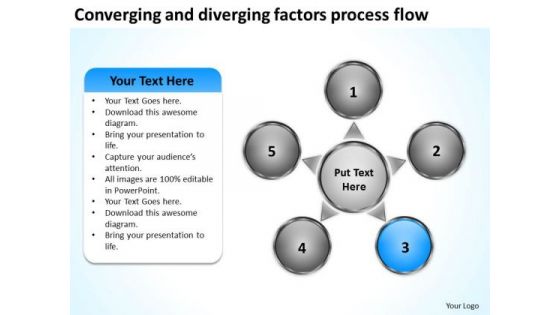
And Diverging Factors Process Flow Chart Relative Circular Arrow Network PowerPoint Templates
We present our and diverging factors process flow chart Relative Circular Arrow Network PowerPoint templates.Present our Business PowerPoint Templates because you are ready to flap your wings and launch off. All poised are you to touch the sky with glory. Download and present our Process and Flows PowerPoint Templates because you have a good idea of the roadmap to your desired destination. Download and present our Marketing PowerPoint Templates because networking is an imperative in todays world. You need to access the views of others. Similarly you need to give access to them of your abilities. Download our Circle Charts PowerPoint Templates because presenting your views using our innovative slides, will be assured of leaving a lasting impression. Present our Flow Charts PowerPoint Templates because honesty is the best policy has an ardent follower in you.Use these PowerPoint slides for presentations relating to Achievement, Aim, Arrow, Business, Chart, Communication, Diagram, Direction, Graphic, Growth, Guide, Increase, Marketing, Presentation, Shape, Sign, Success, Target, Team, Teamwork. The prominent colors used in the PowerPoint template are Blue, White, Gray. People tell us our and diverging factors process flow chart Relative Circular Arrow Network PowerPoint templates will help them to explain complicated concepts. Use our Diagram PowerPoint templates and PPT Slides are Liberated. Professionals tell us our and diverging factors process flow chart Relative Circular Arrow Network PowerPoint templates are Functional. Presenters tell us our Communication PowerPoint templates and PPT Slides are Delightful. Professionals tell us our and diverging factors process flow chart Relative Circular Arrow Network PowerPoint templates look good visually. PowerPoint presentation experts tell us our Diagram PowerPoint templates and PPT Slides will help them to explain complicated concepts.
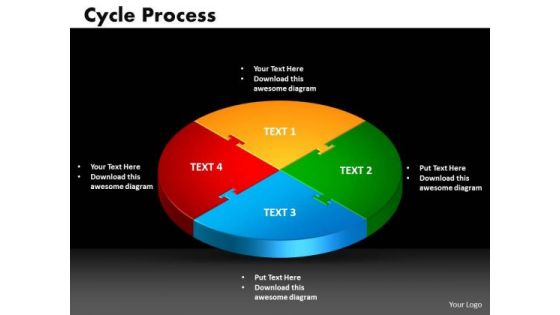
PowerPoint Process Cycle Process Growth Ppt Slides
PowerPoint Process Cycle Process Growth PPT Slides-Cycle Diagrams are a type of graphics that shows how items are related to one another in a repeating cycle. In a cycle diagram, you can explain the main events in the cycle, how they interact, and how the cycle repeats.-PowerPoint Process Cycle Process Growth PPT Slides-Background, Business, Chart, Circle, Circular, Marketing, Management, Flow, Graph, Process, Round, Segmented, Sequence, Wheel, Diagram, Division, Continuity, Template, Web, Illustration

Promotion Standard Practices Tools And Templates Closed Loop Customer Feedback With Inner And Outer Circle Elements PDF
Mentioned slide displays a closed loop customer feedback diagram along with inner and outer circles. This slide will help the marketers in sharing relevant customer feedback instantly to right groups through ticketing.Deliver an awe inspiring pitch with this creative promotion standard practices tools and templates closed loop customer feedback with inner and outer circle elements pdf bundle. Topics like customer experience, important to focus on most, important challengers and customers can be discussed with this completely editable template. It is available for immediate download depending on the needs and requirements of the user.
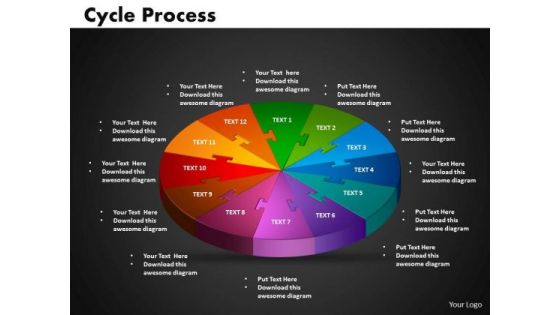
PowerPoint Templates Cycle Process Editable Ppt Presentation
PowerPoint Templates Cycle Process Editable PPT Presentation-Cycle Diagrams are a type of graphics that shows how items are related to one another in a repeating cycle. In a cycle diagram, you can explain the main events in the cycle, how they interact, and how the cycle repeats.-PowerPoint Templates Cycle Process Editable PPT Presentation-Business, Chart, Circle, Cycle, Marketing, Manage, Investment, Information, Growth, Graph, Flow, Process, Progress, Recycle, Rotation, Sequence, Sphere, Plan, Diagram, Direction

PowerPoint Design Cycle Process Editable Ppt Template
PowerPoint Design Cycle Process Editable PPT Template-Cycle Diagrams are a type of graphics that shows how items are related to one another in a repeating cycle. In a cycle diagram, you can explain the main events in the cycle, how they interact, and how the cycle repeats. -PowerPoint Design Cycle Process Editable PPT Template-Background, Business, Chart, Circle, Circular, Marketing, Management, Flow, Graph, Process, Round, Segmented, Sequence, Wheel, Diagram, Division, Continuity, Template, Web, Illustration

PowerPoint Design Cycle Process Marketing Ppt Slide
PowerPoint Design Cycle Process Marketing PPT Slide-Cycle Diagrams are a type of graphics that shows how items are related to one another in a repeating cycle. In a cycle diagram, you can explain the main events in the cycle, how they interact, and how the cycle repeats.-PowerPoint Design Cycle Process Marketing PPT Slide-Background, Business, Chart, Circle, Circular, Marketing, Management, Flow, Graph, Process, Round, Segmented, Sequence, Wheel, Diagram, Division, Continuity, Template, Web, Illustration
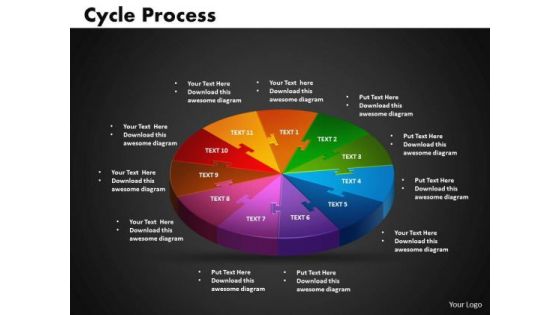
PowerPoint Design Cycle Process Ppt Design
PowerPoint Design Cycle Process PPT Design-Cycle Diagrams are a type of graphics that shows how items are related to one another in a repeating cycle. In a cycle diagram, you can explain the main events in the cycle, how they interact, and how the cycle repeats. -PowerPoint Design Cycle Process PPT Design-Business, Chart, Circle, Cycle, Marketing, Manage, Investment, Information, Growth, Graph, Flow, Process, Progress, Recycle, Rotation, Sequence, Sphere, Plan, Diagram, Direction

PowerPoint Presentation Cycle Leadership Ppt Template
PowerPoint Presentation Cycle Leadership PPT Template-Cycle Diagrams are a type of graphics that shows how items are related to one another in a repeating cycle. In a cycle diagram, you can explain the main events in the cycle, how they interact, and how the cycle repeats.-PowerPoint Presentation Cycle Leadership PPT Template-Business, Chart, Circle, Cycle, Marketing, Manage, Investment, Information, Growth, Graph, Flow, Process, Progress, Recycle, Rotation, Sequence, Sphere, Plan, Diagram, Direction
PowerPoint Presentation Cycle Process Business Ppt Designs
PowerPoint Presentation Cycle Process Business PPT Designs-Cycle Diagrams are a type of graphics that shows how items are related to one another in a repeating cycle. In a cycle diagram, you can explain the main events in the cycle, how they interact, and how the cycle repeats.-PowerPoint Presentation Cycle Process Business PPT Designs-Business, Chart, Circle, Cycle, Marketing, Manage, Investment, Information, Growth, Graph, Flow, Process, Progress, Recycle, Rotation, Sequence, Sphere, Plan, Diagram, Direction
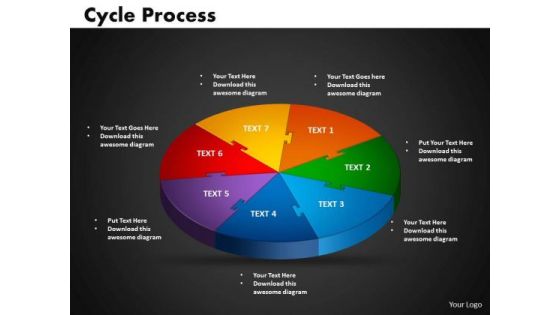
PowerPoint Presentation Cycle Success Ppt Template
PowerPoint Presentation Cycle Success PPT Template-Cycle Diagrams are a type of graphics that shows how items are related to one another in a repeating cycle. In a cycle diagram, you can explain the main events in the cycle, how they interact, and how the cycle repeats.-PowerPoint Presentation Cycle Success PPT Template-Background, Business, Chart, Circle, Circular, Marketing, Management, Flow, Graph, Process, Round, Segmented, Sequence, Wheel, Diagram, Division, Continuity, Template, Web, Illustration
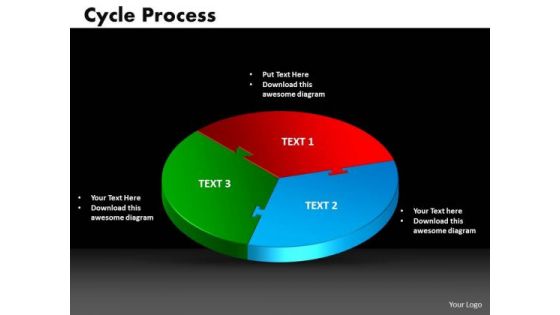
PowerPoint Template Cycle Process Ppt Designs
PowerPoint Template Cycle Process PPT Designs-Cycle Diagrams are a type of graphics that shows how items are related to one another in a repeating cycle. In a cycle diagram, you can explain the main events in the cycle, how they interact, and how the cycle repeats.-PowerPoint Template Cycle Process PPT Designs-Background, Business, Chart, Circle, Circular, Marketing, Management, Flow, Graph, Process, Round, Segmented, Sequence, Wheel, Diagram, Division, Continuity, Template, Web, Illustration
PowerPoint Templates Cycle Process Success Ppt Slides
PowerPoint Templates Cycle Process Success PPT Slides-Cycle Diagrams are a type of graphics that shows how items are related to one another in a repeating cycle. In a cycle diagram, you can explain the main events in the cycle, how they interact, and how the cycle repeats.-PowerPoint Templates Cycle Process Success PPT Slides-Business, Chart, Circle, Cycle, Marketing, Manage, Investment, Information, Growth, Graph, Flow, Process, Progress, Recycle, Rotation, Sequence, Sphere, Plan, Diagram, Direction
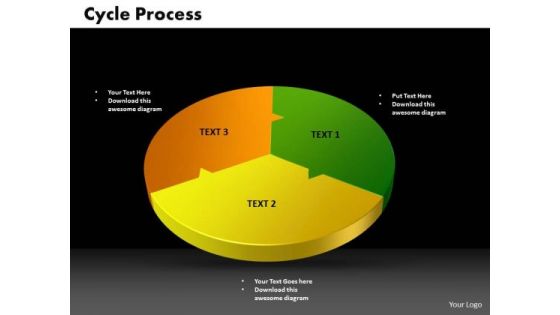
PowerPoint Slides Cycle Process Success Ppt Backgrounds
PowerPoint Slides Cycle Process Success PPT Backgrounds-Cycle Diagrams are a type of graphics that shows how items are related to one another in a repeating cycle. In a cycle diagram, you can explain the main events in the cycle, how they interact, and how the cycle repeats.-PowerPoint Slides Cycle Process Success PPT Backgrounds-Cycle, Design, Diagram, Element, Graph, Business, Chart, Circular, Connect, Connection, Puzzle, Round, Solving, Step, Together, Putting, Mystery, Linking, Infographic, Icon,

PowerPoint Slides Cycle Process Success Ppt Designs
PowerPoint Slides Cycle Process Success PPT Designs-Cycle Diagrams are a type of graphics that shows how items are related to one another in a repeating cycle. In a cycle diagram, you can explain the main events in the cycle, how they interact, and how the cycle repeats.-PowerPoint Slides Cycle Process Success PPT Designs-Cycle, Design, Diagram, Element, Graph, Business, Chart, Circular, Connect, Connection, Puzzle, Round, Solving, Step, Together, Putting, Mystery, Linking, Infographic, Icon,
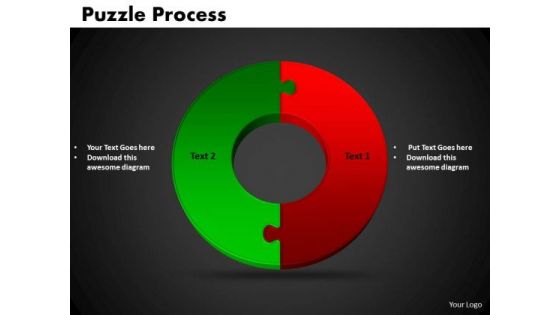
PowerPoint Templates Cycle Puzzle Success Ppt Designs
PowerPoint Templates Cycle Puzzle Success PPT Designs-Cycle Diagrams are a type of graphics that shows how items are related to one another in a repeating cycle. In a cycle diagram, you can explain the main events in the cycle, how they interact, and how the cycle repeats.-PowerPoint Templates Cycle Puzzle Success PPT Designs-Cycle, Design, Diagram, Element, Graph, Business, Chart, Circular, Connect, Connection, Puzzle, Round, Solving, Step, Together, Putting, Mystery, Linking, Infographic, Icon,
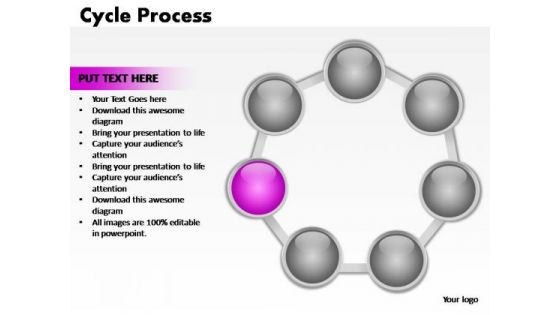
PowerPoint Slides Company Cycle Process Ppt Design
PowerPoint Slides Company Cycle Process PPT Design-Cycle Diagrams are a type of graphics that shows how items are related to one another in a repeating cycle. In a cycle diagram, you can explain the main events in the cycle, how they interact, and how the cycle repeats. These Diagrams can be used to interact visually and logically with audiences. -PowerPoint Slides Company Cycle Process PPT Design

PowerPoint Template Company Cycle Process Ppt Slides
PowerPoint Template Company Cycle Process PPT Slides-Cycle Diagrams are a type of graphics that shows how items are related to one another in a repeating cycle. In a cycle diagram, you can explain the main events in the cycle, how they interact, and how the cycle repeats. These Diagrams can be used to interact visually and logically with audiences. -PowerPoint Template Company Cycle Process PPT Slides

PowerPoint Template Cycle Process Business Ppt Designs
PowerPoint Template Cycle Process Business PPT Designs-Cycle Diagrams are a type of graphics that shows how items are related to one another in a repeating cycle. In a cycle diagram, you can explain the main events in the cycle, how they interact, and how the cycle repeats.-PowerPoint Template Cycle Process Business PPT Designs-Cycle, Design, Diagram, Element, Graph, Business, Chart, Circular, Connect, Connection, Puzzle, Round, Solving, Step, Together, Putting, Mystery, Linking, Infographic, Icon,

PowerPoint Slides Company Cycle Process Ppt Slide
PowerPoint Slides Company Cycle Process PPT Slide-Cycle Diagrams are a type of graphics that shows how items are related to one another in a repeating cycle. In a cycle diagram, you can explain the main events in the cycle, how they interact, and how the cycle repeats. These Diagrams can be used to interact visually and logically with audiences. -PowerPoint Slides Company Cycle Process PPT Slide
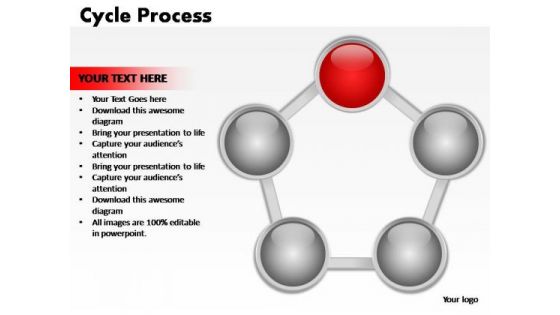
PowerPoint Slides Sales Cycle Process Ppt Designs
PowerPoint Slides Sales Cycle Process PPT Designs-Cycle Diagrams are a type of graphics that shows how items are related to one another in a repeating cycle. In a cycle diagram, you can explain the main events in the cycle, how they interact, and how the cycle repeats. These Diagrams can be used to interact visually and logically with audiences. -PowerPoint Slides Sales Cycle Process PPT Designs

PowerPoint Backgrounds Teamwork Cycle Process Ppt Design Slides
PowerPoint Backgrounds Teamwork Cycle Process PPT Design Slides-Cycle Diagrams are a type of graphics that shows how items are related to one another in a repeating cycle. In a cycle diagram, you can explain the main events in the cycle, how they interact, and how the cycle repeats. These Diagrams can be used to interact visually and logically with audiences.-PowerPoint Backgrounds Teamwork Cycle Process PPT Design Slides

 Home
Home