Sliding Scale
Brand Image Things Comes To Mind When Think About The Company Inspiration PDF
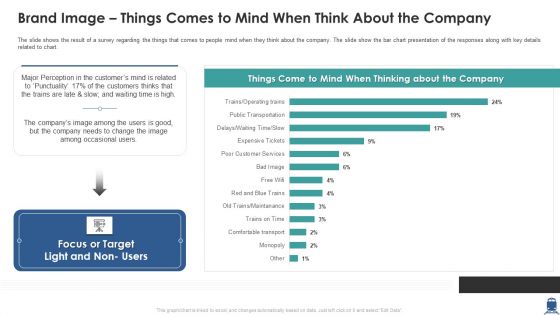
The slide shows the result of a survey regarding the things that comes to people mind when they think about the company. The slide show the bar chart presentation of the responses along with key details related to chart. Deliver an awe inspiring pitch with this creative brand image things comes to mind when think about the company inspiration pdf bundle. Topics like brand image things comes to mind when think about the company can be discussed with this completely editable template. It is available for immediate download depending on the needs and requirements of the user.

Brand Image Hings Comes To Mind When Think About The Company Inspiration PDF
The slide shows the result of a survey regarding the things that comes to people mind when they think about the company. The slide show the bar chart presentation of the responses along with key details related to chart.Deliver an awe inspiring pitch with this creative brand image hings comes to mind when think about the company inspiration pdf bundle. Topics like company overview, protect and safeguard, sustainable integrated can be discussed with this completely editable template. It is available for immediate download depending on the needs and requirements of the user.
Project Budget Planning Summary With Planned And Actual Cost Details Icons PDF
This slide covers table with bar graph of planned vs actual cost and deviation. It also includes type of costs such as planned cost, actual cost and value difference. Showcasing this set of slides titled project budget planning summary with planned and actual cost details icons pdf. The topics addressed in these templates are planned vs actual cost, deviation. All the content presented in this PPT design is completely editable. Download it and make adjustments in color, background, font etc. as per your unique business setting.
Cyber Risk Security Market Growth With Current Trends Summary PDF
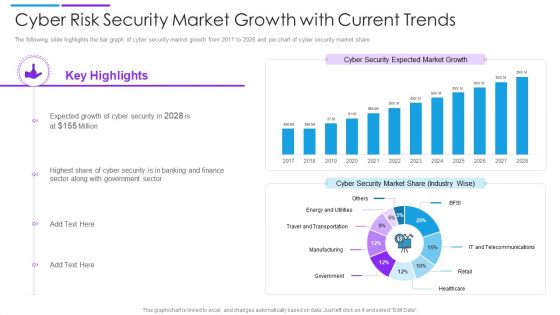
The following slide highlights the bar graph of cyber security market growth from 2017 to 2028 and pie chart of cyber security market share. Showcasing this set of slides titled cyber risk security market growth with current trends summary pdf. The topics addressed in these templates are cyber security market share, cyber security expected market growth, banking and finance. All the content presented in this PPT design is completely editable. Download it and make adjustments in color, background, font etc. as per your unique business setting.

Market Share Statistics Of Different IT Cloud Services Providers Topics PDF
This slide represents the market comparison bar graph on market share of different cloud computing service providers. It includes competitive analysis between various companies and there implemented strategies for growth. Showcasing this set of slides titled market share statistics of different it cloud services providers topics pdf. The topics addressed in these templates are largest market share, cloud computing services. All the content presented in this PPT design is completely editable. Download it and make adjustments in color, background, font etc. as per your unique business setting.

Managing Time Dashboard Of Website Development Project Ppt PowerPoint Presentation Gallery Outline PDF
This slide shows the dashboard highlighting the time taken to perform different activities for website development project. It shows the members involved in the project and bar graph representing performance of a week. Showcasing this set of slides titled managing time dashboard of website development project ppt powerpoint presentation gallery outline pdf. The topics addressed in these templates are workspace, project, data management, recent timestamps. All the content presented in this PPT design is completely editable. Download it and make adjustments in color, background, font etc. as per your unique business setting.
Top Performing New Client Acquire Channels Elements PDF
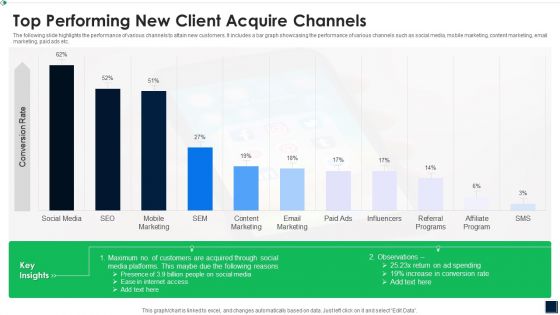
The following slide highlights the performance of various channels to attain new customers. It includes a bar graph showcasing the performance of various channels such as social media, mobile marketing, content marketing, email marketing, paid ads etc. Showcasing this set of slides titled Top Performing New Client Acquire Channels Elements PDF The topics addressed in these templates are Top Performing New Client Acquire Channels All the content presented in this PPT design is completely editable. Download it and make adjustments in color, background, font etc. as per your unique business setting.

Stakeholder Evaluation Plan Dashboard With Acceptance Level Of New Reforms Background PDF
This slide illustrates statistical analysis of key stakeholders of the corporation. It includes pie chart of key stakeholders and bar graph of their level of acceptance of new reforms. Showcasing this set of slides titled Stakeholder Evaluation Plan Dashboard With Acceptance Level Of New Reforms Background PDF. The topics addressed in these templates are Level Acceptance, Key Stakeholders, Critical Stakeholder. All the content presented in this PPT design is completely editable. Download it and make adjustments in color, background, font etc. as per your unique business setting.

Achieved And Pending Workplace Diversity Objectives Chart Guidelines PDF
This slide displays the bar chart representing the percentage of diversity goals achieved. It also includes some key insights such as an increase in the women workforce in tech roles, increase in director level black representation, etc. Showcasing this set of slides titled Achieved And Pending Workplace Diversity Objectives Chart Guidelines PDF. The topics addressed in these templates are Achieved And Pending Workplace, Diversity Objectives Chart. All the content presented in this PPT design is completely editable. Download it and make adjustments in color, background, font etc. as per your unique business setting.
Domestic Budget Plan Expenses Category Analysis Ppt PowerPoint Presentation Layouts Inspiration PDF
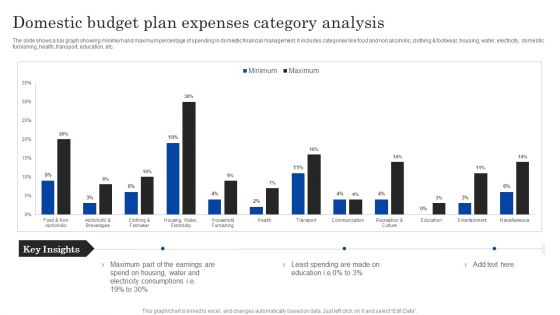
The slide shows a bar graph showing minimum and maximum percentage of spending in domestic financial management. It includes categories like food and non alcoholic, clothing and footwear, housing, water, electricity, domestic furnishing, health, transport, education, etc.Showcasing this set of slides titled Domestic Budget Plan Expenses Category Analysis Ppt PowerPoint Presentation Layouts Inspiration PDF. The topics addressed in these templates are Part Earnings, Electricity Consumptions, Least Spending. All the content presented in this PPT design is completely editable. Download it and make adjustments in color, background, font etc. as per your unique business setting.

Monthly Domestic Family Budget Plan Analysis Ppt PowerPoint Presentation Portfolio Guide PDF
The slide shows a bar graph analyzing monthly family budget for effective financial planning . It shows projected and actual cash flow, total income and total expenses.Showcasing this set of slides titled Monthly Domestic Family Budget Plan Analysis Ppt PowerPoint Presentation Portfolio Guide PDF. The topics addressed in these templates are Total Income, Total Expenses, Cash Flow. All the content presented in this PPT design is completely editable. Download it and make adjustments in color, background, font etc. as per your unique business setting.
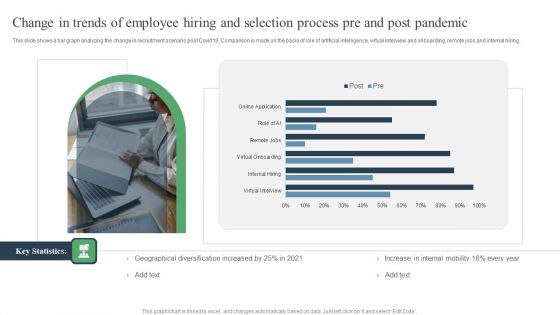
Change In Trends Of Employee Hiring And Selection Process Pre And Post Pandemic Ppt PowerPoint Presentation Images PDF
This slide shows a bar graph analyzing the change in recruitment scenario post Covid19. Comparison is made on the basis of role of artificial intelligence, virtual interview and onboarding, remote jobs and internal hiring. Showcasing this set of slides titled Change In Trends Of Employee Hiring And Selection Process Pre And Post Pandemic Ppt PowerPoint Presentation Images PDF. The topics addressed in these templates are Geographical Diversification, Internal Mobility, Virtual Onboarding. All the content presented in this PPT design is completely editable. Download it and make adjustments in color, background, font etc. as per your unique business setting.
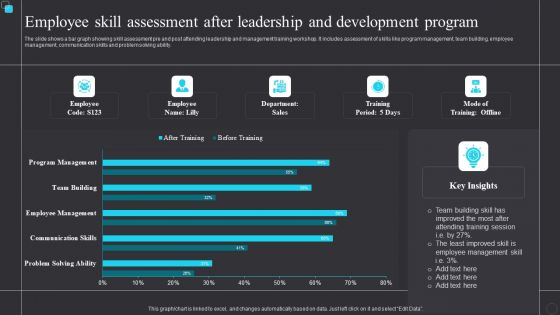
Employee Skill Assessment After Leadership And Development Program Themes PDF
The slide shows a bar graph showing skill assessment pre and post attending leadership and management training workshop. It includes assessment of skills like program management, team building, employee management, communication skills and problem solving ability. Showcasing this set of slides titled Employee Skill Assessment After Leadership And Development Program Themes PDF. The topics addressed in these templates are Team, Employee Management. All the content presented in this PPT design is completely editable. Download it and make adjustments in color, background, font etc. as per your unique business setting.

HR KPI Dashboard With Staff Payroll Details Ppt PowerPoint Presentation File Layout Ideas PDF
This slide represents the key performance indicator dashboard with salary details of employee working in an organisation. It includes turnover rate, pie chart of employment contract and status, bar graph based on employee gender. Showcasing this set of slides titled HR KPI Dashboard With Staff Payroll Details Ppt PowerPoint Presentation File Layout Ideas PDF. The topics addressed in these templates are Turnover Rate, Absenteeism Rate, Permanent Rate. All the content presented in this PPT design is completely editable. Download it and make adjustments in color, background, font etc. as per your unique business setting.

Agile Project Incremental Life Cycles Plan Gantt Chart Guidelines PDF
This slide covers gantt chart of agile project iteration tasks. It includes tasks such as sprint planning, set up staging environment, configure multilingual features, create base theme, etc. Along with assigned persons and task progress bars. Showcasing this set of slides titled Agile Project Incremental Life Cycles Plan Gantt Chart Guidelines PDF. The topics addressed in these templates are Agile Project Plan, Sprint Planning, Assemble Template. All the content presented in this PPT design is completely editable. Download it and make adjustments in color, background, font etc. as per your unique business setting.
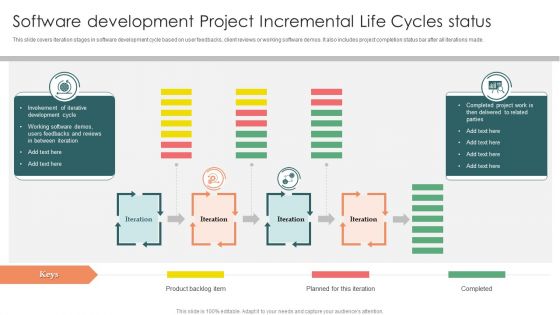
Software Development Project Incremental Life Cycles Status Rules PDF
This slide covers iteration stages in software development cycle based on user feedbacks, client reviews or working software demos. It also includes project completion status bar after all iterations made. Showcasing this set of slides titled Software Development Project Incremental Life Cycles Status Rules PDF. The topics addressed in these templates are Software development, Project Incremental, Life Cycles status. All the content presented in this PPT design is completely editable. Download it and make adjustments in color, background, font etc. as per your unique business setting.

Industry Wise Budget Spending For Planning And Implementing Promotional Activities Introduction PDF
This slide display the bar chart which illustrates percentage of marketing expenditure from overall budget of company for various industries such as food and beverage, consumer services, software, transportation,education and banking etc. Showcasing this set of slides titled Industry Wise Budget Spending For Planning And Implementing Promotional Activities Introduction PDF. The topics addressed in these templates are Marketing, Beverage Industry, Budget. All the content presented in this PPT design is completely editable. Download it and make adjustments in color, background, font etc. as per your unique business setting.

Multi Product Customer Ratings With Annual Sales Infographics PDF
This slide shows statistics for company sales corresponding to customer ratings for various products such as cat food, granola bars, air purifiers, herbal cosmetics, etc to formulate improvement strategies for least popular goods. Showcasing this set of slides titled Multi Product Customer Ratings With Annual Sales Infographics PDF. The topics addressed in these templates are Target For Current Year, Average Customer Rating. All the content presented in this PPT design is completely editable. Download it and make adjustments in color, background, font etc. as per your unique business setting.

Team Resource Demand And Capacity Optimization Dashboard Demonstration PDF
This slide illustrates facts and figures related to resource allocation in a software project to manage demand. It includes total team capacity, individual resource capacity, team capacity bar graph etc. Showcasing this set of slides titled Team Resource Demand And Capacity Optimization Dashboard Demonstration PDF. The topics addressed in these templates are Individual Resource Capacity, Team Capacity. All the content presented in this PPT design is completely editable. Download it and make adjustments in color, background, font etc. as per your unique business setting.
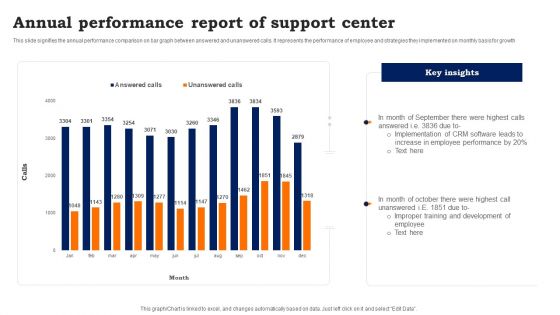
Annual Performance Report Of Support Center Inspiration PDF
This slide signifies the annual performance comparison on bar graph between answered and unanswered calls. It represents the performance of employee and strategies they implemented on monthly basis for growth. Showcasing this set of slides titled Annual Performance Report Of Support Center Inspiration PDF. The topics addressed in these templates are Annual Performance, Report Of Support Center. All the content presented in this PPT design is completely editable. Download it and make adjustments in color, background, font etc. as per your unique business setting.
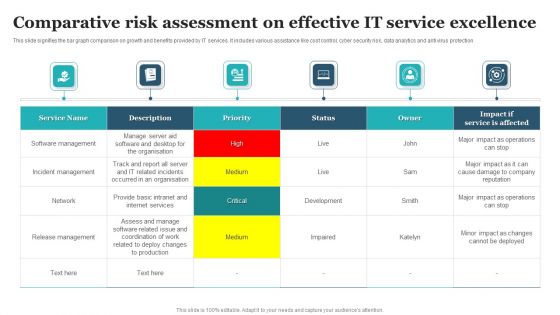
Comparative Risk Assessment On Effective IT Service Excellence Designs PDF
This slide signifies the bar graph comparison on growth and benefits provided by IT services. It includes various assistance like cost control, cyber security risk, data analytics and anti virus protection. Showcasing this set of slides titled Comparative Risk Assessment On Effective IT Service Excellence Designs PDF. The topics addressed in these templates are Software Management, Incident Management, Release Management. All the content presented in this PPT design is completely editable. Download it and make adjustments in color, background, font etc. as per your unique business setting.
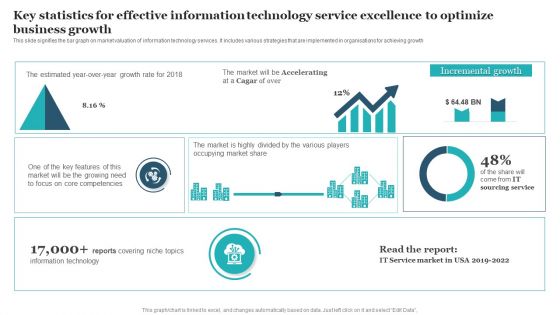
Key Statistics For Effective Information Technology Service Excellence To Optimize Business Growth Guidelines PDF
This slide signifies the bar graph on market valuation of information technology services. It includes various strategies that are implemented in organisations for achieving growth. Showcasing this set of slides titled Key Statistics For Effective Information Technology Service Excellence To Optimize Business Growth Guidelines PDF. The topics addressed in these templates are Key Statistics Effective, Information Technology Service, Excellence Optimize Business Growth. All the content presented in this PPT design is completely editable. Download it and make adjustments in color, background, font etc. as per your unique business setting.
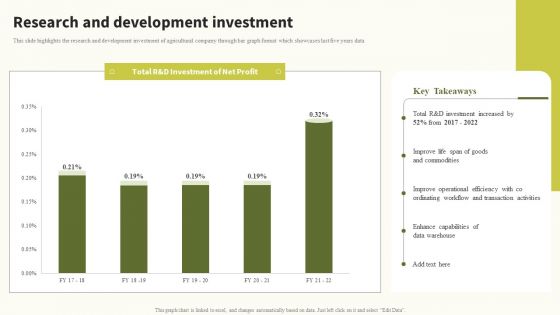
Research And Development Investment Global Food Products Company Profile Information PDF
This slide highlights the research and development investment of agricultural company through bar graph format which showcases last five years data. From laying roadmaps to briefing everything in detail, our templates are perfect for you. You can set the stage with your presentation slides. All you have to do is download these easy-to-edit and customizable templates. Research And Development Investment Global Food Products Company Profile Information PDF will help you deliver an outstanding performance that everyone would remember and praise you for. Do download this presentation today.
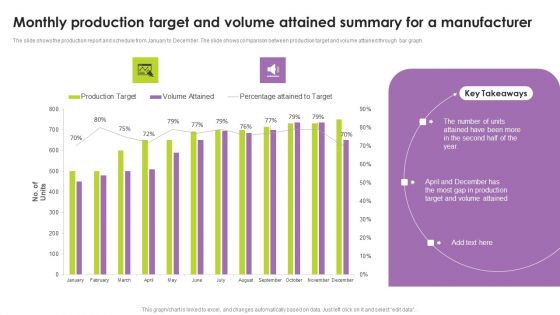
Monthly Production Target And Volume Attained Summary For A Manufacturer Portrait PDF
The slide shows the production report and schedule from January to December. The slide shows comparison between production target and volume attained through bar graph. Pitch your topic with ease and precision using this Monthly Production Target And Volume Attained Summary For A Manufacturer Portrait PDF. This layout presents information on Monthly Production Target, Volume Attained Summary, Manufacturer. It is also available for immediate download and adjustment. So, changes can be made in the color, design, graphics or any other component to create a unique layout.
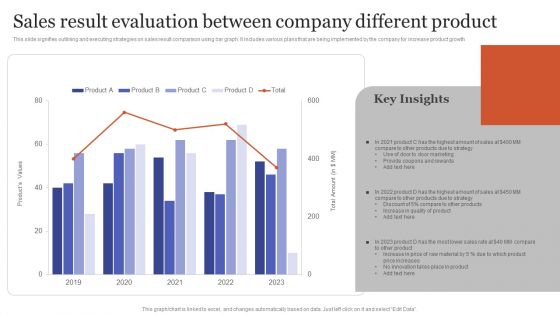
Sales Result Evaluation Between Company Different Product Microsoft PDF
This slide signifies outlining and executing strategies on sales result comparison using bar graph. It includes various plans that are being implemented by the company for increase product growth. Showcasing this set of slides titled Sales Result Evaluation Between Company Different Product Microsoft PDF. The topics addressed in these templates are Door Marketing, Provide Coupons Rewards, Increase Quality Product. All the content presented in this PPT design is completely editable. Download it and make adjustments in color, background, font etc. as per your unique business setting.
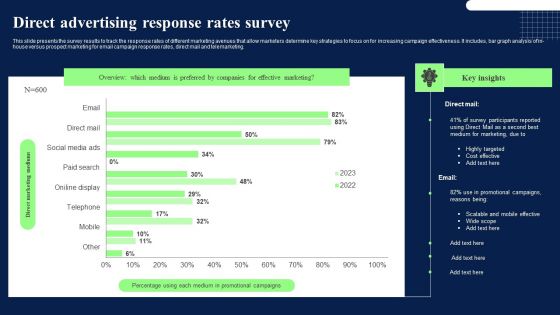
Direct Advertising Response Rates Survey Microsoft PDF
This slide presents the survey results to track the response rates of different marketing avenues that allow marketers determine key strategies to focus on for increasing campaign effectiveness. It includes, bar graph analysis of in house versus prospect marketing for email campaign response rates, direct mail and telemarketing. Showcasing this set of slides titled Direct Advertising Response Rates Survey Microsoft PDF. The topics addressed in these templates are Direct Marketing, Direct Advertising, Response Rates. All the content presented in this PPT design is completely editable. Download it and make adjustments in color, background, font etc. as per your unique business setting.
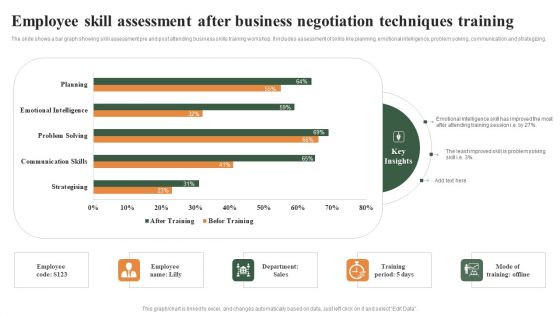
Employee Skill Assessment After Business Negotiation Techniques Training Elements PDF
The slide shows a bar graph showing skill assessment pre and post attending business skills training workshop. It includes assessment of skills like planning, emotional intelligence, problem solving, communication and strategizing. Showcasing this set of slides titled Employee Skill Assessment After Business Negotiation Techniques Training Elements PDF. The topics addressed in these templates are Employee, Emotional Intelligence, Attending Training Session. All the content presented in this PPT design is completely editable. Download it and make adjustments in color, background, font etc. as per your unique business setting.

Annual Customer Online Browsing Trends Ideas PDF
The following slide shows bar graph depicting the online browsing trends for the past year. It is categorized on the basis of different consumer generations such as gen. Z, millennial, gen. X ,boomer etc. Showcasing this set of slides titled Annual Customer Online Browsing Trends Ideas PDF. The topics addressed in these templates are Online Browsing, Millennial Spent, Possible Reasons. All the content presented in this PPT design is completely editable. Download it and make adjustments in color, background, font etc. as per your unique business setting.
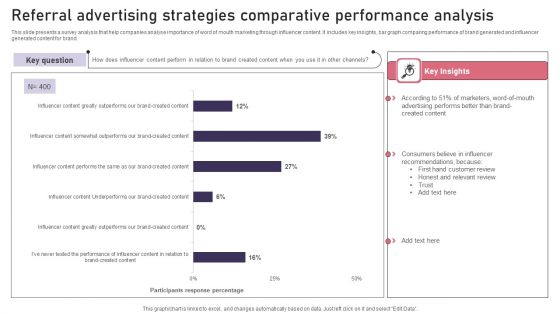
Referral Advertising Strategies Comparative Performance Analysis Diagrams PDF
This slide presents a survey analysis that help companies analyse importance of word of mouth marketing through influencer content. It includes key insights, bar graph comparing performance of brand generated and influencer generated content for brand. Showcasing this set of slides titled Referral Advertising Strategies Comparative Performance Analysis Diagrams PDF. The topics addressed in these templates are Referral Advertising, Strategies Comparative, Performance Analysis. All the content presented in this PPT design is completely editable. Download it and make adjustments in color, background, font etc. as per your unique business setting.

Employee Expenses Of Employee Attrition At Different Pay Levels Formats PDF
This slide present a bar graph showcasing employee turnover cost pay levels from various industries that enables to analyse true cost of employee turnover rates and replacing cost of employees . It includes aspects such as key insights, graph, overview, etc. Showcasing this set of slides titled Employee Expenses Of Employee Attrition At Different Pay Levels Formats PDF. The topics addressed in these templates are Cost To Businesses, Average, Employee. All the content presented in this PPT design is completely editable. Download it and make adjustments in color, background, font etc. as per your unique business setting.
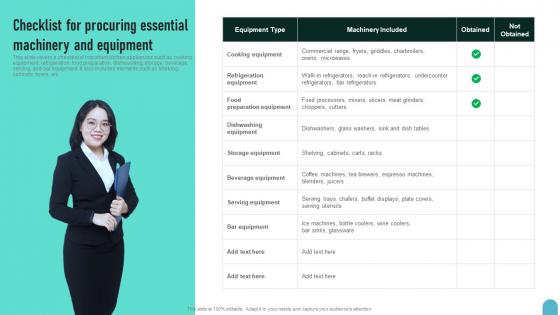
Checklist For Procuring Essential Enhancing Global Presence Guidelines Pdf
This slide covers a checklist of important kitchen appliances such as cooking equipment, refrigeration, food preparation, dishwashing, storage, beverage, serving, and bar equipment. It also includes elements such as shelving, cabinets, fryers, etc.Slidegeeks is one of the best resources for PowerPoint templates. You can download easily and regulate Checklist For Procuring Essential Enhancing Global Presence Guidelines Pdf for your personal presentations from our wonderful collection. A few clicks is all it takes to discover and get the most relevant and appropriate templates. Use our Templates to add a unique zing and appeal to your presentation and meetings. All the slides are easy to edit and you can use them even for advertisement purposes.
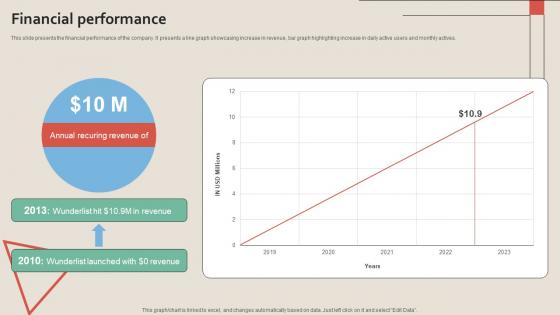
Financial Performance Work Management Tool Pitch Deck
This slide presents the financial performance of the company. It presents a line graph showcasing increase in revenue, bar graph highlighting increase in daily active users and monthly actives.Present like a pro with Financial Performance Work Management Tool Pitch Deck. Create beautiful presentations together with your team, using our easy-to-use presentation slides. Share your ideas in real-time and make changes on the fly by downloading our templates. So whether you are in the office, on the go, or in a remote location, you can stay in sync with your team and present your ideas with confidence. With Slidegeeks presentation got a whole lot easier. Grab these presentations today.

Statistical Data Analysis Process Data Description Ppt Example
This slide discusses the data description phase of statistical analysis, which includes methods such as scatter plot, bar chart, frequency distribution, etc. This slide also outlines the different types of skewed distribution techniques. Create an editable Statistical Data Analysis Process Data Description Ppt Example that communicates your idea and engages your audience. Whether you are presenting a business or an educational presentation, pre-designed presentation templates help save time. Statistical Data Analysis Process Data Description Ppt Example is highly customizable and very easy to edit, covering many different styles from creative to business presentations. Slidegeeks has creative team members who have crafted amazing templates. So, go and get them without any delay.
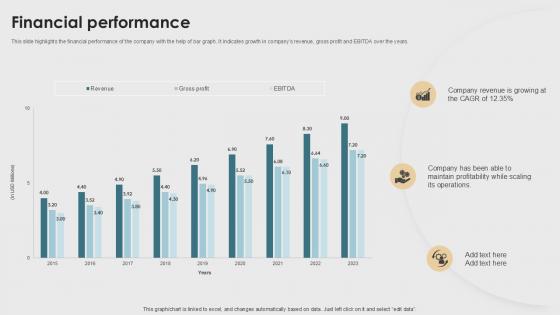
Financial Performance Property Listings Platform Pitch Deck PPT Sample
This slide highlights the financial performance of the company with the help of bar graph. It indicates growth in companys revenue, gross profit and EBITDA over the years. Present like a pro with Financial Performance Property Listings Platform Pitch Deck PPT Sample. Create beautiful presentations together with your team, using our easy to use presentation slides. Share your ideas in real time and make changes on the fly by downloading our templates. So whether you are in the office, on the go, or in a remote location, you can stay in sync with your team and present your ideas with confidence. With Slidegeeks presentation got a whole lot easier. Grab these presentations today.

Financial Performance Land And Property Marketplace Pitch Deck PPT Sample
This slide highlights the financial performance of the company with the help of bar graph. It indicates growth in companys revenue, gross profit and EBITDA over the years. Present like a pro with Financial Performance Land And Property Marketplace Pitch Deck PPT Sample. Create beautiful presentations together with your team, using our easy-to-use presentation slides. Share your ideas in real-time and make changes on the fly by downloading our templates. So whether you are in the office, on the go, or in a remote location, you can stay in sync with your team and present your ideas with confidence. With Slidegeeks presentation got a whole lot easier. Grab these presentations today.

Converging Arrows Poiting To Center Relative Circular Process PowerPoint Templates
We present our converging arrows poiting to center Relative Circular Process PowerPoint templates.Download and present our Arrows PowerPoint Templates because It will Raise the bar of your Thoughts. They are programmed to take you to the next level. Use our Process and Flows PowerPoint Templates because this slide helps you to give your team an overview of your capability and insight into the minute details of the overall picture highlighting the interdependence at every operational level. Download and present our Flow Charts PowerPoint Templates because you have the ability to think out of the box. It helps you maintain your unique identity. Use our Circle Charts PowerPoint Templates because Our PowerPoint Templates and Slides will give you great value for your money. Be assured of finding the best projection to highlight your words. Use our Marketing PowerPoint Templates because clarity of thought has been the key to your growth.Use these PowerPoint slides for presentations relating to Arrow, blue, business, chart,check, circle, concept, control, cycle,design, development, diagram, do,engineering, evaluate, flow, flowchart,flowchart, graphic, idea,infographic, iterative, lifecycle, lifecycle,management, marble, method, model, plandocheckact, process,quality, red, research, schema, software,spiral, step, strategy, success, system,. The prominent colors used in the PowerPoint template are Yellow, Black, White. Use our converging arrows poiting to center Relative Circular Process PowerPoint templates will make the presenter look like a pro even if they are not computer savvy. Professionals tell us our check PowerPoint templates and PPT Slides are Wonderful. Customers tell us our converging arrows poiting to center Relative Circular Process PowerPoint templates are Elevated. Presenters tell us our concept PowerPoint templates and PPT Slides are Swanky. You can be sure our converging arrows poiting to center Relative Circular Process PowerPoint templates are Great. PowerPoint presentation experts tell us our check PowerPoint templates and PPT Slides are Nostalgic.
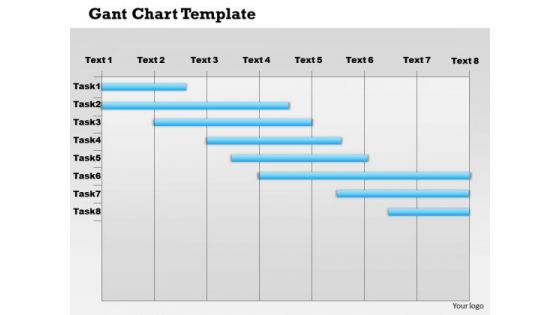
Business Framework Gantt Chart PowerPoint Presentation
A Gantt chart is a type of bar chart, that illustrates a project schedule. Gantt charts illustrate the start and finish dates of the terminal elements and summary elements of a project. Terminal elements and summary elements comprise the work breakdown structure of the project. Use this image slide to depict project management in your presentations.

Business Framework Kotter Change Management Model PowerPoint Presentation
This business diagram displays Kotters change management model. This slide depicts eight bars in increasing order. This model illustrates Kotters concepts of change management like creating climate for change, engaging and enabling the whole organization, Implementing and sustaining the change. Download this diagram to make professional presentations.

Business Diagram Magnifier With Ribbon Style Text Boxes Presentation Template
This business diagram has been designed with magnifier on five bar style text boxes. This diagram provides an effective way of displaying information you can edit text, color, shade and style as per you need. Present your views using this innovative slide and be assured of leaving a lasting impression

Manufacturing Productivity Analysis Bar Graph Introduction PDF
This slide illustrates the productivity chart of manufacturing of a company. It includes quantity produced in million units against the time period. Pitch your topic with ease and precision using this Manufacturing Productivity Analysis Bar Graph Introduction PDF. This layout presents information on Manufacturing Productivity, Production Decreased, Closure Of Companies. It is also available for immediate download and adjustment. So, changes can be made in the color, design, graphics or any other component to create a unique layout.
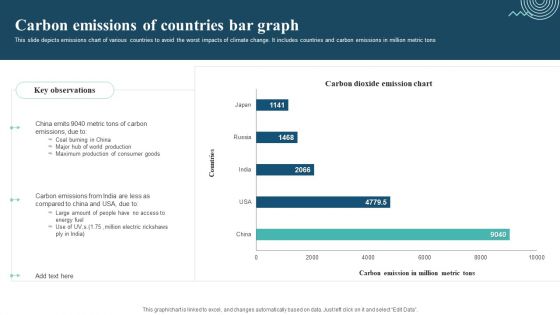
Carbon Emissions Of Countries Bar Graph Professional PDF
This slide depicts emissions chart of various countries to avoid the worst impacts of climate change. It includes countries and carbon emissions in million metric tons. Pitch your topic with ease and precision using this Carbon Emissions Of Countries Bar Graph Professional PDF. This layout presents information on Maximum Production, Consumer Goods, Carbon Emissions. It is also available for immediate download and adjustment. So, changes can be made in the color, design, graphics or any other component to create a unique layout.
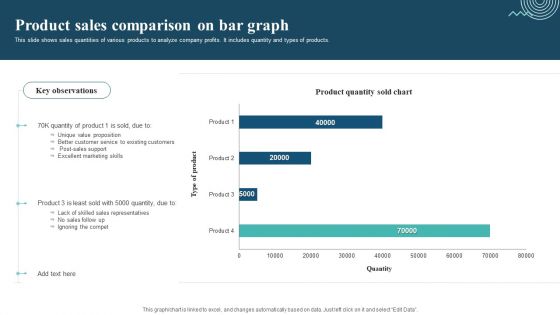
Product Sales Comparison On Bar Graph Sample PDF
This slide shows sales quantities of various products to analyze company profits. It includes quantity and types of products. Pitch your topic with ease and precision using this Product Sales Comparison On Bar Graph Sample PDF. This layout presents information on Unique Value Proposition, Excellent Marketing Skills, Ignoring The Compet. It is also available for immediate download and adjustment. So, changes can be made in the color, design, graphics or any other component to create a unique layout.
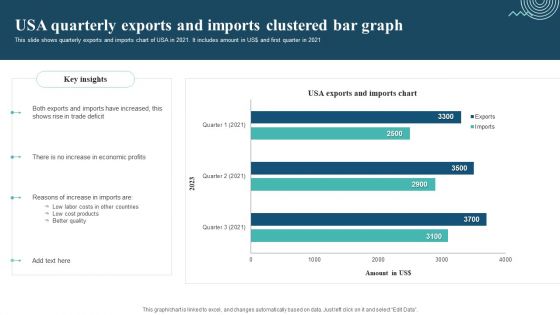
Usa Quarterly Exports And Imports Clustered Bar Graph Designs PDF
This slide shows quarterly exports and imports chart of USA in 2021. It includes amount in US dollar and first quarter in 2021. Pitch your topic with ease and precision using this Usa Quarterly Exports And Imports Clustered Bar Graph Designs PDF. This layout presents information on Exports And Imports, Trade Deficit, Economic Profits. It is also available for immediate download and adjustment. So, changes can be made in the color, design, graphics or any other component to create a unique layout.

On Same Issue Business PowerPoint Theme Start Up Plan Template Templates
We present our on same issue business powerpoint theme start up plan template templates.Download and present our Business PowerPoint Templates because you have had a great year or so business wise. It is time to celebrate the efforts of your team. Use our Shapes PowerPoint Templates because you will be able to Highlight your ideas broad-based on strong fundamentals and illustrate how they step by step acheive the set growth factor. Use our Process and Flows PowerPoint Templates because this slide helps you to give your team an overview of your capability and insight into the minute details of the overall picture highlighting the interdependence at every operational level. Present our Triangles PowerPoint Templates because using this Ideas will roll along in your mind like billiard balls. Download and present our Flow Charts PowerPoint Templates because it unravels each one for your audience while setting key timelines as you go along.Use these PowerPoint slides for presentations relating to Arrows, Badge, Balloon, Bar, Blank, Blue, Bright, Bubbles, Buttons, Circle, Color, Cross, Design, Designs, Drop, Elements, Glossy, Glowing, Graphic, Hexagon, Icon, Illustration, Navigation, Round, Seals, Set, Shadow, Shapes, Shiny, Sign, Speech, Squares, Stars, Stickers, Symbol. The prominent colors used in the PowerPoint template are Blue, Gray, White. We assure you our on same issue business powerpoint theme start up plan template templates are Appealing. We assure you our Balloon PowerPoint templates and PPT Slides are Cheerful. Customers tell us our on same issue business powerpoint theme start up plan template templates are Versatile. Presenters tell us our Bar PowerPoint templates and PPT Slides are Functional. You can be sure our on same issue business powerpoint theme start up plan template templates are Radiant. The feedback we get is that our Bubbles PowerPoint templates and PPT Slides are Functional.
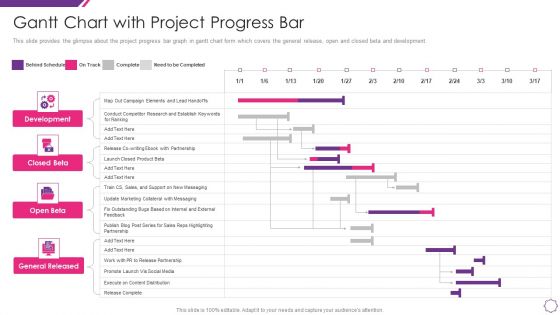
Handle Project Escalations Gantt Chart With Project Progress Bar Ppt Layouts Graphics Design PDF
This slide provides the glimpse about the project progress bar graph in gantt chart form which covers the general release, open and closed beta and development. Introducing our handle project escalations gantt chart with project progress bar ppt layouts graphics design pdf that is designed to showcase some of the vital components that will help you create timelines, roadmaps, and project plans. In addition, also communicate your project durations, milestones, tasks, subtasks, dependencies, and other attributes using this well structured handle project escalations gantt chart with project progress bar ppt layouts graphics design pdf template. You can also exhibit preeminence against time by deploying this easily adaptable slide to your business presentation. Our experts have designed this template in such a way that it is sure to impress your audience. Thus, download it and steer your project meetings, meetups, and conferences.
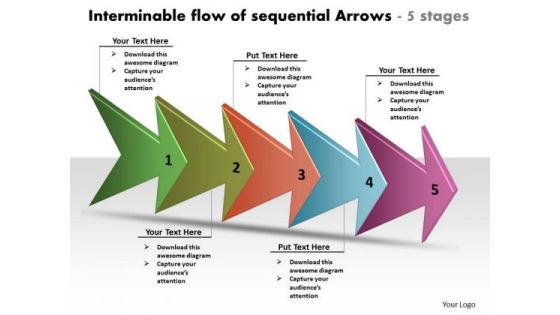
Interminable Flow Of Sequential Arrows 5 Stages Process Chart Template PowerPoint Templates
We present our interminable flow of sequential arrows 5 stages process chart template PowerPoint templates.Use our Arrows PowerPoint Templates because,This slide helps you to give your team an overview of your capability and insight into the minute details of the overall picture highlighting the interdependence at every operational level. Use our Shapes PowerPoint Templates because, This can explain the various related aspects of these varied tracks and how they will, on hitting their own targets, cumulatively contribute to hitting GOLD. Use our Signs PowerPoint Templates because, This will helps you to explore the minutest detail of each concept and follow the trail to its conclusion. Use our Business PowerPoint Templates because,It helps you to explain your plans in all earnest to your colleagues and raise the bar for all. Use our Process and Flows PowerPoint Templates because,You can Educate your listeners on the means to keep it ticking over.Use these PowerPoint slides for presentations relating to Algorithm, arrow, arrows, block, business, chart, connection, design, development, diagram, direction, element, flow, flowchart, graph, kind, linear, management, of, organization, process, program, section, segment, set, sign, solution, strategy, symbol. The prominent colors used in the PowerPoint template are Pink, Blue, Orange. People tell us our interminable flow of sequential arrows 5 stages process chart template PowerPoint templates are Magical. The feedback we get is that our connection PowerPoint templates and PPT Slides are Fun. People tell us our interminable flow of sequential arrows 5 stages process chart template PowerPoint templates are readymade to fit into any presentation structure. Presenters tell us our design PowerPoint templates and PPT Slides are Splendid. The feedback we get is that our interminable flow of sequential arrows 5 stages process chart template PowerPoint templates are designed by professionals Professionals tell us our arrows PowerPoint templates and PPT Slides are the best it can get when it comes to presenting.
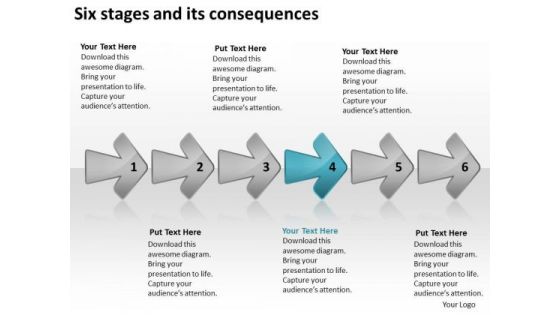
Six Stages And Its Consequences Business Plan Writing Software PowerPoint Templates
We present our six stages and its consequences business plan writing software PowerPoint templates.Download and present our Marketing PowerPoint Templates because this slide illustrates your thoughts and experiences to your staff. Use our Flow charts PowerPoint Templates because a lot of hard work has gone in and you are almost there. Present our Business PowerPoint Templates because it helps you to explain your plans in all earnest to your colleagues and raise the bar for all. Download and present our Arrows PowerPoint Templates because it will demonstrate the strength of character under severe stress. Shine the torch ahead and bring the light to shine on all. Present our Shapes PowerPoint Templates because the Venn graphic comprising interlinking circles geometrically demonstate how various functions operating independantly, to a large extent, are essentially interdependant.Use these PowerPoint slides for presentations relating to Arrows, blank, business, chart, circular, circulation, concept, conceptual design, diagram, empty, executive, icon, idea, illustration, management, map mapping, model, numbers, organization, procedure, process, progression, resource sequence, sequential, seven, stages. The prominent colors used in the PowerPoint template are Blue, Gray, White. We assure you our six stages and its consequences business plan writing software PowerPoint templates will save the presenter time. Use our circulation PowerPoint templates and PPT Slides are Radiant. Use our six stages and its consequences business plan writing software PowerPoint templates are Zippy. Professionals tell us our circular PowerPoint templates and PPT Slides are Ritzy. Professionals tell us our six stages and its consequences business plan writing software PowerPoint templates are Tranquil. People tell us our circulation PowerPoint templates and PPT Slides are Stylish.

Converging And Diverging Factors Process Flow Ppt Target Chart PowerPoint Templates
We present our converging and diverging factors process flow ppt Target Chart PowerPoint templates.Use our Business PowerPoint Templates because it helps you to explain your plans in all earnest to your colleagues and raise the bar for all. Use our Process and Flows PowerPoint Templates because they will Amplify your thoughts via our appropriate templates. Download and present our Marketing PowerPoint Templates because networking is an imperative in todays world. You need to access the views of others. Similarly you need to give access to them of your abilities. Download and present our Circle Charts PowerPoint Templates because this PPt slide highlights any anticipated problems, shortfalls or weak areas. Download and present our Flow Charts PowerPoint Templates because you can illustrate your ideas and imprint them in the minds of your team with this template.Use these PowerPoint slides for presentations relating to Achievement, Aim, Arrow, Business, Chart, Communication, Diagram, Direction, Graphic, Growth, Guide, Increase, Marketing, Presentation, Shape, Sign, Success, Target, Team, Teamwork. The prominent colors used in the PowerPoint template are Red, Gray, White. People tell us our converging and diverging factors process flow ppt Target Chart PowerPoint templates are No-nonsense. Use our Arrow PowerPoint templates and PPT Slides provide you with a vast range of viable options. Select the appropriate ones and just fill in your text. Professionals tell us our converging and diverging factors process flow ppt Target Chart PowerPoint templates are Fabulous. Presenters tell us our Graphic PowerPoint templates and PPT Slides are Bold. Professionals tell us our converging and diverging factors process flow ppt Target Chart PowerPoint templates are Exuberant. PowerPoint presentation experts tell us our Arrow PowerPoint templates and PPT Slides will make the presenter look like a pro even if they are not computer savvy.
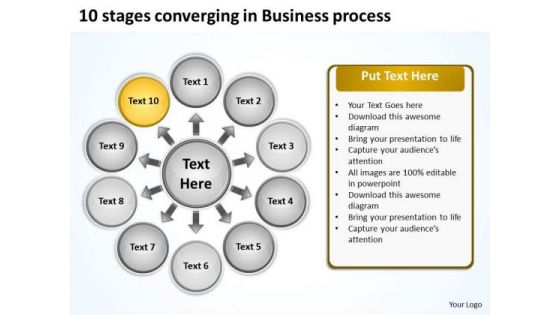
PowerPoint Templates Free Download Process Circular Flow Diagram
We present our powerpoint templates free download process Circular Flow Diagram.Download our Ring charts PowerPoint Templates because you must Evolve the strategy to take you down the required path with appropriate, efficient and effective marketing along the way. Download and present our Circle charts PowerPoint Templates because this slide Probe the minds of your colleagues, see their faces light up as they assimilate and understand the value of your suggestions. Download and present our Business PowerPoint Templates because it helps you to explain your plans in all earnest to your colleagues and raise the bar for all. Present our Process and Flows PowerPoint Templates because you know that the core of any organisation is the people who work for it. Use our Marketing PowerPoint Templates because networking is an imperative in todays world. You need to access the views of others. Similarly you need to give access to them of your abilities.Use these PowerPoint slides for presentations relating to Arrowheads, cerulean, circle, circulation, cobalt,colorful, cyan, cycle, element,emblem, grayshadow, green,icon, indicator, interface, internet, label,link, load, marker, motion, movement,navigationpanel, next, orientation, pagsite, pink, pointer, previous, process, reload, rotation, satined, sign, signpost,smooth, sticker, sticky, symbol. The prominent colors used in the PowerPoint template are Yellow, Orange, Gray. Customers tell us our powerpoint templates free download process Circular Flow Diagram are Ultra. We assure you our cobalt PowerPoint templates and PPT Slides are Magical. PowerPoint presentation experts tell us our powerpoint templates free download process Circular Flow Diagram are Awesome. People tell us our cyan PowerPoint templates and PPT Slides are Nice. We assure you our powerpoint templates free download process Circular Flow Diagram are Tasteful. Use our cobalt PowerPoint templates and PPT Slides are Efficient.
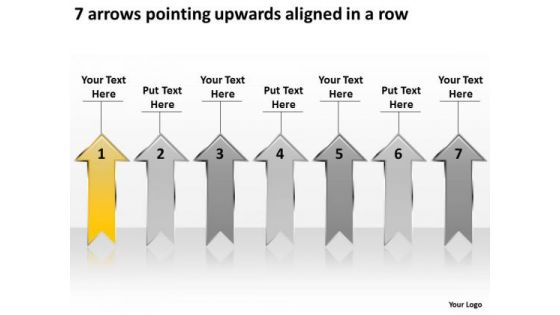
7 Arrows Pointing Upwards Aligned Ppt New Business Plan Template PowerPoint Templates
We present our 7 arrows pointing upwards aligned ppt new business plan template PowerPoint templates.Use our Arrows PowerPoint Templates because this will helps you to explore the minutest detail of each concept and follow the trail to its conclusion. Download and present our Shapes PowerPoint Templates because you will be able to Highlight your ideas broad-based on strong fundamentals and illustrate how they step by step acheive the set growth factor. Use our Metaphors-Visual Concepts PowerPoint Templates because this slide can help to bullet point your views. Download our Signs PowerPoint Templates because you can Determine your targets and sequence them as per your priorities. Download and present our Business PowerPoint Templates because maximising sales of your product is the intended destination.Use these PowerPoint slides for presentations relating to 3d, abstract, accounting, arrow, background, bank, bar, benefit, business, calculation, capital, chart, company, connection, corporate, data, design, diagram, directive, earnings, economy, enterprise, finance, forecast, graph, growth, illustration, income, increase, information, interest, internet, investment, investor, management, market, measure, network, office, perspective, plan, price, profit, progress, rise, statistics, technology, vector, wealth, world. The prominent colors used in the PowerPoint template are Yellow, Gray, Black. People tell us our 7 arrows pointing upwards aligned ppt new business plan template PowerPoint templates are Precious. Use our accounting PowerPoint templates and PPT Slides are Efficient. Use our 7 arrows pointing upwards aligned ppt new business plan template PowerPoint templates are Romantic. PowerPoint presentation experts tell us our background PowerPoint templates and PPT Slides are Colorful. People tell us our 7 arrows pointing upwards aligned ppt new business plan template PowerPoint templates are One-of-a-kind. Customers tell us our business PowerPoint templates and PPT Slides are Attractive.

Wine Lounge Business Plan Addressing Major Challenges Catered By Wine Bar Industry BP SS V
This slide portrays details about various challenges catered by the wine bar industry such as demographic shifts, economic conditions, consumer education, online competition, customer experience, health concerns, sustainability and social trends. Slidegeeks is one of the best resources for PowerPoint templates. You can download easily and regulate Wine Lounge Business Plan Addressing Major Challenges Catered By Wine Bar Industry BP SS V for your personal presentations from our wonderful collection. A few clicks is all it takes to discover and get the most relevant and appropriate templates. Use our Templates to add a unique zing and appeal to your presentation and meetings. All the slides are easy to edit and you can use them even for advertisement purposes.
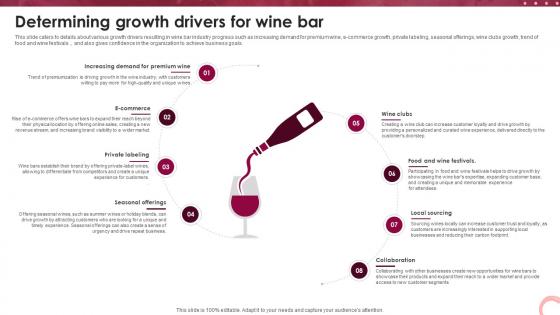
Wine Lounge Business Plan Determining Growth Drivers For Wine Bar BP SS V
This slide caters to details about various growth drivers resulting in wine bar industry progress such as increasing demand for premium wine, e-commerce growth, private labeling, seasonal offerings, wine clubs growth, trend of food and wine festivals, and also gives confidence in the organization to achieve business goals. If your project calls for a presentation, then Slidegeeks is your go-to partner because we have professionally designed, easy-to-edit templates that are perfect for any presentation. After downloading, you can easily edit Wine Lounge Business Plan Determining Growth Drivers For Wine Bar BP SS V and make the changes accordingly. You can rearrange slides or fill them with different images. Check out all the handy templates
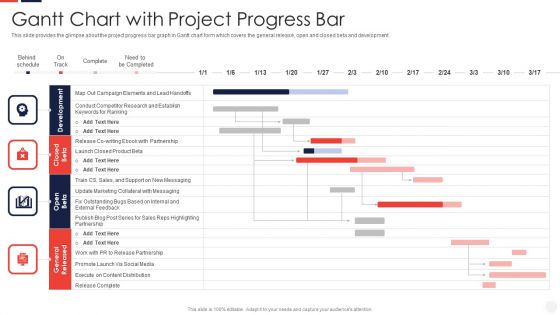
Escalation Administration System Gantt Chart With Project Progress Bar Download PDF
This slide provides the glimpse about the project progress bar graph in Gantt chart form which covers the general release, open and closed beta and development. Deliver an awe inspiring pitch with this creative escalation administration system gantt chart with project progress bar download pdf bundle. Topics like gantt chart with project progress bar can be discussed with this completely editable template. It is available for immediate download depending on the needs and requirements of the user.

How To Intensify Project Threats Gantt Chart With Project Progress Bar Elements PDF
This slide provides the glimpse about the project progress bar graph in gantt chart form which covers the general release, open and closed beta and development. Deliver an awe inspiring pitch with this creative how to intensify project threats gantt chart with project progress bar elements pdf bundle. Topics like development, closed beta, open beta, general released. can be discussed with this completely editable template. It is available for immediate download depending on the needs and requirements of the user.
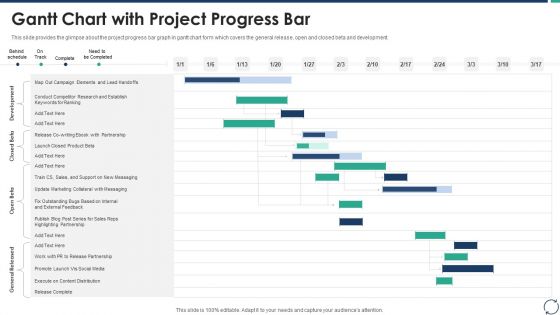
Escalation Steps For Projects Gantt Chart With Project Progress Bar Structure PDF
This slide provides the glimpse about the project progress bar graph in gantt chart form which covers the general release, open and closed beta and development. Deliver an awe inspiring pitch with this creative escalation steps for projects gantt chart with project progress bar structure pdf bundle. Topics like ed beta, development can be discussed with this completely editable template. It is available for immediate download depending on the needs and requirements of the user.

Cost Reduction Bar Graph For Organization Optimization Ppt Inspiration Vector PDF
This slide represent cost saving with benefits in an organization and areas where more efficiencies are utilized. It includes travel, administrative and hiring. Pitch your topic with ease and precision using this Cost Reduction Bar Graph For Organization Optimization Ppt Inspiration Vector PDF. This layout presents information on Total Cost Benefits, Promoting Employees, Providing Perks. It is also available for immediate download and adjustment. So, changes can be made in the color, design, graphics or any other component to create a unique layout.

PowerPoint Layouts Food Pyramid Image Ppt Design
PowerPoint Layouts Food Pyramid Image PPT Design-The Food Pyramid PPPT Slide is a graphic tool that you can use to convey important dietary guidance concepts of variety, proportion, and moderation.-Illustration, balanced, bar, bread, bun, butter, cake, calorie, calories, candy, carbohydrates, cereals, cheese, dairy, diet, egg, fats, fish, food, fresh, fruits, grains, guide, healthy, isolated, market, meat, nutritious, oil, outline, proteins, pyramid, shape, vector, vectors, vegetables-PowerPoint Layouts Food Pyramid Image PPT Design

Ppt Circle PowerPoint Presentation Plan Through Bubbles 4 Steps Templates
PPT circle powerpoint presentation plan through bubbles 4 steps Templates-Use this highlighted red Bubble Slide to explain a third step in business process. Process operations are represented by circle, and arrows connecting them represent flow of control.-PPT circle powerpoint presentation plan through bubbles 4 steps Templates-Add, Aqua, Arrows, Badges, Bar, Blend, Blue, Bright, Bubbles, Buttons, Caution, Circle, Drop, Elements, Glossy, Glowing, Graphic, Heart, Help, Icons, Idea, Illustration, Navigation, Oblong, Plus, Round, Service, Shadow, Shiny, Sign, Speech, Squares
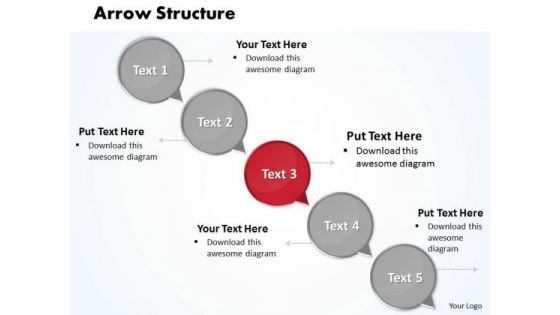
Ppt Circular Arrow Structure Of 5 Practice The PowerPoint Macro Steps Templates
PPT circular arrow structure of 5 practice the powerpoint macro steps Templates-Use this highlighted Red Bubble Slide to explain a third step in business process. Process operations are represented by circle, and arrows connecting them represent flow of control.-PPT circular arrow structure of 5 practice the powerpoint macro steps Templates-Add, Aqua, Arrows, Badges, Bar, Blend, Blue, Bright, Bubbles, Buttons, Caution, Circle, Drop, Elements, Glossy, Glowing, Graphic, Heart, Help, Icons, Idea, Illustration, Navigation, Oblong, Plus, Round, Service, Shadow, Shiny, Sign, Speech, Squares

Improving Current Organizational Logistic Process Receiving Real Time Information Infographics PDF
This slide covers the bar coded information which helps to check the detailed receiving and ensures that the inbound process is running smoothly. Deliver an awe inspiring pitch with this creative improving current organizational logistic process receiving real time information infographics pdf bundle. Topics like customers benefit, products, barcoding is specifically concatenation can be discussed with this completely editable template. It is available for immediate download depending on the needs and requirements of the user.

 Home
Home