Slider Scale

Stacked Bar Template 2 Ppt PowerPoint Presentation Slides Introduction
This is a stacked bar template 2 ppt powerpoint presentation slides introduction. This is a six stage process. The stages in this process are product, stacked bar, business, marketing, in years.

Bar Chart Ppt PowerPoint Presentation Slides Design Ideas
This is a bar chart ppt powerpoint presentation slides design ideas. This is a six stage process. The stages in this process are product, bar chart, sales in percentage.
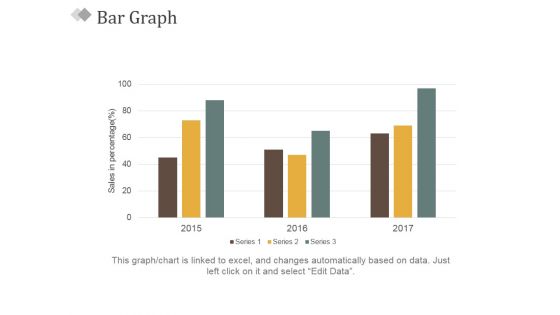
Bar Graph Ppt PowerPoint Presentation Slides Visual Aids
This is a bar graph ppt powerpoint presentation slides visual aids. This is a three stage process. The stages in this process are sales in percentage, bar graph, business, marketing, success.
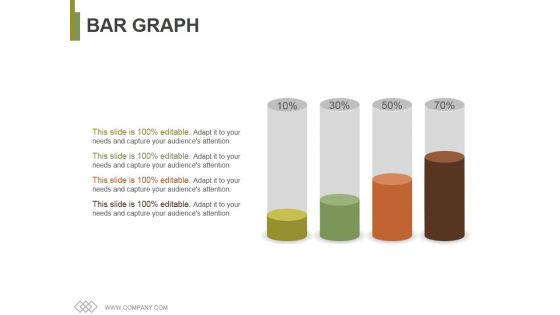
Bar Graph Ppt PowerPoint Presentation Pictures Slide Portrait
This is a bar graph ppt powerpoint presentation pictures slide portrait. This is a four stage process. The stages in this process are bar graph, growth, success, business, marketing.
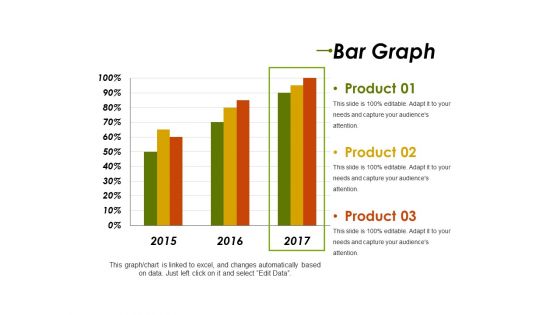
Bar Graph Template 1 Ppt PowerPoint Presentation Slides Format Ideas
This is a bar graph template 1 ppt powerpoint presentation slides format ideas. This is a three stage process. The stages in this process are product, years, bar graph, business, marketing.
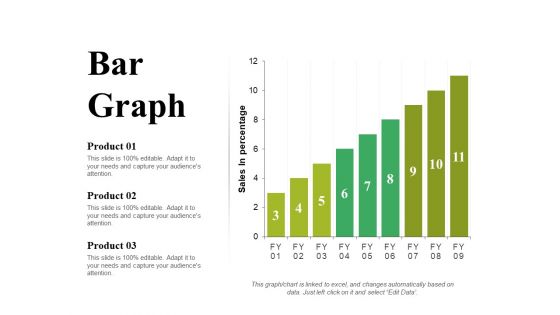
Bar Graph Ppt PowerPoint Presentation Portfolio Slide Portrait
This is a bar graph ppt powerpoint presentation portfolio slide portrait. This is a three stage process. The stages in this process are product, sales in percentage, bar graph, growth, success.
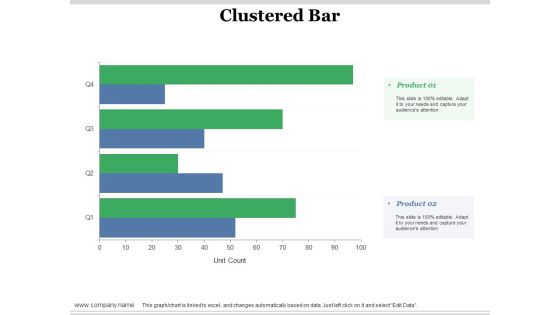
Clustered Bar Ppt PowerPoint Presentation Slides Example Topics
This is a clustered bar ppt powerpoint presentation slides example topics. This is a two stage process. The stages in this process are clustered bar, product, unit count, business, marketing.

Stacked Bar Ppt PowerPoint Presentation Slides Layout Ideas
This is a stacked bar ppt powerpoint presentation slides layout ideas. This is a two stage process. The stages in this process are stacked bar, product, percentage, finance, business.

Stacked Bar Ppt PowerPoint Presentation Inspiration Slide Download
This is a stacked bar ppt powerpoint presentation inspiration slide download. This is a two stage process. The stages in this process are stacked bar, finance, marketing, management, investment, analysis.
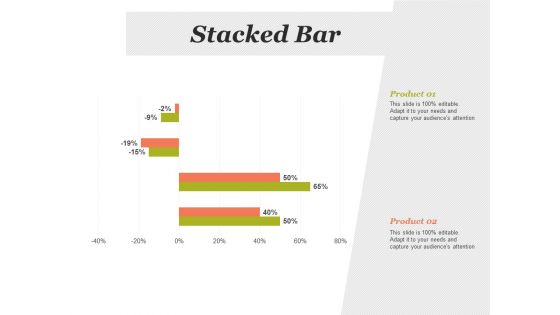
Stacked Bar Financial Analysis Ppt PowerPoint Presentation Infographic Template Slides
This is a stacked bar financial analysis ppt powerpoint presentation infographic template slides. This is a two stage process. The stages in this process are stacked bar, finance, marketing, strategy, analysis.

Staked Bar Capability Maturity Matrix Ppt PowerPoint Presentation Slides Outfit
This is a staked bar capability maturity matrix ppt powerpoint presentation slides outfit. This is a three stage process. The stages in this process are staked bar, product, year, finance, percentage.
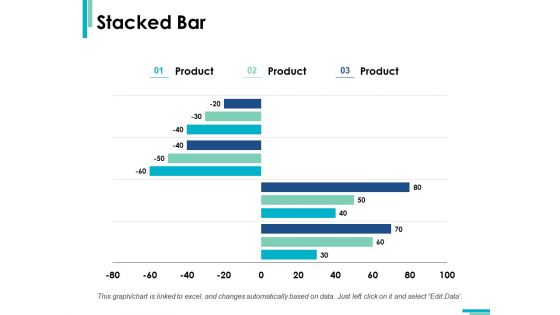
Stacked Bar Finance Marketing Ppt PowerPoint Presentation Summary Slide Download
This is a stacked bar finance marketing ppt powerpoint presentation summary slide download. This is a three stage process. The stages in this process are stacked bar, finance, marketing, analysis, investment.

Bar Chart Finance Marketing Ppt PowerPoint Presentation Portfolio Slide
This is a bar chart finance marketing ppt powerpoint presentation portfolio slide. This is a two stage process. The stages in this process are bar chart, finance, marketing, business, analysis.
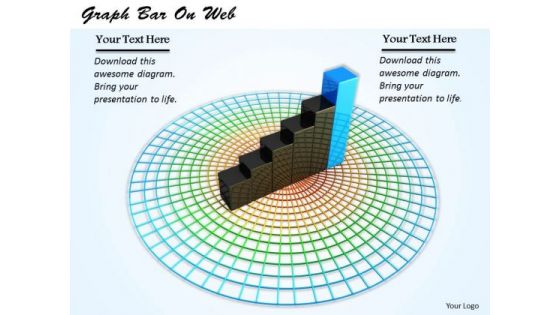
Stock Photo Bar Graph On Circular Web PowerPoint Slide
This image slide displays bar garph on circular web. This image slide helps you to make business and sales related presenations. Deliver amazing presentations to mesmerize your audience.
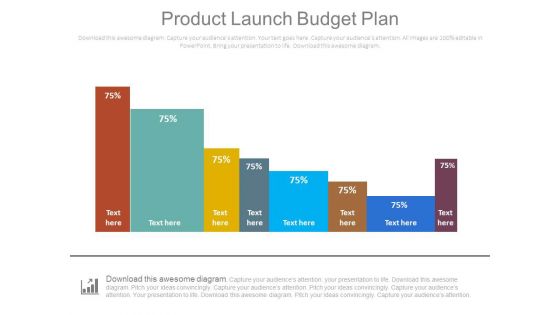
Product Launch Budget Plan Bar Graph Ppt Slides
This is a product launch budget plan bar graph ppt slides. This is a eight stage process. The stages in this process are business, finance, marketing.

Last 90 Days Results Bar Graph Ppt Slides
This is a last 90 days results bar graph ppt slides. This is a three stage process. The stages in this process are arrows, business, marketing.

Overall Revenue Analysis Bar Chart Powerpoint Slide Information
This is a overall revenue analysis bar chart powerpoint slide information. This is a nine stage process. The stages in this process are finance, success, business, marketing, percentage.
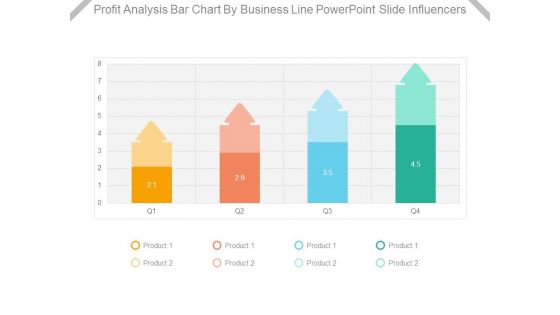
Profit Analysis Bar Chart By Business Line Powerpoint Slide Influencers
This is a profit analysis bar chart by business line powerpoint slide influencers. This is a four stage process. The stages in this process are product.

Competitive Environment Analysis Bar Graph Ppt Slide Templates
This is a competitive environment analysis bar graph ppt slide templates. This is a one stage process. The stages in this process are engagement, brand, monthly, weekly.
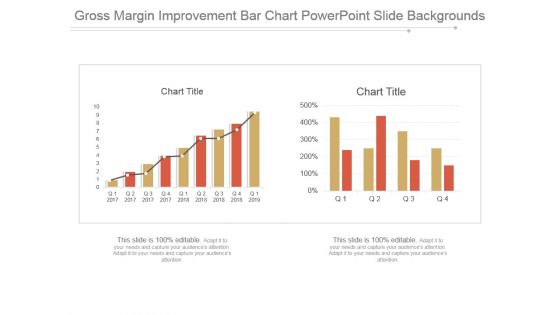
Gross Margin Improvement Bar Chart Powerpoint Slide Backgrounds
This is a gross margin improvement bar chart powerpoint slide backgrounds. This is a two stage process. The stages in this process are chart title.
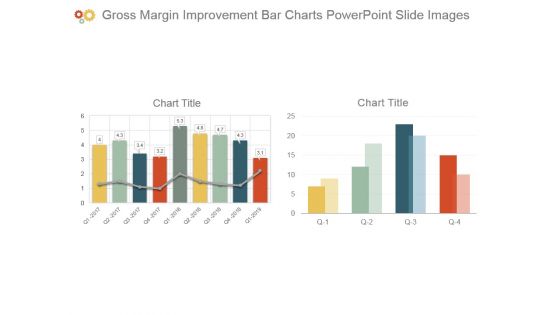
Gross Margin Improvement Bar Charts Powerpoint Slide Images
This is a gross margin improvement bar charts powerpoint slide images. This is a two stage process. The stages in this process are chart title.
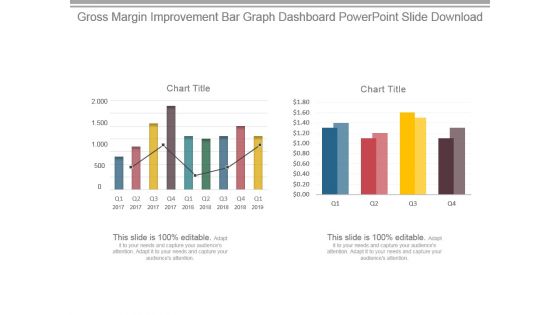
Gross Margin Improvement Bar Graph Dashboard Powerpoint Slide Download
This is a gross margin improvement bar graph dashboard powerpoint slide download. This is a two stage process. The stages in this process are chart title.
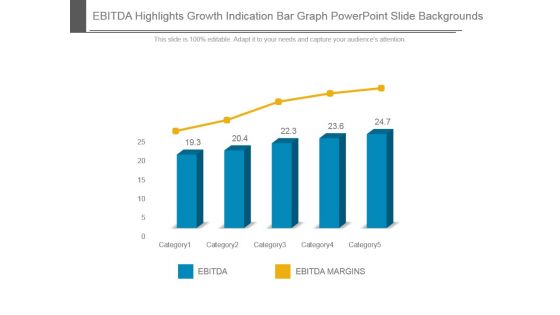
Ebitda Highlights Growth Indication Bar Graph Powerpoint Slide Backgrounds
This is a ebitda highlights growth indication bar graph powerpoint slide backgrounds. This is a five stage process. The stages in this process are ebitda, ebitda margins, category.
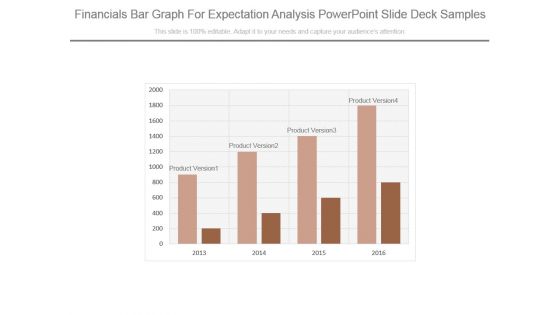
Financials Bar Graph For Expectation Analysis Powerpoint Slide Deck Samples
This is a financials bar graph for expectation analysis powerpoint slide deck samples. This is a four stage process. The stages in this process are product version.

Bar Graph Ppt PowerPoint Presentation Outline Slide Download
This is a bar graph ppt powerpoint presentation outline slide download. This is a four stage process. The stages in this process are business, marketing, finance, timeline, growth.

Bar Graph Ppt Powerpoint Presentation Slides Graphics Design
This is a bar graph ppt powerpoint presentation slides graphics design. This is a three stage process. The stages in this process are product, graph, marketing, finance.
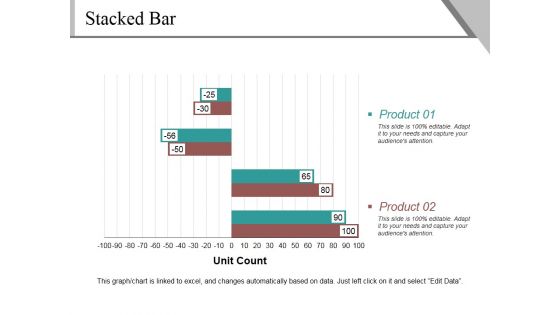
Stacked Bar Ppt PowerPoint Presentation Outline Slide Portrait
This is a stacked bar ppt powerpoint presentation outline slide portrait. This is a two stage process. The stages in this process are product, unit count, business, marketing.
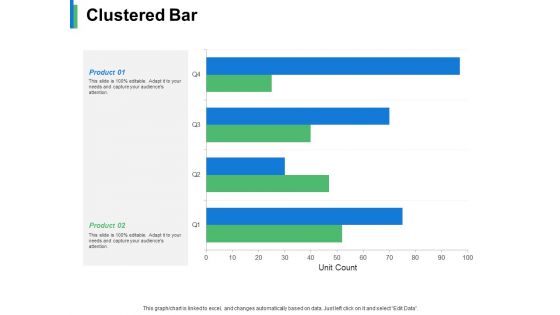
Clustered Bar Product Ppt PowerPoint Presentation Slides Examples
This is a clustered bar product ppt powerpoint presentation slides examples. This is a two stage process. The stages in this process are business, management, strategy, marketing, sales.
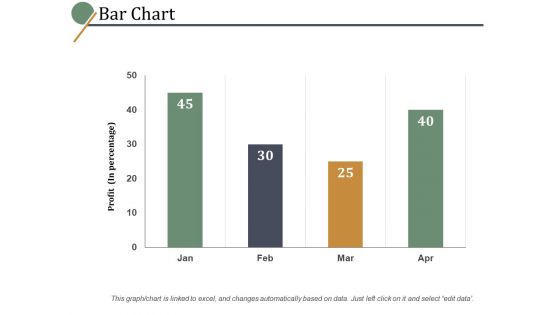
Bar Chart Slide Ppt PowerPoint Presentation Summary Example File
This is a bar chart slide ppt powerpoint presentation summary example file. This is a three stage process. The stages in this process are percentage, marketing, management, product.
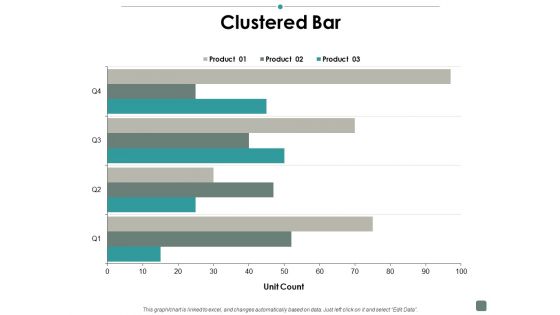
Clustered Bar Contribution Ppt PowerPoint Presentation Slides Example
This is a clustered bar contribution ppt powerpoint presentation slides example. This is a three stage process. The stages in this process are finance, business, management, strategy, analysis.
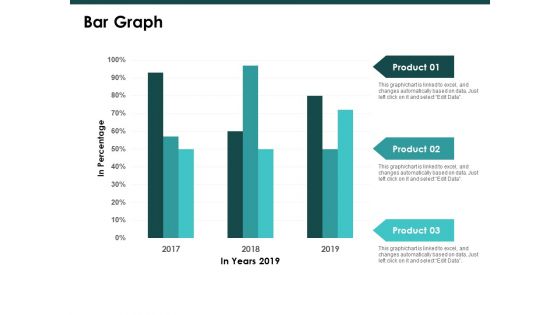
Bar Graph Finance Ppt PowerPoint Presentation Styles Slide
This is a bar graph finance ppt powerpoint presentation styles slide. This is a three stage process. The stages in this process are finance, marketing, management, investment, analysis.
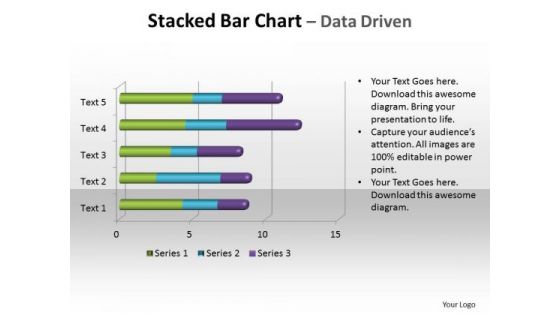
Business Graphic PowerPoint Templates Business Stacked Bar Chart Ppt Slides
Business Graphic PowerPoint Templates Business stacked bar chart PPT Slides-You can use a 100% stacked column chart when you have three or more data series and you want to emphasize the contributions to the whole, especially if the total is the same for each category. . -Business Graphic PowerPoint Templates Business stacked bar chart PPT Slides-This ppt can be used for concepts relating to-Bar, Block, Business, Chart, Color, Colour, Column, Decline, Fill, Finance, Financial, Graph etc.

Stock Photo Bar Graph With Grid PowerPoint Slide
This image slide displays bar graph with grid. This image has been designed with graphic of 3d multicolor bar graph. Use this image slide, in your presentations to express views on finance, growth and success. This image slide may also be used to exhibit any information which requires visual presentation in your presentations. This image slide will enhance the quality of your presentations.
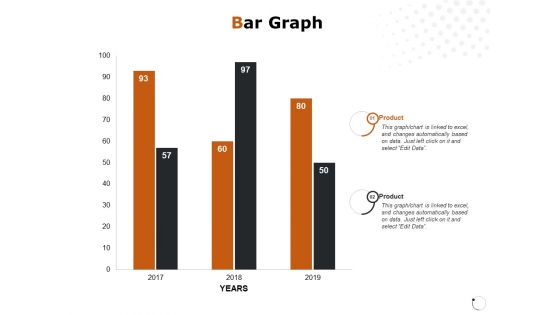
Bar Graph Financial Ppt PowerPoint Presentation Professional Master Slide
Presenting this set of slides with name bar graph financial ppt powerpoint presentation professional master slide. The topics discussed in these slides are bar graph, product, year, finance, marketing. This is a completely editable PowerPoint presentation and is available for immediate download. Download now and impress your audience.

Clustered Bar Analysis Ppt Powerpoint Presentation Slides Layout Ideas
Presenting this set of slides with name clustered bar analysis ppt powerpoint presentation slides layout ideas. The topics discussed in these slides are clustered bar, finance, marketing, investment, analysis. This is a completely editable PowerPoint presentation and is available for immediate download. Download now and impress your audience.
Number Bar Vector Icon Ppt Powerpoint Presentation Slides Diagrams
Presenting this set of slides with name number bar vector icon ppt powerpoint presentation slides diagrams. The topics discussed in these slides are number icon, mathematical, number bar vector. This is a completely editable PowerPoint presentation and is available for immediate download. Download now and impress your audience.
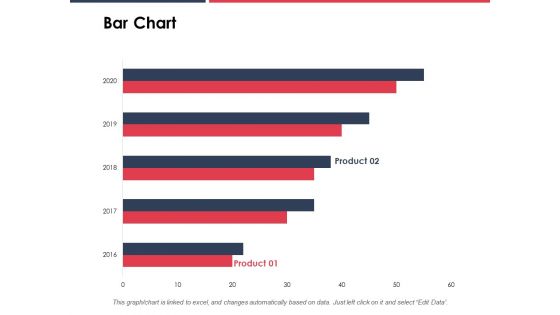
Bar Chart Analysis Ppt PowerPoint Presentation Summary Slides
Presenting this set of slides with name bar chart analysis ppt powerpoint presentation summary slides. The topics discussed in this slide is bar chart. This is a completely editable PowerPoint presentation and is available for immediate download. Download now and impress your audience.

Bar Graph Investment Ppt PowerPoint Presentation Slides Ideas
Presenting this set of slides with name bar graph investment ppt powerpoint presentation slides ideas. The topics discussed in these slide is bar graph. This is a completely editable PowerPoint presentation and is available for immediate download. Download now and impress your audience.

Clustered Bar Analysis Ppt PowerPoint Presentation Outline Slide
Presenting this set of slides with name clustered bar analysis ppt powerpoint presentation outline slide. The topics discussed in these slide is clustered bar. This is a completely editable PowerPoint presentation and is available for immediate download. Download now and impress your audience.

Stacked Bar Investment Ppt PowerPoint Presentation Slides Portrait
Presenting this set of slides with name stacked bar investment ppt powerpoint presentation slides portrait. The topics discussed in these slide is stacked bar. This is a completely editable PowerPoint presentation and is available for immediate download. Download now and impress your audience.

ITIL Strategy Change Management Bar Chart Ppt Slides Vector PDF
Presenting this set of slides with name itil strategy change management bar chart ppt slides vector pdf. The topics discussed in these slide is bar chart. This is a completely editable PowerPoint presentation and is available for immediate download. Download now and impress your audience.
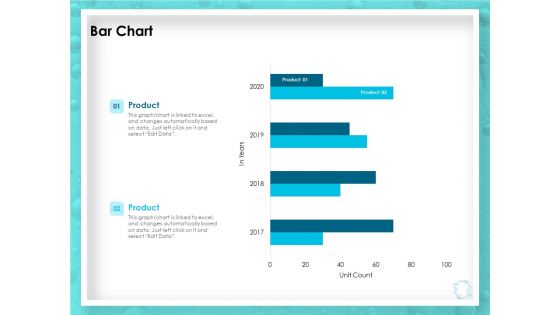
WQM System Bar Chart Ppt PowerPoint Presentation Slides Demonstration PDF
Presenting this set of slides with name wqm system bar chart ppt powerpoint presentation slides demonstration pdf. The topics discussed in these slide is bar chart. This is a completely editable PowerPoint presentation and is available for immediate download. Download now and impress your audience.

Circular Progress Bar Slide For Human Resource Practices Pictures PDF
Showcasing this set of slides titled circular progress bar slide for human resource practices pictures pdf. The topics addressed in these templates are circular progress bar slide for human resource practices. All the content presented in this PPT design is completely editable. Download it and make adjustments in color, background, font etc. as per your unique business setting.
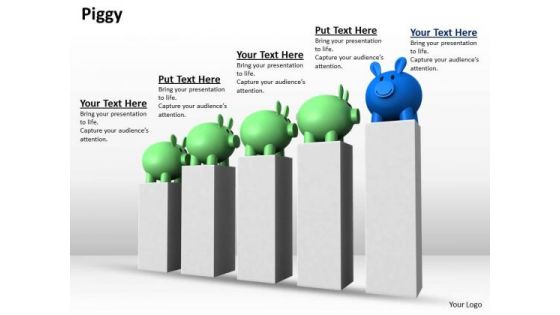
Stock Photo Piggy Banks Of Bar Graph PowerPoint Slide
This image is designed with piggy banks on bar graph. This image portrays the concepts of saving and investment. You may use this image to make outstanding presentations.
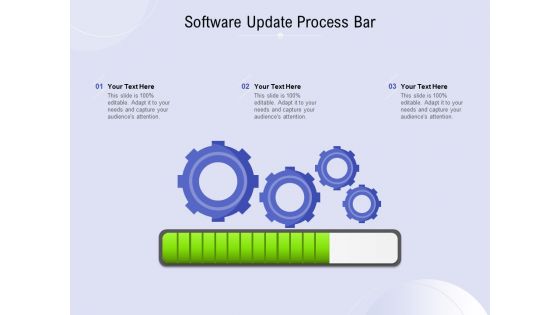
Software Update Process Bar Ppt PowerPoint Presentation Slides Graphics
Presenting this set of slides with name software update process bar ppt powerpoint presentation slides graphics. This is a three stage process. The stages in this process are software update process bar. This is a completely editable PowerPoint presentation and is available for immediate download. Download now and impress your audience.
Progress Bar Vector Icon Ppt Slides Design Templates PDF
Showcasing this set of slides titled progress bar vector icon ppt slides design templates pdf. The topics addressed in these templates are progress bar vector icon. All the content presented in this PPT design is completely editable. Download it and make adjustments in color, background, font etc. as per your unique business setting.
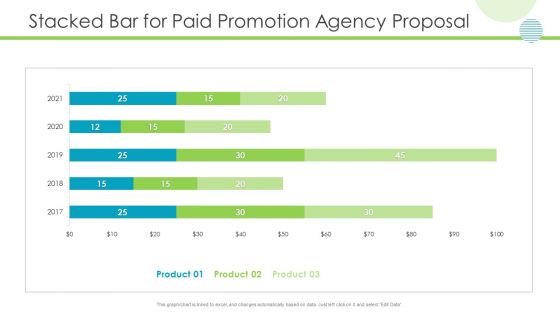
Stacked Bar For Paid Promotion Agency Proposal Slides PDF
Deliver an awe inspiring pitch with this creative Stacked Bar For Paid Promotion Agency Proposal Slides Pdf bundle. Topics like stacked bar for paid promotion agency proposal can be discussed with this completely editable template. It is available for immediate download depending on the needs and requirements of the user.
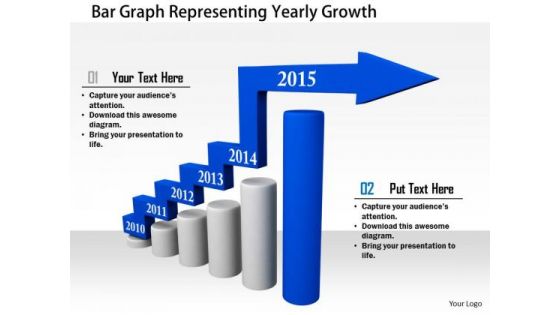
Stock Photo Bar Graph Representing Yearly Growth PowerPoint Slide
This Power Point image template slide has been crafted with graphic of bar graph and arrow. This image slide template contains the concept of yearly growth. Use this image slide and build exclusive presentation for your viewers.
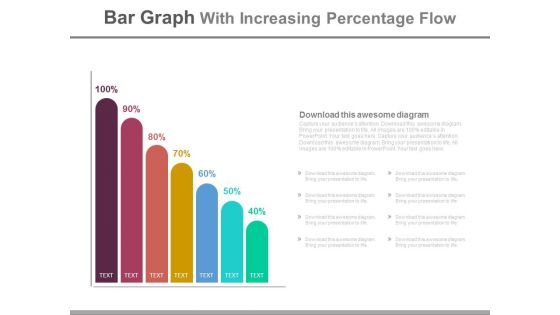
Bar Graph With Increasing Percentage Flow Powerpoint Slides
This PowerPoint slide has been designed with bar graph and increasing percentage values. This diagram slide may be used to display profit growth. Prove the viability of your ideas with this professional slide.

Stock Photo Dollar Symbol Bar Graph With Cubes PowerPoint Slide
This image slide contains bar graph of cubes with dollar symbol. This image is designed with dollar growth graph. Use this slide to display growth of profit in business presentations. Make an impressive presentation by using this image.

Bank Bar Graph Business Deal Result Analysis Ppt Slides Graphics
This power point icon slide has been designed with four different icons. Icons of bank, bar graph and business deal have been displayed in this slide. Use these icons in your presentations to add professional impact.

Laptop Globe Bar Graph Dollar Coins Ppt Slides Graphics
Icons of laptop, globe and bar graph with dollar coins have been used to design this icon PPT slide. Download these icons to display concepts of technology and financial growth. Use this slide to build an exclusive presentation.
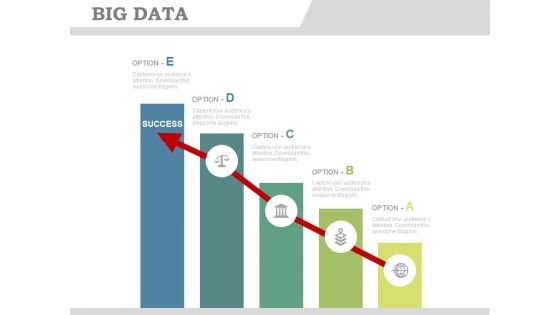
Bar Graph Infographics With Success Arrow Powerpoint Slides
This PowerPoint template has been designed with bar graph with success arrow. You may use this PPT slide to display goal achievement and planning. Impress your audiences by using this PPT slide.
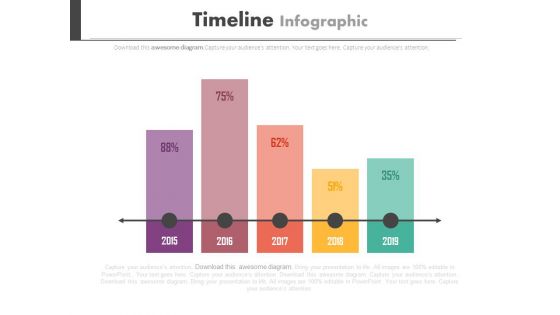
Timeline Bar Graph For Yearly Planning Powerpoint Slides
This PowerPoint template has been designed with timeline bar graph. You may download this timeline diagram slide to display long term planning for business. Chart the course you intend to take with this slide.
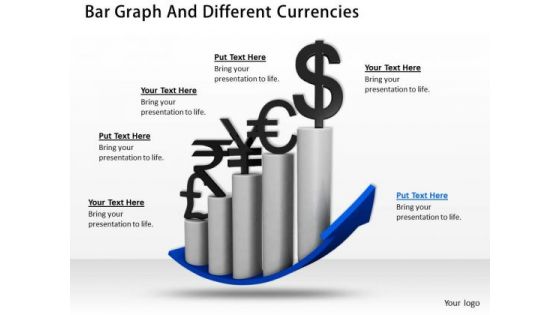
Stock Photo Bar Graph And Different Currencies PowerPoint Slide
This image slide displays bar graph with different currencies symbols. This image has been designed with graphic of bar graph, blue colored growth arrow and symbols of different currencies. Use this image slide, in your presentations to express views on finance, growth and achievements. This image slide may also be used to exhibit finance accounts in your presentations. This image slide will enhance the quality of your presentations.
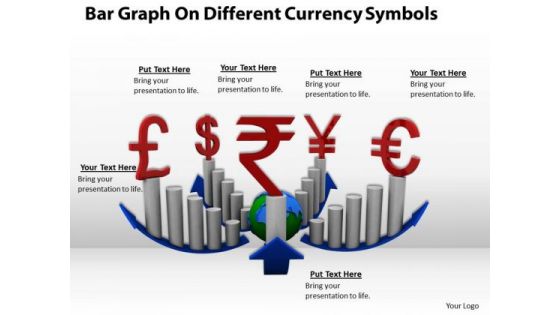
Stock Photo Bar Graph For Currency And Finance PowerPoint Slide
This image slide displays bar graphs with different currency symbols. This image has been designed with graphic of bar graphs, blue colored growth arrow and symbols of different currencies. Use this image slide, in your presentations to express views on finance, growth and achievements. This image slide may also be used to exhibit finance accounts in your presentations. This image slide will enhance the quality of your presentations.
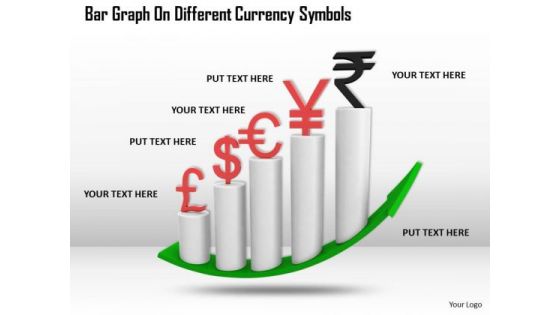
Stock Photo Bar Graph On Different Currency Symbols PowerPoint Slide
This image slide displays bar graph with different currency symbols. This image has been designed with graphic of bar graph, green colored growth arrow and symbols of different currencies. Use this image slide, in your presentations to express views on finance, monetary growth and achievements. This image slide may also be used to exhibit finance accounts in your presentations. This image slide will enhance the quality of your presentations.

Stock Photo Bar Graph With Dollar Currency Symbol PowerPoint Slide
This image slide displays bar graph with dollar currency symbol. This image has been designed with graphic of bar graph, red colored growth arrow and symbols of dollar currency. Use this image slide, in your presentations to express views on finance, growth and achievements. This image slide may also be used to exhibit finance accounts in your presentations. This image slide will enhance the quality of your presentations.
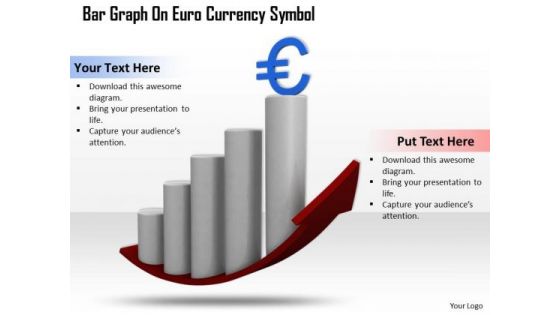
Stock Photo Bar Graph With Euro Currency Symbol PowerPoint Slide
This image slide displays bar graph with euro currency symbol. This image has been designed with graphic of bar graph, red colored growth arrow and symbols of euro currency. Use this image slide, in your presentations to express views on finance, growth and achievements. This image slide may also be used to exhibit finance accounts in your presentations. This image slide will enhance the quality of your presentations.

Stock Photo Bar Graph With Pound Currency Symbol PowerPoint Slide
This image slide displays bar graph with pound currency symbol. This image has been designed with graphic of bar graph, red colored growth arrow and symbols of pound currency. Use this image slide, in your presentations to express views on finance, growth and achievements. This image slide may also be used to exhibit finance accounts in your presentations. This image slide will enhance the quality of your presentations.

 Home
Home