Sales Trend

Insurance Sector Obstacles Opportunities Rural Areas Business Case Competition Dashboard Download PDF
This slide shows the dashboard related to insurance company which includes sales per broker, avg time to settle by policy type, sales growth etc. Deliver and pitch your topic in the best possible manner with this insurance sector obstacles opportunities rural areas business case competition dashboard download pdf. Use them to share invaluable insights on sales growth, cost per claim, 2017 to 2022 and impress your audience. This template can be altered and modified as per your expectations. So, grab it now.
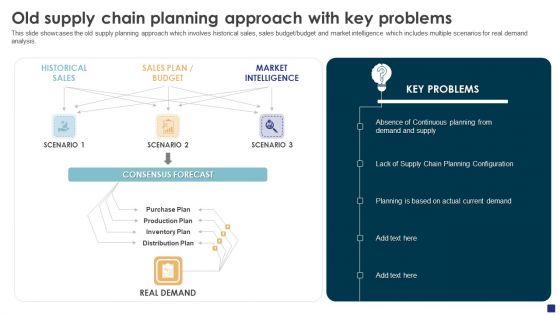
Comprehensive Guide To Ecommerce Old Supply Chain Planning Approach With Key Graphics PDF
This slide showcases the old supply planning approach which involves historical sales, sales budget or budget and market intelligence which includes multiple scenarios for real demand analysis. The Comprehensive Guide To Ecommerce Old Supply Chain Planning Approach With Key Graphics PDF is a compilation of the most recent design trends as a series of slides. It is suitable for any subject or industry presentation, containing attractive visuals and photo spots for businesses to clearly express their messages. This template contains a variety of slides for the user to input data, such as structures to contrast two elements, bullet points, and slides for written information. Slidegeeks is prepared to create an impression.

Supply Network Planning And Administration Tactics Old Supply Chain Planning Approach Professional PDF
This slide showcases the old supply planning approach which involves historical sales, sales budget or budget and market intelligence which includes multiple scenarios for real demand analysis. The Supply Network Planning And Administration Tactics Old Supply Chain Planning Approach Professional PDF is a compilation of the most recent design trends as a series of slides. It is suitable for any subject or industry presentation, containing attractive visuals and photo spots for businesses to clearly express their messages. This template contains a variety of slides for the user to input data, such as structures to contrast two elements, bullet points, and slides for written information. Slidegeeks is prepared to create an impression.
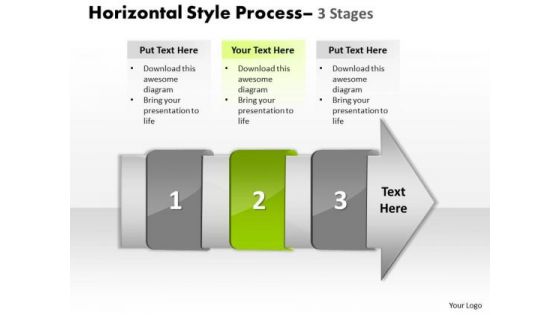
Ppt Theme Horizontal To Vertical Text Steps Working With Slide Numbers Demonstration 3 Graphic
We present our PPT Theme horizontal to vertical text steps working with slide numbers demonstration 3 Graphic. Use our Arrows PowerPoint Templates because, they help to lay the base of your trend of thought. Use our Shapes PowerPoint Templates because, Core Diagram: - Explore the various hues and layers existing in you are in your plans and processes. Use our Finance PowerPoint Templates because, Many a core idea has various enveloping layers. Use our Business PowerPoint Templates because, Marketing Strategy Business Template: - Maximizing sales of your product is the intended destination. Use our Process and Flows PowerPoint Templates because, are the stepping stones of our journey till date. Use these PowerPoint slides for presentations relating to accent, advertisement, arrow, badge, banner, business, button, collection, color, decoration, design, direction, element, financial, flow, graph, horizontal, instruction, isolated, label, manual, message, process, sale, set, shape, steps, symbol, template. The prominent colors used in the PowerPoint template are Green, Gray, and Black

Area Chart Ppt PowerPoint Presentation Inspiration Images
This is a area chart ppt powerpoint presentation inspiration images. This is a two stage process. The stages in this process are area chart, product, sales in percentage.
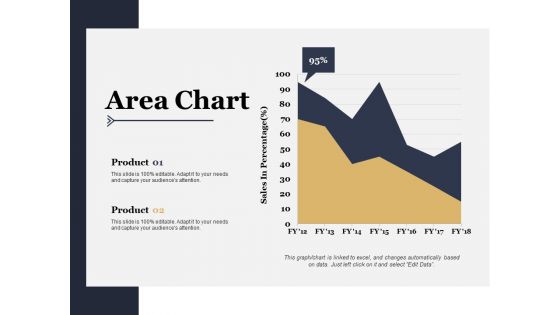
Area Chart Ppt PowerPoint Presentation Styles Professional
This is a area chart ppt powerpoint presentation styles professional. This is a two stage process. The stages in this process are sales in percentage, product, area chart.

Area Chart Ppt PowerPoint Presentation Portfolio Examples
This is a area chart ppt powerpoint presentation portfolio examples. This is a two stage process. The stages in this process are product, area chart, sales in percentage.

Area Chart Ppt PowerPoint Presentation Samples
This is a area chart ppt powerpoint presentation samples. This is a two stage process. The stages in this process are financial year, sales in percentage, jan, feb.

Area Chart Ppt PowerPoint Presentation Outline Objects
This is a area chart ppt powerpoint presentation outline objects. This is a two stage process. The stages in this process are product, sales in percentage, financial year.
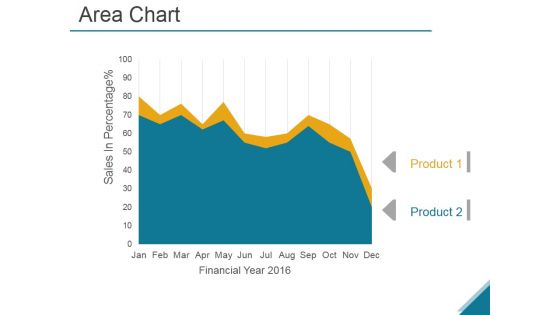
Area Chart Ppt PowerPoint Presentation Show
This is a area chart ppt powerpoint presentation show. This is a two stage process. The stages in this process are sales in percentage, business, marketing, analysis, success.
Area Chart Ppt PowerPoint Presentation Icon Gallery
This is a area chart ppt powerpoint presentation icon gallery. This is a two stage process. The stages in this process are sales in percentage, product, bar graph.

Brand Development Manual Business Performance KPI Dashboard Background PDF
Following slide covers business performance dashboard of the firm. It include KPIs such as average weekly sales revenue, above sales target, sales revenue and profit generated.Deliver an awe inspiring pitch with this creative Brand Development Manual Business Performance KPI Dashboard Background PDF bundle. Topics like Business Performance KPI Dashboard can be discussed with this completely editable template. It is available for immediate download depending on the needs and requirements of the user.
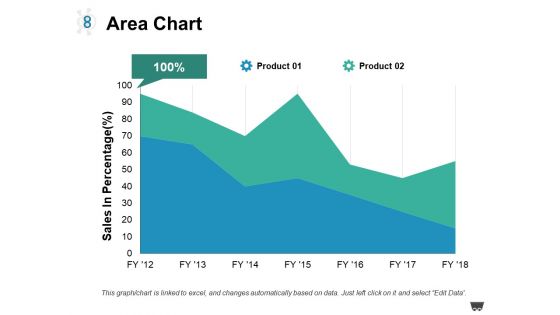
Area Chart Ppt PowerPoint Presentation Model Guidelines
This is a area chart ppt powerpoint presentation model guidelines. This is a two stage process. The stages in this process are product, area chart, sales in percentage.
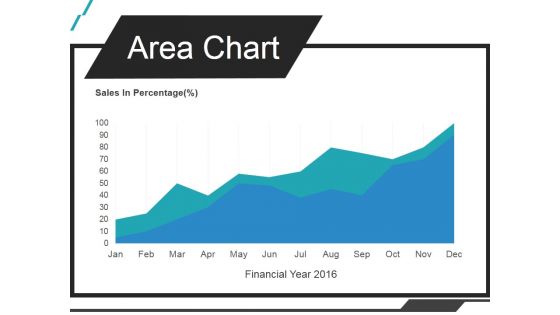
Area Chart Ppt PowerPoint Presentation Infographics
This is a area chart ppt powerpoint presentation infographics. This is a one stage process. The stages in this process are sales in percentage, jan, feb, mar, apr.
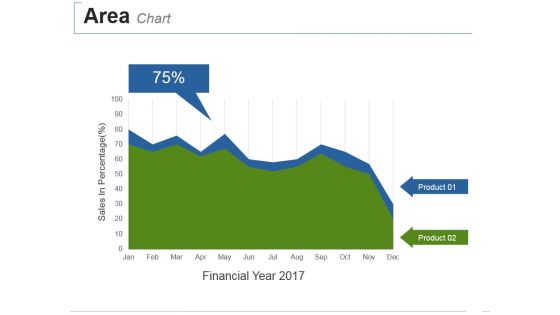
Area Chart Ppt PowerPoint Presentation Summary Deck
This is a area chart ppt powerpoint presentation summary deck. This is a two stage process. The stages in this process are sales in percentage, financial year.
Area Chart Ppt PowerPoint Presentation Icon Brochure
This is a area chart ppt powerpoint presentation icon brochure. This is a two stage process. The stages in this process are product, sales in percentage, growth, success.
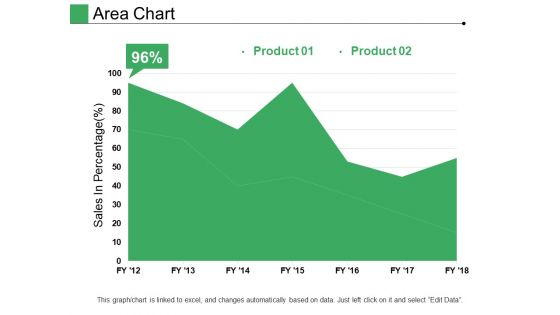
Area Chart Ppt PowerPoint Presentation Pictures Designs
This is a area chart ppt powerpoint presentation pictures designs. This is a two stage process. The stages in this process are product, sales in percentage, growth, success.

Area Chart Ppt PowerPoint Presentation Professional Grid
This is a area chart ppt powerpoint presentation professional grid. This is a two stage process. The stages in this process are product, sales in percentage, business.
Successful Brand Development Plan Business Performance Measuring KPI Dashboard Icons PDF
Following slide covers business performance dashboard of the firm. It include KPIs such as average weekly sales revenue, above sales target, sales revenue and profit generated.Deliver and pitch your topic in the best possible manner with this successful brand development plan business performance measuring kpi dashboard icons pdf Use them to share invaluable insights on average revenue, customer lifetime value, customer acquisition cost and impress your audience. This template can be altered and modified as per your expectations. So, grab it now.

Establishing Successful Brand Strategy To Captivate Consumers Business Performance Dashboard Microsoft PDF
Following slide covers business performance dashboard of the firm. It include KPIs such as average weekly sales revenue, above sales target, sales revenue and profit generated. Deliver an awe inspiring pitch with this creative establishing successful brand strategy to captivate consumers business performance dashboard microsoft pdf bundle. Topics like customer acquisition cost, customer lifetime value, average revenue per unit can be discussed with this completely editable template. It is available for immediate download depending on the needs and requirements of the user.
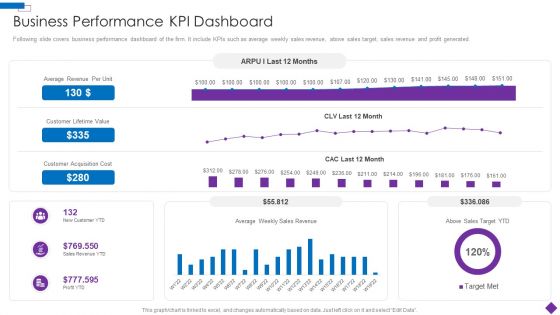
Introducing A New Product To The Market Business Performance KPI Dashboard Brochure PDF
Following slide covers business performance dashboard of the firm. It include KPIs such as average weekly sales revenue, above sales target, sales revenue and profit generated.Deliver and pitch your topic in the best possible manner with this Introducing A New Product To The Market Business Performance KPI Dashboard Brochure PDF Use them to share invaluable insights on Business Performance KPI Dashboard and impress your audience. This template can be altered and modified as per your expectations. So, grab it now.
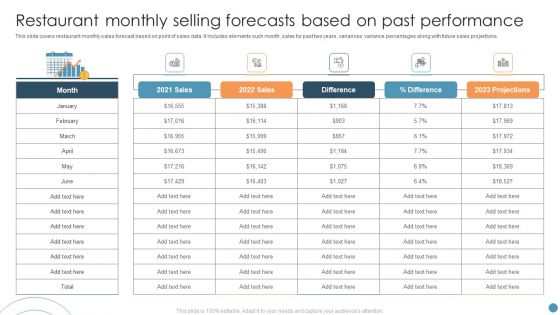
Restaurant Monthly Selling Forecasts Based On Past Performance Microsoft PDF
This slide covers restaurant monthly sales forecast based on point of sales data. It includes elements such month, sales for past two years, variances, variance percentages along with future sales projections. Showcasing this set of slides titled Restaurant Monthly Selling Forecasts Based On Past Performance Microsoft PDF. The topics addressed in these templates are Restaurant Monthly Selling Forecasts, Past Performance. All the content presented in this PPT design is completely editable. Download it and make adjustments in color, background, font etc. as per your unique business setting.
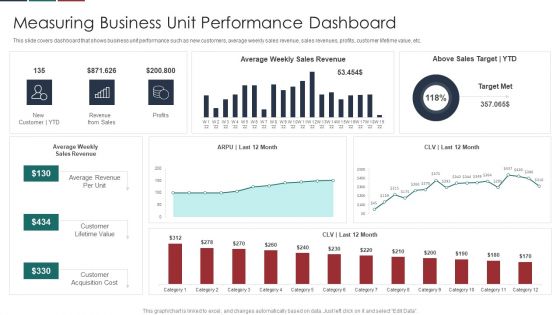
Deliver Efficiency Innovation Measuring Business Unit Performance Dashboard Background PDF
This slide covers dashboard that shows business unit performance such as new customers, average weekly sales revenue, sales revenues, profits, customer lifetime value, etc. Deliver an awe inspiring pitch with this creative Deliver Efficiency Innovation Measuring Business Unit Performance Dashboard Background PDF bundle. Topics like Customer Lifetime Value, Customer Acquisition Cost, Average Revenue Per Unit, Above Sales Target YTD can be discussed with this completely editable template. It is available for immediate download depending on the needs and requirements of the user.
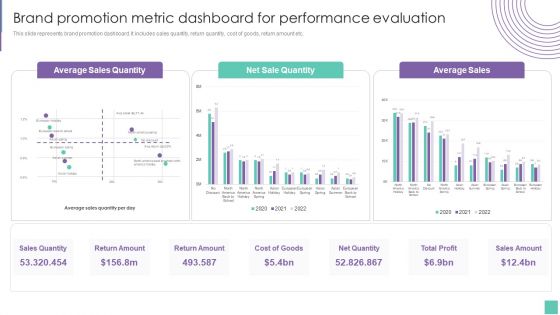
Brand Promotion Metric Dashboard For Performance Evaluation Introduce Promotion Plan Guidelines PDF
This slide represents brand promotion dashboard. It includes sales quantity, return quantity, cost of goods, return amount etc.Deliver an awe inspiring pitch with this creative Brand Promotion Metric Dashboard For Performance Evaluation Introduce Promotion Plan Guidelines PDF bundle. Topics like Average Sales, Net Quantity, Sales Amount can be discussed with this completely editable template. It is available for immediate download depending on the needs and requirements of the user.

Assuring Management In Product Innovation To Enhance Processes Measuring Business Unit Performance Dashboard Inspiration PDF
This slide covers dashboard that shows business unit performance such as new customers, average weekly sales revenue, sales revenues, profits, customer lifetime value, etc.Deliver an awe inspiring pitch with this creative assuring management in product innovation to enhance processes measuring business unit performance dashboard inspiration pdf bundle. Topics like average weekly sales revenue, customer lifetime value, customer acquisition cost can be discussed with this completely editable template. It is available for immediate download depending on the needs and requirements of the user.
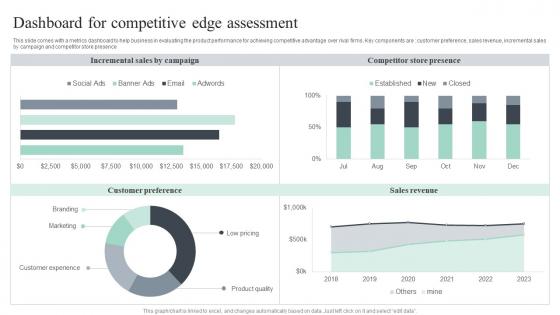
Dashboard For Competitive Edge Assessment Themes Pdf
This slide comes with a metrics dashboard to help business in evaluating the product performance for achieving competitive advantage over rival firms. Key components are customer preference, sales revenue, incremental sales by campaign and competitor store presence Pitch your topic with ease and precision using this Dashboard For Competitive Edge Assessment Themes Pdf. This layout presents information on Incremental Sales, Competitor Store Presence, Sales Revenue. It is also available for immediate download and adjustment. So, changes can be made in the color, design, graphics or any other component to create a unique layout.
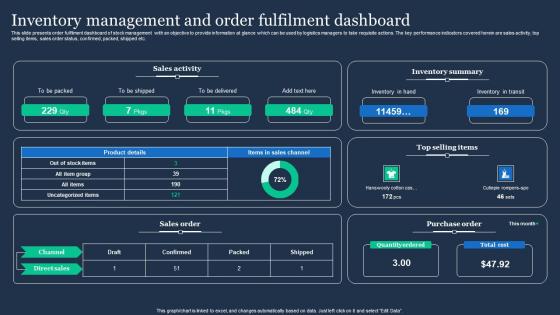
Inventory Management And Order Fulfilment Dashboard Slides Pdf
This slide presents order fulfilment dashboard of stock management with an objective to provide information at glance which can be used by logistics managers to take requisite actions. The key performance indicators covered herein are sales activity, top selling items, sales order status, confirmed, packed, shipped etc. Pitch your topic with ease and precision using this Inventory Management And Order Fulfilment Dashboard Slides Pdf. This layout presents information on Sales Activity, Inventory Summary, Sales Order. It is also available for immediate download and adjustment. So, changes can be made in the color, design, graphics or any other component to create a unique layout.
Tactical Planning And Analyzing Organizational Goals Icon Infographics PDF
This slide defines the dashboard for analyzing the sales key performance indicators KPIs. It includes information related to the number of sales, revenue, profit, and cost. Showcasing this set of slides titled Tactical Planning And Analyzing Organizational Goals Icon Infographics PDF. The topics addressed in these templates are Cost Breakdown, Sales Revenue, Accumulated Revenue. All the content presented in this PPT design is completely editable. Download it and make adjustments in color, background, font etc. as per your unique business setting.
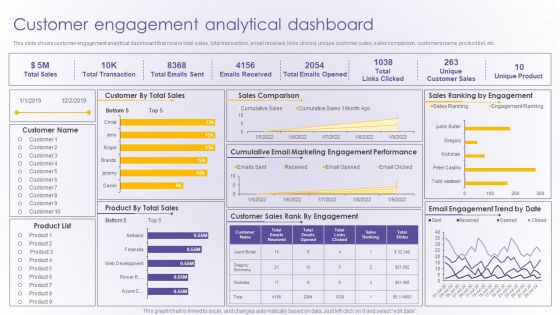
Customer Engagement Analytical Dashboard Developing Online Consumer Engagement Program Professional PDF
This slide shows customer engagement analytical dashboard that covers total sales, total transaction, email received, links clicked, unique customer sales, sales comparison, customers name, product list, etc.Deliver and pitch your topic in the best possible manner with this Customer Engagement Analytical Dashboard Developing Online Consumer Engagement Program Professional PDF. Use them to share invaluable insights on Cumulative Email, Marketing Engagement, Performance and impress your audience. This template can be altered and modified as per your expectations. So, grab it now.
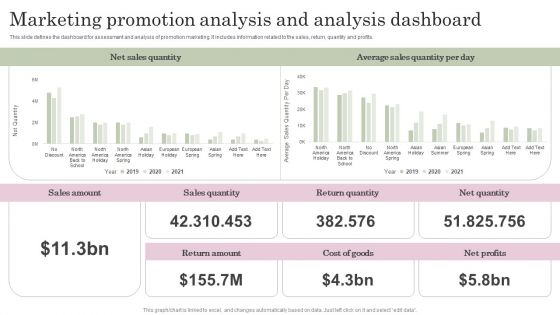
Marketing Promotion Analysis And Analysis Dashboard Brochure PDF
This slide defines the dashboard for assessment and analysis of promotion marketing. It includes information related to the sales, return, quantity and profits. Showcasing this set of slides titled Marketing Promotion Analysis And Analysis Dashboard Brochure PDF. The topics addressed in these templates are Sales Amount, Sales Quantity, Return Quantity. All the content presented in this PPT design is completely editable. Download it and make adjustments in color, background, font etc. as per your unique business setting.
Key Performance Indicators For Smarketing Ppt Icon Graphic Images PDF
This slide shows various KPIs which can be used to measure marketing and sales alignment. These are overall revenue, sales cycle length, marketing qualified leads, etc. Presenting Key Performance Indicators For Smarketing Ppt Icon Graphic Images PDF to dispense important information. This template comprises one stages. It also presents valuable insights into the topics including KPIs, Overall Revenue, Sales Cycle Length. This is a completely customizable PowerPoint theme that can be put to use immediately. So, download it and address the topic impactfully.

Renewable Energy Dashboard For Geo Energy Company Professional PDF
This slide shows a Renewable Energy dashboard for GEO Energy Company with details on total consumption, total sales, energy sources, production costs, sales by sector etc. Deliver and pitch your topic in the best possible manner with this renewable energy dashboard for geo energy company professional pdf. Use them to share invaluable insights on sales, industry, sources, costs, services and impress your audience. This template can be altered and modified as per your expectations. So, grab it now.
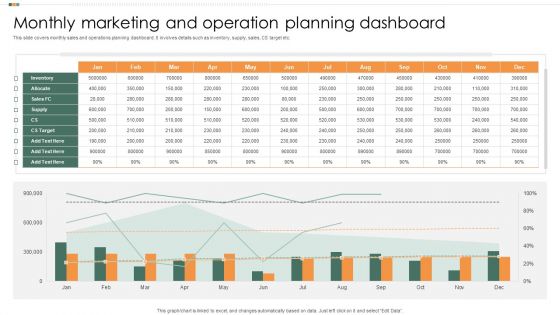
Monthly Marketing And Operation Planning Dashboard Rules PDF
This slide covers monthly sales and operations planning dashboard. It involves details such as inventory, supply, sales, CS target etc. Showcasing this set of slides titled Monthly Marketing And Operation Planning Dashboard Rules PDF. The topics addressed in these templates are Target, Sales, Supply. All the content presented in this PPT design is completely editable. Download it and make adjustments in color, background, font etc. as per your unique business setting.

Retail Store Marketing And Operations Dashboard Mockup PDF
This slide covers retail store sales and operation dashboard. It involves revenue by sales, number if customers, average transaction price, average units per consumer etc. Pitch your topic with ease and precision using this Retail Store Marketing And Operations Dashboard Mockup PDF. This layout presents information on Revenue By Sales, Customer, Average Transaction Price. It is also available for immediate download and adjustment. So, changes can be made in the color, design, graphics or any other component to create a unique layout.

Customer Engagement And Experience Customer Engagement Analytical Dashboard Slides PDF
This slide shows customer engagement analytical dashboard that covers total sales, total transaction, email received, links clicked, unique customer sales, sales comparison, customers name, product list, etc.Deliver an awe inspiring pitch with this creative Customer Engagement And Experience Customer Engagement Analytical Dashboard Slides PDF bundle. Topics like Total Transaction, Emails Received, Unique Customer can be discussed with this completely editable template. It is available for immediate download depending on the needs and requirements of the user.

Analytical Incrementalism Business Performance Measurement Metrics Download PDF
The purpose of this slide is to provide a glimpse about the business marketing performance measurement metrics after logical incrementalism approach. Deliver an awe-inspiring pitch with this creative analytical incrementalism business performance measurement metrics download pdf bundle. Topics like sales revenue, new customer, sales growth, sales region performance, profit can be discussed with this completely editable template. It is available for immediate download depending on the needs and requirements of the user.
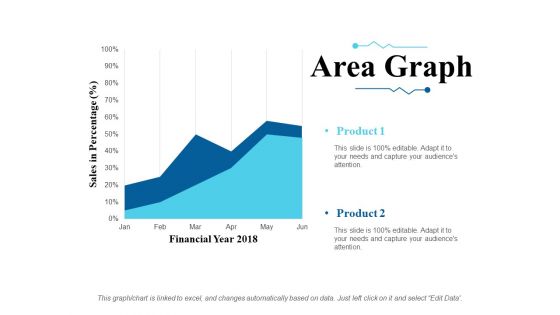
Area Graph Ppt PowerPoint Presentation Slides Ideas
This is a area graph ppt powerpoint presentation slides ideas. This is a two stage process. The stages in this process are sales in percentage, financial year, product.
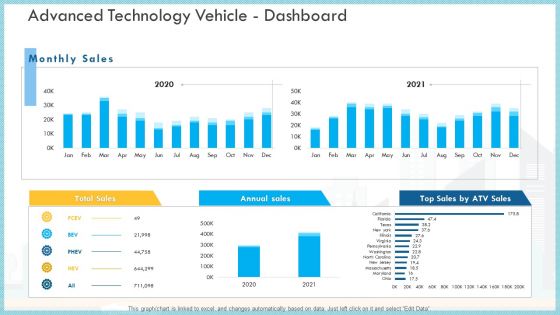
Loss Of Income And Financials Decline In An Automobile Organization Case Study Advanced Technology Vehicle Dashboard Infographics PDF
This graph or chart is linked to excel, and changes automatically based on data. Just left click on it and select Edit Data.Deliver an awe inspiring pitch with this creative loss of income and financials decline in an automobile organization case study advanced technology vehicle dashboard infographics pdf bundle. Topics like total sales, annual sales, monthly sales can be discussed with this completely editable template. It is available for immediate download depending on the needs and requirements of the user.
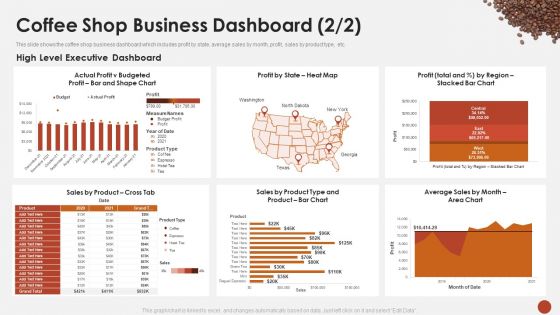
Coffee Shop Business Dashboard Executive Blueprint For Opening A Coffee Shop Ppt Pictures Example PDF
This slide shows the coffee shop business dashboard which includes profit by state, average sales by month, profit, sales by product type, etc. Deliver an awe inspiring pitch with this creative coffee shop business dashboard executive blueprint for opening a coffee shop ppt pictures example pdf bundle. Topics like executive, dashboard, sales, budgeted can be discussed with this completely editable template. It is available for immediate download depending on the needs and requirements of the user.

Coffee Shop Business Dashboard Executive Business Plan For Opening A Coffeehouse Ppt Ideas Format PDF
This slide shows the coffee shop business dashboard which includes profit by state, average sales by month, profit, sales by product type, etc. Deliver an awe inspiring pitch with this creative coffee shop business dashboard executive business plan for opening a coffeehouse ppt ideas format pdf bundle. Topics like executive, dashboard, sales, budgeted can be discussed with this completely editable template. It is available for immediate download depending on the needs and requirements of the user.

Coffee Shop Business Dashboard Category Blueprint For Opening A Coffee Shop Ppt Slides PDF
This slide shows the coffee shop business dashboard which includes sales month, gross margin by category, sales and profit details, etc. Deliver and pitch your topic in the best possible manner with this coffee shop business dashboard category blueprint for opening a coffee shop ppt slides pdf. Use them to share invaluable insights on sales, plan, gross margin and impress your audience. This template can be altered and modified as per your expectations. So, grab it now.
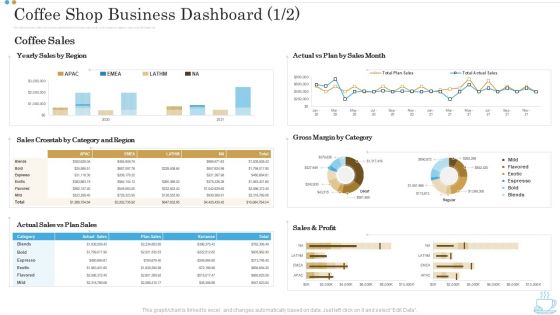
Coffee Shop Business Dashboard Category Business Plan For Opening A Coffeehouse Ppt Slides Graphics Example PDF
This slide shows the coffee shop business dashboard which includes sales month, gross margin by category, sales and profit details, etc. Deliver and pitch your topic in the best possible manner with this coffee shop business dashboard category business plan for opening a coffeehouse ppt slides graphics example pdf. Use them to share invaluable insights on sales, plan, gross margin and impress your audience. This template can be altered and modified as per your expectations. So, grab it now.

Business Performance Review Dashboard To Measure Overall Business Performance Formats PDF
The following slide highlights a comprehensive quarterly business review QBR dashboard which can be used by the organization to evaluate business performance. The metrics used for review are total revenue, new customers, gross profit, overall costs, sales comparison, sales by different products and top performing channels. Showcasing this set of slides titled Business Performance Review Dashboard To Measure Overall Business Performance Formats PDF. The topics addressed in these templates are Sales Comparison, Sales Product, High Performing. All the content presented in this PPT design is completely editable. Download it and make adjustments in color, background, font etc. as per your unique business setting.

Customer Relationship Management Dashboard With Industry Operations Data Statistics Pictures PDF
This slide illustrates graphical representation of statistical data of sales operation. It includes sales pipeline, closed operations, open operations, operations by closing date etc. Pitch your topic with ease and precision using this Customer Relationship Management Dashboard With Industry Operations Data Statistics Pictures PDF. This layout presents information on Sales Pipeline, Insurance, Telecommunic. It is also available for immediate download and adjustment. So, changes can be made in the color, design, graphics or any other component to create a unique layout.
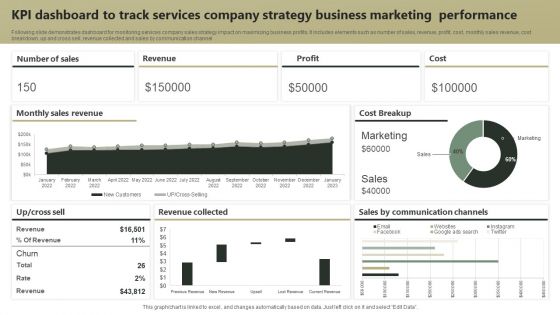
KPI Dashboard To Track Services Company Strategy Business Marketing Performance Guidelines PDF
Following slide demonstrates dashboard for monitoring services company sales strategy impact on maximizing business profits. It includes elements such as number of sales, revenue, profit, cost, monthly sales revenue, cost breakdown, up and cross sell, revenue collected and sales by communication channel. Showcasing this set of slides titled KPI Dashboard To Track Services Company Strategy Business Marketing Performance Guidelines PDF. The topics addressed in these templates are Revenue, Profit, Cost. All the content presented in this PPT design is completely editable. Download it and make adjustments in color, background, font etc. as per your unique business setting.
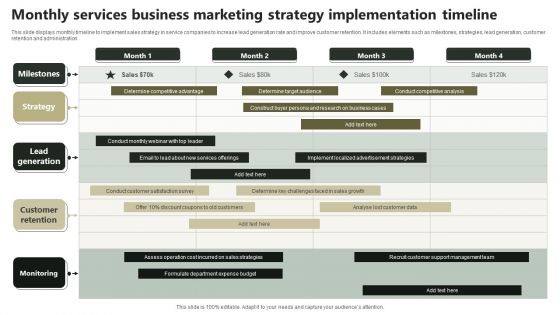
Monthly Services Business Marketing Strategy Implementation Timeline Professional PDF
Following slide demonstrates dashboard for monitoring services company sales strategy impact on maximizing business profits. It includes elements such as number of sales, revenue, profit, cost, monthly sales revenue, cost breakdown, up and cross sell, revenue collected and sales by communication channel. Showcasing this set of slides titled Monthly Services Business Marketing Strategy Implementation Timeline Professional PDF. The topics addressed in these templates are Strategy, Lead Generation, Customer Retention. All the content presented in this PPT design is completely editable. Download it and make adjustments in color, background, font etc. as per your unique business setting.

Marketing And Operation Planning Dashboard To Drive Better Performance Graphics PDF
This slide covers sales and operations planning dashboard to improve performance. It involves bookings plan, year on year growth, bookings plan per year and total growth and sales made by sales manager. Showcasing this set of slides titled Marketing And Operation Planning Dashboard To Drive Better Performance Graphics PDF. The topics addressed in these templates are Sales Manager, Growth Made, Bookings Plan By Year. All the content presented in this PPT design is completely editable. Download it and make adjustments in color, background, font etc. as per your unique business setting.
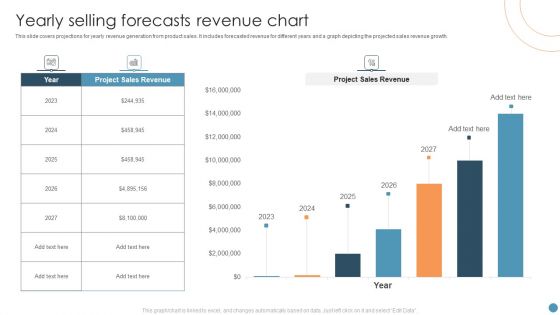
Yearly Selling Forecasts Revenue Chart Summary PDF
This slide covers projections for yearly revenue generation from product sales. It includes forecasted revenue for different years and a graph depicting the projected sales revenue growth. Showcasing this set of slides titled Yearly Selling Forecasts Revenue Chart Summary PDF. The topics addressed in these templates are Project Sales Revenue, Forecasts Revenue Chart. All the content presented in this PPT design is completely editable. Download it and make adjustments in color, background, font etc. as per your unique business setting.
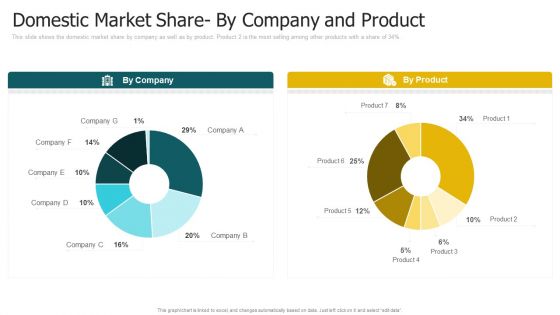
Domestic Market Share By Company And Product Brochure PDF
Following slide illustrates sales performance of the firm both yearly as well as quarterly. Number of units sold in 2020 are 61,213. Deliver and pitch your topic in the best possible manner with this domestic market share by company and product brochure pdf. Use them to share invaluable insights on yearly sales performance, quarterly sales performance and impress your audience. This template can be altered and modified as per your expectations. So, grab it now.

Monthly Planned Vs Actual Revenue Analysis Professional Pdf
This slide showcase monthly target sales with actual sales comparison with variance percentage calculation. It include monthly performance, variance, highest sales. Showcasing this set of slides titled Monthly Planned Vs Actual Revenue Analysis Professional Pdf The topics addressed in these templates are Monthly Planned, Actual Revenue Analysis All the content presented in this PPT design is completely editable. Download it and make adjustments in color, background, font etc. as per your unique business setting.
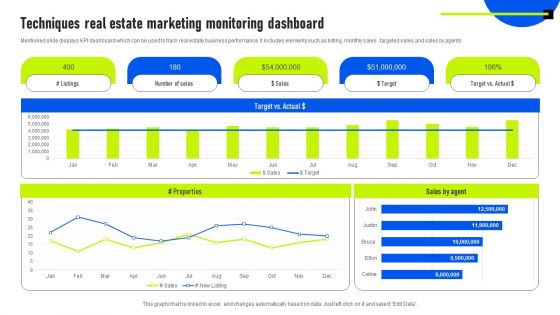
Techniques Real Estate Marketing Monitoring Dashboard Guidelines PDF
Mentioned slide displays KPI dashboard which can be used to track real estate business performance. It includes elements such as listing, monthly sales , targeted sales and sales by agents. Pitch your topic with ease and precision using this Techniques Real Estate Marketing Monitoring Dashboard Guidelines PDF. This layout presents information on Sales By Agent, Target, Marketing Monitoring Dashboard. It is also available for immediate download and adjustment. So, changes can be made in the color, design, graphics or any other component to create a unique layout.

Dashboard Ppt PowerPoint Presentation Files
This is a dashboard ppt powerpoint presentation files. This is a four stage process. The stages in this process are sales rate, progress, profits, safety.
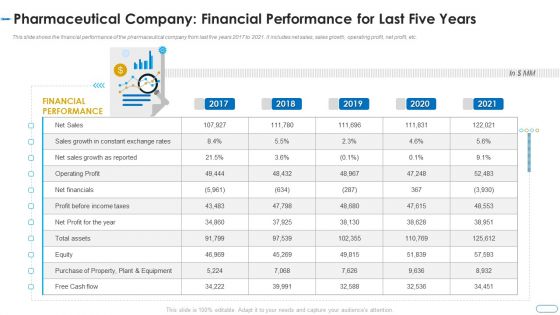
Initiatives Atmosphere Operation Problems Pharmaceutical Firm Pharmaceutical Financial Performance Clipart PDF
This slide shows the financial performance of the pharmaceutical company from last five years 2017 to 2021. It includes net sales, sales growth, operating profit, net profit, etc. Deliver and pitch your topic in the best possible manner with this initiatives atmosphere operation problems pharmaceutical firm pharmaceutical financial performance clipart pdf. Use them to share invaluable insights on financial performance, growth, sales, purchase, equipment and impress your audience. This template can be altered and modified as per your expectations. So, grab it now.
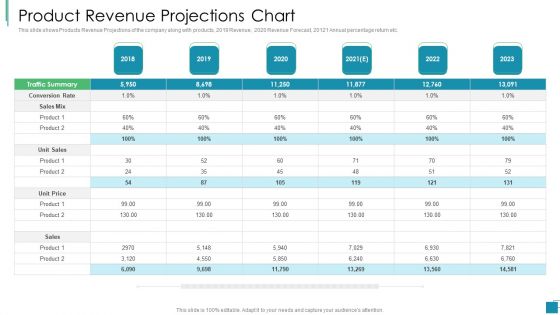
Venture Capital Pitch Decks For Private Companies Product Revenue Projections Chart Inspiration PDF
This slide shows Products Revenue Projections of the company along with products, 2019 Revenue, 2020 Revenue Forecast, 20121 Annual percentage return etc. Deliver an awe inspiring pitch with this creative venture capital pitch decks for private companies product revenue projections chart inspiration pdf bundle. Topics like sales mix, unit sales, unit price, sales can be discussed with this completely editable template. It is available for immediate download depending on the needs and requirements of the user.
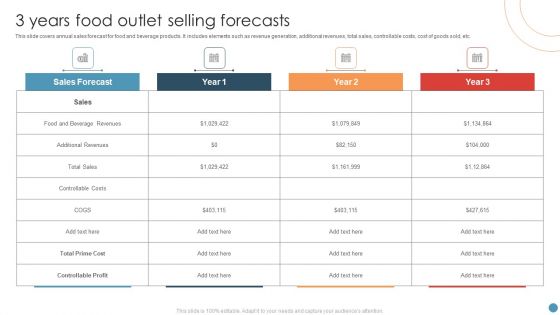
3 Years Food Outlet Selling Forecasts Sample PDF
This slide covers annual sales forecast for food and beverage products. It includes elements such as revenue generation, additional revenues, total sales, controllable costs, cost of goods sold, etc. Showcasing this set of slides titled 3 Years Food Outlet Selling Forecasts Sample PDF. The topics addressed in these templates are Controllable Costs, Controllable Profit, Sales. All the content presented in this PPT design is completely editable. Download it and make adjustments in color, background, font etc. as per your unique business setting.
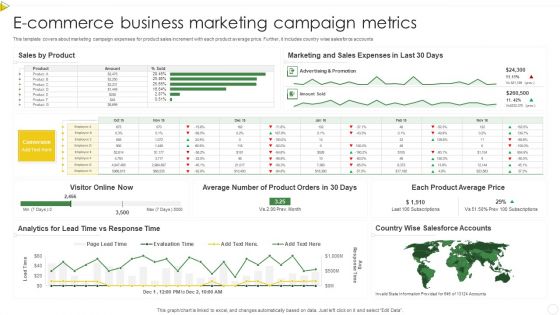
E Commerce Business Marketing Campaign Metrics Structure PDF
This template covers about marketing campaign expenses for product sales increment with each product average price. Further, it includes country wise salesforce accounts. Showcasing this set of slides titled E Commerce Business Marketing Campaign Metrics Structure PDF. The topics addressed in these templates are Sales By Product, Sales Expenses, Marketing. All the content presented in this PPT design is completely editable. Download it and make adjustments in color, background, font etc. as per your unique business setting.

Sample Of Dashboard Tool Ppt Powerpoint Show
This is a sample of dashboard tool ppt powerpoint show. This is a four stage process. The stages in this process are safety, progress, sales rate.
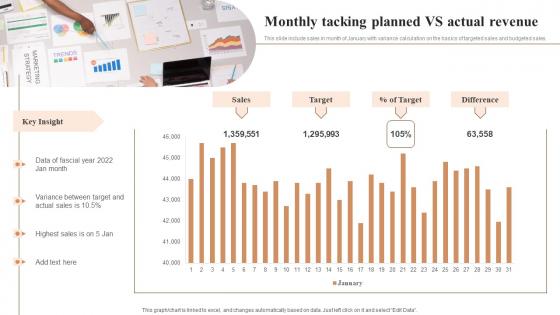
Monthly Tacking Planned Vs Actual Revenue Slides Pdf
This slide include sales in month of January with variance calculation on the basics of targeted sales and budgeted sales. Pitch your topic with ease and precision using this Monthly Tacking Planned Vs Actual Revenue Slides Pdf This layout presents information on Monthly Tacking Planned, Actual Revenue It is also available for immediate download and adjustment. So, changes can be made in the color, design, graphics or any other component to create a unique layout.
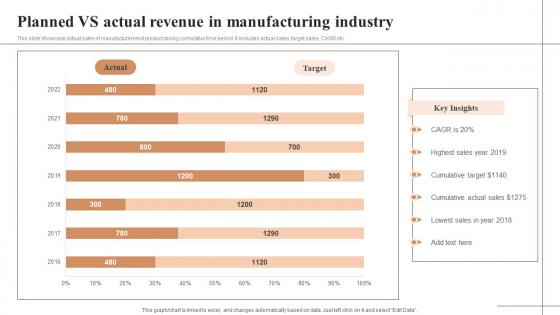
Planned Vs Actual Revenue In Manufacturing Industry Graphics Pdf
This slide showcase actual sales of manufactured end product during cumulative time period. It includes actual sales, target sales, CAGR etc. Showcasing this set of slides titled Planned Vs Actual Revenue In Manufacturing Industry Graphics Pdf The topics addressed in these templates are Planned VS Actual, Revenue In Manufacturing, Industry All the content presented in this PPT design is completely editable. Download it and make adjustments in color, background, font etc. as per your unique business setting.

Planned Vs Actual Revenue In Real Estate Industry Inspiration Pdf
The following slide showcases actual vs. targeted sales in real estate industry. It includes actual sales, targeted sales, and growth rate. Showcasing this set of slides titled Planned Vs Actual Revenue In Real Estate Industry Inspiration Pdf The topics addressed in these templates are Planned VS Actual, Revenue, Real Estate Industry All the content presented in this PPT design is completely editable. Download it and make adjustments in color, background, font etc. as per your unique business setting.

 Home
Home