Sales Performance Dashboard
Utilize Heatmaps To Predict Consumer Behavior Optimizing Retail Operations With Digital DT SS V
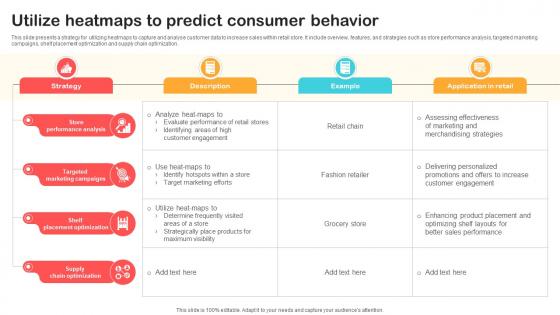
This slide presents a strategy for utilizing heatmaps to capture and analyse customer data to increase sales within retail store. It include overview, features, and strategies such as store performance analysis, targeted marketing campaigns, shelf placement optimization and supply chain optimization. Present like a pro with Utilize Heatmaps To Predict Consumer Behavior Optimizing Retail Operations With Digital DT SS V. Create beautiful presentations together with your team, using our easy-to-use presentation slides. Share your ideas in real-time and make changes on the fly by downloading our templates. So whether you are in the office, on the go, or in a remote location, you can stay in sync with your team and present your ideas with confidence. With Slidegeeks presentation got a whole lot easier. Grab these presentations today.

Utilize Heatmaps To Predict Consumer Behavior DT SS V
This slide presents a strategy for utilizing heatmaps to capture and analyse customer data to increase sales within retail store. It include overview, features, and strategies such as store performance analysis, targeted marketing campaigns, shelf placement optimization and supply chain optimization. Present like a pro with Utilize Heatmaps To Predict Consumer Behavior DT SS V. Create beautiful presentations together with your team, using our easy-to-use presentation slides. Share your ideas in real-time and make changes on the fly by downloading our templates. So whether you are in the office, on the go, or in a remote location, you can stay in sync with your team and present your ideas with confidence. With Slidegeeks presentation got a whole lot easier. Grab these presentations today.

Key Steps To Implement Market Intelligence Execution Of Strategic Intelligence Portrait PDF
The following slide highlights various steps to execute market intelligence system for employees. It showcases key components such as sales representatives coaching, supplier encouragement, competitor performance monitoring, client suggestion panel, public data resources, information acquisition and feedback. Present like a pro with Key Steps To Implement Market Intelligence Execution Of Strategic Intelligence Portrait PDF Create beautiful presentations together with your team, using our easy-to-use presentation slides. Share your ideas in real-time and make changes on the fly by downloading our templates. So whether you are in the office, on the go, or in a remote location, you can stay in sync with your team and present your ideas with confidence. With Slidegeeks presentation got a whole lot easier. Grab these presentations today.

Implementing Adaptive Work Arrangements Issues Faced By Employees And Organization Infographics PDF
The following slide outlines different problems faced by staff members and the company while working work from the office five days a week. Issues faced by employees are related to poor work-life balance, distractions at the workplace, and high budget. Issues faced by corporate are related to lower sales and profit, and a negative workplace environment. From laying roadmaps to briefing everything in detail, our templates are perfect for you. You can set the stage with your presentation slides. All you have to do is download these easy to edit and customizable templates. Implementing Adaptive Work Arrangements Issues Faced By Employees And Organization Infographics PDF will help you deliver an outstanding performance that everyone would remember and praise you for. Do download this presentation today.
Execution Of Effective Paid Media Advertising Strategies Understanding Search Engine Advertising With Benefits Pictures PDF

PPM Private Equity Current Market Trends And Future Outlook Ppt PowerPoint Presentation Infographic Template Designs Download PDF
This slide shows the current market overview of some shopping mediums and US Retail E Commerce sales with a graph. Deliver an awe-inspiring pitch with this creative ppm private equity current market trends and future outlook ppt powerpoint presentation infographic template designs download pdf bundle. Topics like e commerce retail sales, expected account, global retail sales 2020, online research, purchases, preferred retail channel can be discussed with this completely editable template. It is available for immediate download depending on the needs and requirements of the user.
Incorporating Offline Marketing Current User Statistics Of The Company Before Offline Infographics PDF
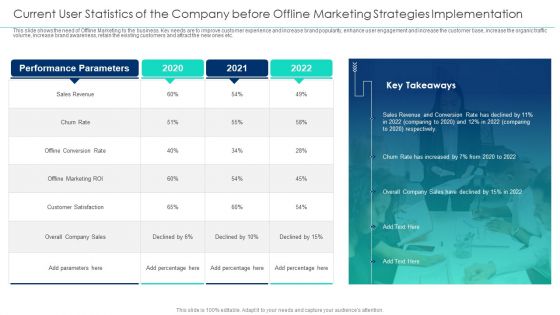
This slide shows the need of Offline Marketing to the business. Key needs are to improve customer experience and increase brand popularity, enhance user engagement and increase the customer base, increase the organic traffic volume, increase brand awareness, retain the existing customers and attract the new ones etc. Presenting incorporating offline marketing current user statistics of the company before offline infographics pdf to provide visual cues and insights. Share and navigate important information on one stages that need your due attention. This template can be used to pitch topics like sales revenue, performance parameters, 2020 to 2022, churn rate. In addtion, this PPT design contains high resolution images, graphics, etc, that are easily editable and available for immediate download.
Brand Perception Map Mapping A Brands Life Brand Value Estimation Guide Formats PDF
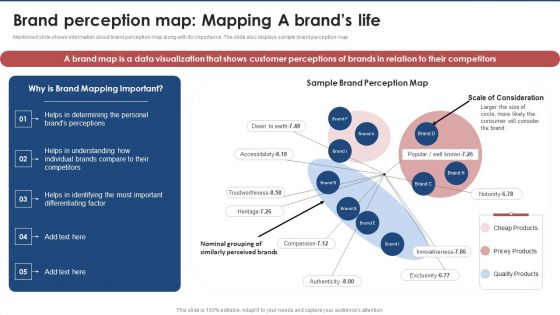
Mentioned slide displays overview about brand health covering its definition along with key performance metrics such as net promoter score, customer satisfaction score and share of voice. Slidegeeks is here to make your presentations a breeze with Brand Perception Map Mapping A Brands Life Brand Value Estimation Guide Formats PDF With our easy-to-use and customizable templates, you can focus on delivering your ideas rather than worrying about formatting. With a variety of designs to choose from, you are sure to find one that suits your needs. And with animations and unique photos, illustrations, and fonts, you can make your presentation pop. So whether you are giving a sales pitch or presenting to the board, make sure to check out Slidegeeks first.
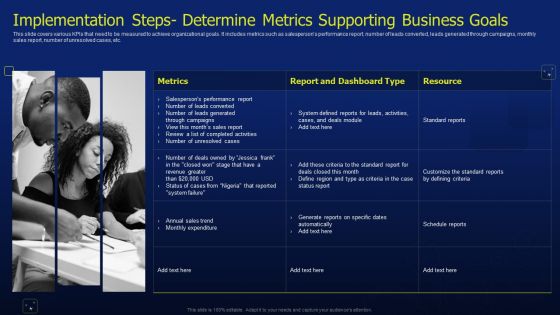
CRM Software Deployment Journey Implementation Steps Determine Metrics Supporting Mockup PDF
This slide covers various KPIs that need to be measured to achieve organizational goals. It includes metrics such as salespersons performance report, number of leads converted, leads generated through campaigns, monthly sales report, number of unresolved cases, etc. Welcome to our selection of the CRM Software Deployment Journey Implementation Steps Determine Metrics Supporting Mockup PDF. These are designed to help you showcase your creativity and bring your sphere to life. Planning and Innovation are essential for any business that is just starting out. This collection contains the designs that you need for your everyday presentations. All of our PowerPoints are 100 percent editable, so you can customize them to suit your needs. This multi-purpose template can be used in various situations. Grab these presentation templates today.
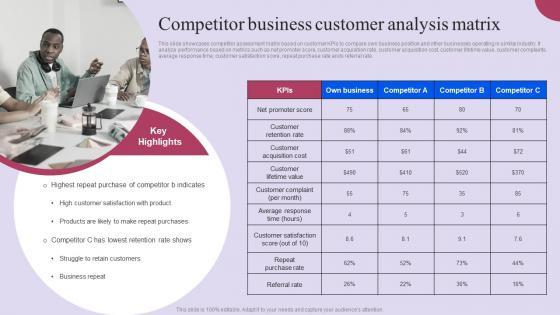
Competitor Business Customer Analysis Matrix Ppt Layouts Example File Pdf
This slide showcases competitor assessment matrix based on customer KPIs to compare own business position and other businesses operating in similar industry. It analyze performance based on metrics such as net promoter score, customer acquisition rate, customer acquisition cost, customer lifetime value, customer complaints, average response time, customer satisfaction score, repeat purchase rate ands referral rate. Slidegeeks is here to make your presentations a breeze with Competitor Business Customer Analysis Matrix Ppt Layouts Example File Pdf With our easy to use and customizable templates, you can focus on delivering your ideas rather than worrying about formatting. With a variety of designs to choose from, you are sure to find one that suits your needs. And with animations and unique photos, illustrations, and fonts, you can make your presentation pop. So whether you are giving a sales pitch or presenting to the board, make sure to check out Slidegeeks first
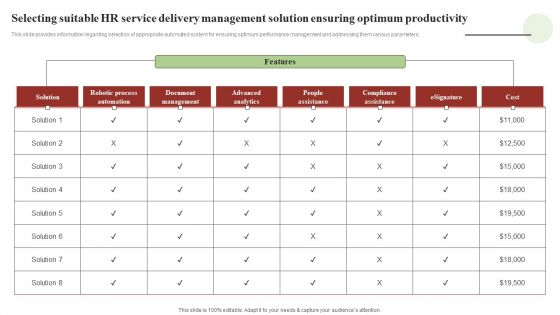
Transforming Human Resource Service Delivery Procedure Selecting Suitable HR Service Delivery Management Infographics PDF
This slide provides information regarding selection of appropriate automated system for ensuring optimum performance management and addressing them various parameters. Slidegeeks is here to make your presentations a breeze with Transforming Human Resource Service Delivery Procedure Selecting Suitable HR Service Delivery Management Infographics PDF With our easy to use and customizable templates, you can focus on delivering your ideas rather than worrying about formatting. With a variety of designs to choose from, you are sure to find one that suits your needs. And with animations and unique photos, illustrations, and fonts, you can make your presentation pop. So whether you are giving a sales pitch or presenting to the board, make sure to check out Slidegeeks first.

Factors Influencing Revenue Projections Planning Summary Pdf
This slide showcase sales budget planning factors through which manager analyze long-term trends and production capacity of business. It includes factors such as market analysis, sales forecast, pricing strategy, product portfolio, marketing and advertisement. Showcasing this set of slides titled Factors Influencing Revenue Projections Planning Summary Pdf The topics addressed in these templates are Market Analysis, Sales Forecast, Pricing Strategy All the content presented in this PPT design is completely editable. Download it and make adjustments in color, background, font etc. as per your unique business setting.

Lead Generation Digital Promotion Success Metrics Portrait PDF
The slide highlights the KPIs to measure success rate of the lead generation campaign for predicting future sales. Various metrics included are marketing qualified leads, sales and time on site. Persuade your audience using this Lead Generation Digital Promotion Success Metrics Portrait PDF. This PPT design covers Three stages, thus making it a great tool to use. It also caters to a variety of topics including Marketing Qualified Leads, Sales. Download this PPT design now to present a convincing pitch that not only emphasizes the topic but also showcases your presentation skills.

Information Analysis And BI Playbook How To Overcome Automated Data Analysis Powered By Ml Challenges Clipart PDF
This template illustrates that automated discovery of insights utilizes machine learning algorithms to analyze billions of data points in seconds to perform complex segmentation, anomaly detection, and trend-based analysis without coding. Make sure to capture your audiences attention in your business displays with our gratis customizable Information Analysis And BI Playbook How To Overcome Automated Data Analysis Powered By Ml Challenges Clipart PDF. These are great for business strategies, office conferences, capital raising or task suggestions. If you desire to acquire more customers for your tech business and ensure they stay satisfied, create your own sales presentation with these plain slides.

Financial Data Analysis Sample Diagram Presentation Slide
This is a financial data analysis sample diagram presentation slide. This is a four stage process. The stages in this process are finance, sales and marketing, operations, credit and risk.
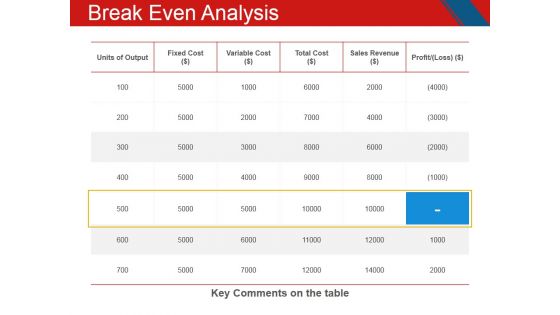
Break Even Analysis Ppt PowerPoint Presentation Inspiration Templates
This is a break even analysis ppt powerpoint presentation inspiration templates. This is a five stage process. The stages in this process are units of output, fixed cost, variable cost, total cost, sales revenue, profit.
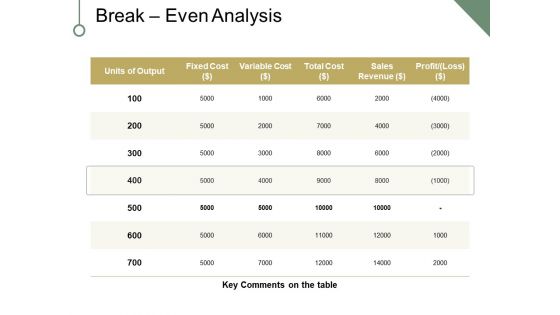
Break Even Analysis Ppt PowerPoint Presentation Portfolio Clipart
This is a break even analysis ppt powerpoint presentation portfolio clipart. This is a five stage process. The stages in this process are fixed cost, variable cost, sales revenue, profit, key comments on the table, units of output.
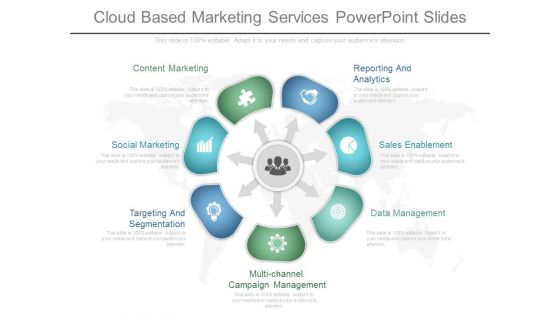
Cloud Based Marketing Services Powerpoint Slides
This is a cloud based marketing services powerpoint slides. This is a seven stage process. The stages in this process are content marketing, social marketing, targeting and segmentation, multi channel campaign management, data management, sales enablement, reporting and analytics.
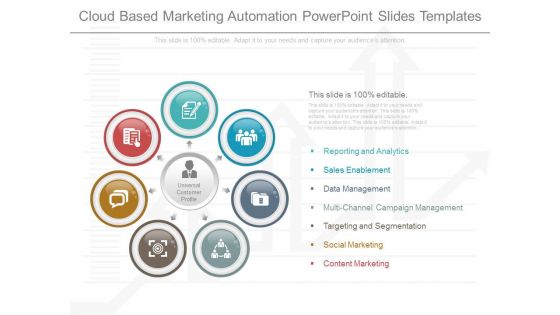
Cloud Based Marketing Automation Powerpoint Slides Templates
This is a cloud based marketing automation powerpoint slides templates. This is a seven stage process. The stages in this process are reporting and analytics, sales enablement, data management, multi channel campaign management, targeting and segmentation, social marketing, content marketing.

Channel Kpis Ppt PowerPoint Presentation Background Designs
This is a channel kpis ppt powerpoint presentation background designs. This is a four stage process. The stages in this process are sales density, personnel cost, real estate cost, inventory turnover, supermarkets, soft discount, cost reduction, hard discount.
Erp Criteria List Functional Requirement Ppt PowerPoint Presentation Icon Gallery
This is a erp criteria list functional requirement ppt powerpoint presentation icon gallery. This is a five stage process. The stages in this process are functional criteria, marketing, sales planning, marketing planning, product management.

Erp Criteria List Functional Requirement Ppt PowerPoint Presentation Model Outfit
This is a erp criteria list functional requirement ppt powerpoint presentation model outfit. This is a five stage process. The stages in this process are functional criteria, marketing, sales planning, marketing planning, product management.

Kpis And Operations Metrics Presentation Powerpoint Example
This is a kpis and operations metrics presentation powerpoint example. This is a five stage process. The stages in this process are customer class, affiliate, sales by warehouse, warehouse, profit by affiliate.

Channel Kpis Template 1 Ppt PowerPoint Presentation Infographic Template Elements
This is a channel kpis template 1 ppt powerpoint presentation infographic template elements. This is a four stage process. The stages in this process are channel kpis, sales density, personnel cost, real estate cost, inventory turnover.
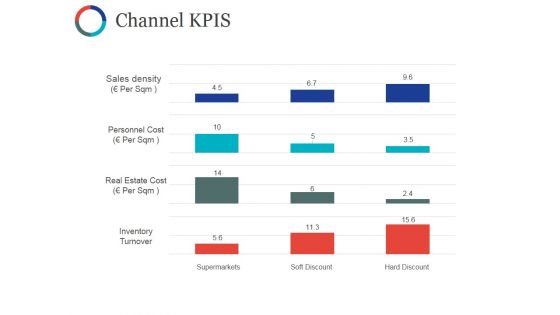
Channel Kpis Template Ppt PowerPoint Presentation Show Portfolio
This is a channel kpis template ppt powerpoint presentation show portfolio. This is a four stage process. The stages in this process are sales density, personnel cost, real estate cost, inventory turnover.
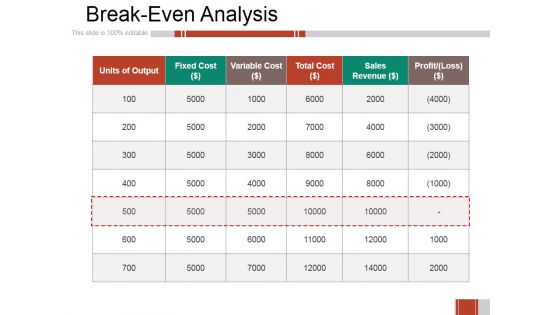
Breakeven Analysis Ppt PowerPoint Presentation Professional Design Templates
This is a breakeven analysis ppt powerpoint presentation professional design templates. This is a six stage process. The stages in this process are units of output, fixed cost, variable cost, total cost, sales revenue.
Kpis Deriving Demand Driven Manufacturing Operations Icons PDF
This slide represents the metrics which drive actions for demand driven manufacturing operations. It includes details related to operations, supplier, customer sales and quality. Showcasing this set of slides titled Kpis Deriving Demand Driven Manufacturing Operations Icons PDF. The topics addressed in these templates are Operations, Supplier, Customer Or Sales, Quality. All the content presented in this PPT design is completely editable. Download it and make adjustments in color, background, font etc. as per your unique business setting.
Bulb With Business Analysis Icons Powerpoint Templates
This PowerPoint slide contains graphics of bulb diagram with icons. It helps to exhibit concepts of sales planning. Use this diagram to impart more clarity to data and to create more sound impact on viewers.

Public Relations Pr For Customer Acquisition Ppt PowerPoint Presentation Backgrounds
This is a public relations pr for customer acquisition ppt powerpoint presentation backgrounds. This is a five stage process. The stages in this process are personal selling, direct marketing, internet marketing, public relations, sales promotions.
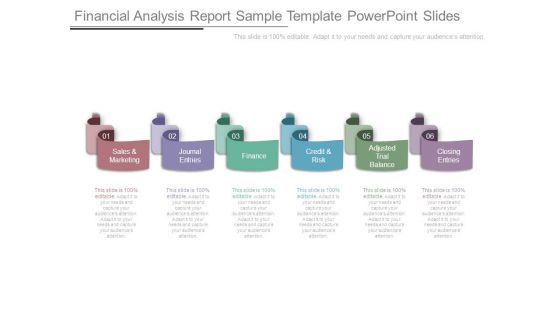
Financial Analysis Report Sample Template Powerpoint Slides
This is a financial analysis report sample template powerpoint slides. This is a six stage process. The stages in this process are sales and marketing, journal entries, finance, credit and risk, adjusted trial balance, closing entries.
Key Questions For Customer Data Analysis Icons PDF
This slide list the win loss questions that must be asked for improving organizations messaging, positioning, packaging, pricing, and sales practices. Persuade your audience using this key questions for customer data analysis icons pdf. This PPT design covers five stages, thus making it a great tool to use. It also caters to a variety of topics including sales, practices, messaging, positioning. Download this PPT design now to present a convincing pitch that not only emphasizes the topic but also showcases your presentation skills.

Market Trends Ppt PowerPoint Presentation Model Background Images
This is a market trends ppt powerpoint presentation model background images. This is a two stage process. The stages in this process are our analysis, montana, texas, sales in texas.
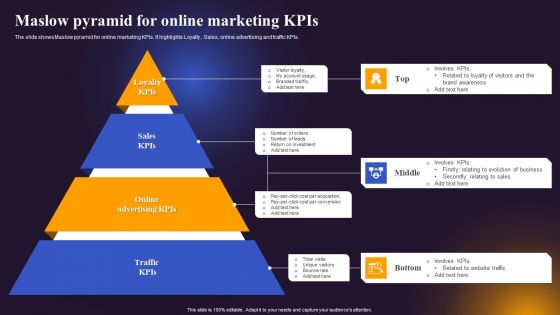
Maslow Pyramid For Online Marketing Kpis Structure PDF
The slide shows Maslow pyramid for online marketing KPIs. It highlights Loyalty , Sales, online advertising and traffic KPIs. Presenting Maslow Pyramid For Online Marketing Kpis Structure PDF to dispense important information. This template comprises four stages. It also presents valuable insights into the topics including Loyalty Kpis, Sales Kpis, Online Advertising Kpis. This is a completely customizable PowerPoint theme that can be put to use immediately. So, download it and address the topic impactfully.
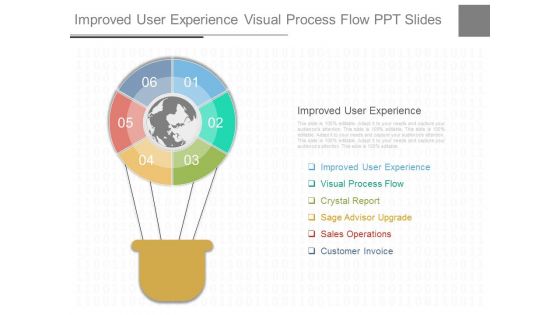
Improved User Experience Visual Process Flow Ppt Slides
This is a improved user experience visual process flow ppt slides. This is a six stage process. The stages in this process are improved user experience, visual process flow, crystal report, sage advisor upgrade, sales operations, customer invoice.

Creating Positioning Techniques For Market Research Product Launch Campaign To Capture New Customers Elements PDF
The following slide outlines overview of product launch campaign through which firms can successfully acquire new clients and increase sales. Information covered in this slide is related to product and campaign details, target audience, techniques, and key performance indicators KPIs From laying roadmaps to briefing everything in detail, our templates are perfect for you. You can set the stage with your presentation slides. All you have to do is download these easy to edit and customizable templates. Creating Positioning Techniques For Market Research Product Launch Campaign To Capture New Customers Elements PDF will help you deliver an outstanding performance that everyone would remember and praise you for. Do download this presentation today.
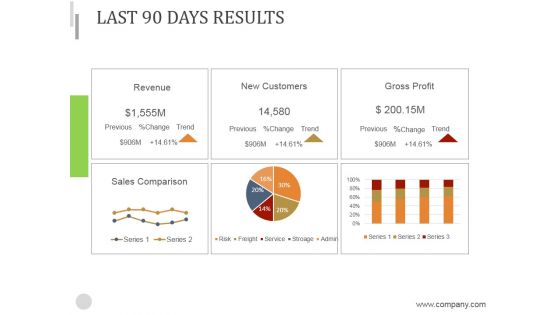
Last 90 Days Results Ppt PowerPoint Presentation Introduction
This is a last 90 days results ppt powerpoint presentation introduction. This is a six stage process. The stages in this process are revenue, new customers, gross profit, sales comparison.
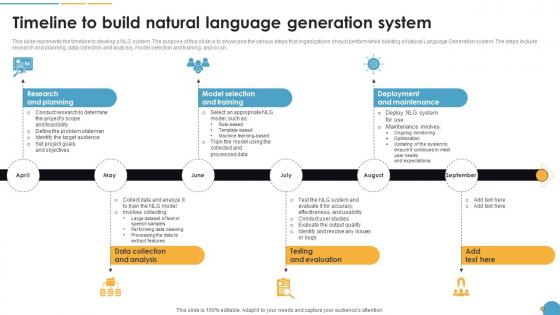
Timeline To Build Natural Language Generation System Natural Language Automation
This slide represents the timeline to develop a NLG system. The purpose of this slide is to showcase the various steps that organizations should perform while building a Natural Language Generation system. The steps include research and planning, data collection and analysis, model selection and training, and so on. Make sure to capture your audiences attention in your business displays with our gratis customizable Timeline To Build Natural Language Generation System Natural Language Automation. These are great for business strategies, office conferences, capital raising or task suggestions. If you desire to acquire more customers for your tech business and ensure they stay satisfied, create your own sales presentation with these plain slides.

Timeline To Build Natural Automated Content Generation PPT Template
This slide represents the timeline to develop a NLG system. The purpose of this slide is to showcase the various steps that organizations should perform while building a Natural Language Generation system. The steps include research and planning, data collection and analysis, model selection and training, and so on. Make sure to capture your audiences attention in your business displays with our gratis customizable Timeline To Build Natural Automated Content Generation PPT Template. These are great for business strategies, office conferences, capital raising or task suggestions. If you desire to acquire more customers for your tech business and ensure they stay satisfied, create your own sales presentation with these plain slides.
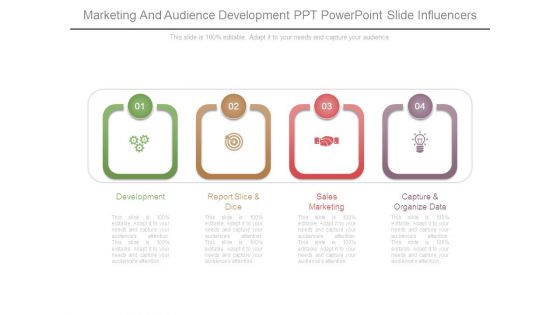
Marketing And Audience Development Ppt Powerpoint Slide Influencers
This is a marketing and audience development ppt powerpoint slide influencers. This is a four stage process. The stages in this process are development, report slice and dice, sales marketing, capture and organize data.
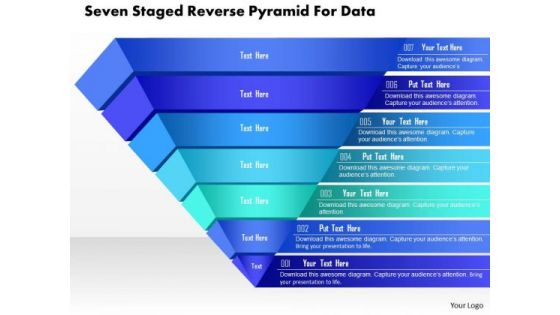
Business Diagram Seven Staged Reverse Pyramid For Data Presentation Template
This business slide is designed with seven staged pyramid diagram. Download this professional slide to depict sales and marketing analysis. This image slide is best to present your newer thoughts.
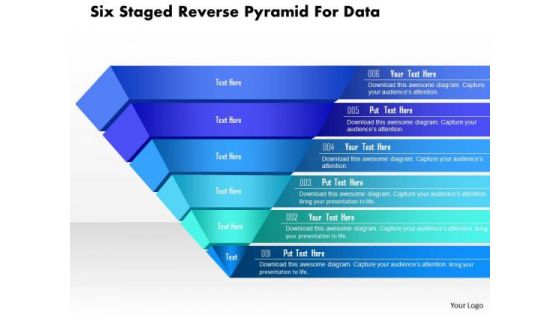
Business Diagram Six Staged Reverse Pyramid For Data Presentation Template
This business slide is designed with six staged pyramid diagram. Download this professional slide to depict sales and marketing analysis. This image slide is best to present your newer thoughts.

Campaign Report Ppt PowerPoint Presentation Infographic Template Images
This is a campaign report ppt powerpoint presentation infographic template images. This is a five stage process. The stages in this process are sales promo, email name, recipients, spam, delivered.
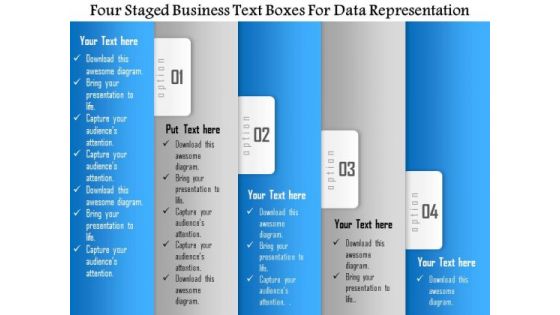
Business Diagram Four Staged Business Text Boxes For Data Representation Presentation Template
Four staged business text boxes are used to design this Power Point template slide. This PPT slide contains the concept of data representation. Use this PPT slide for your business and sales data analysis related topics in any presentation.
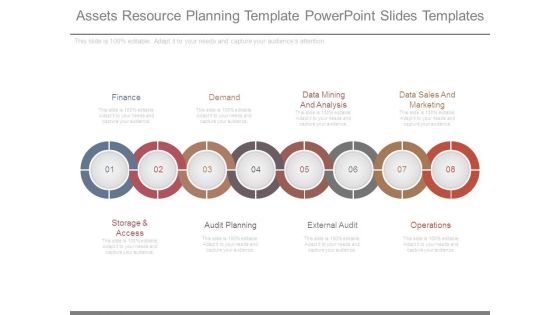
Assets Resource Planning Template Powerpoint Slides Templates
This is a assets resource planning template powerpoint slides templates. This is a eight stage process. The stages in this process are finance, storage and access, demand, data mining and analysis, external audit, data sales and marketing, operations.
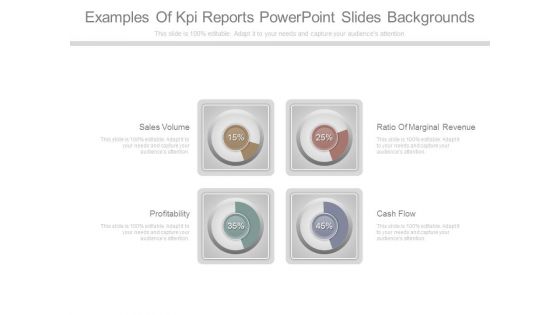
Examples Of Kpi Reports Powerpoint Slides Backgrounds
This is a examples of kpi reports powerpoint slides backgrounds. This is a four stage process. The stages in this process are sales volume, profitability, ratio of marginal revenue, cash flow.

Demand Creation Template Ppt PowerPoint Presentation Slides Clipart
This is a demand creation template ppt powerpoint presentation slides clipart. This is a three stage process. The stages in this process are demand creation, winning opportunities, account management, sales process.

Application Areas Of User Data Consolidation Designs PDF

Stock Photo Design Of Business Reports And Charts PowerPoint Slide
This image slide has been professionally designed to give complete look to your business presentations. This image is designed with graphics of business reports and charts. Use this image in marketing and sales related presentations.

Stock Photo Design Of Financial Charts And Reports PowerPoint Slide
This image slide has been professionally designed to give complete look to your business presentations. This image is designed with graphics of business reports and charts. Use this image in marketing and sales related presentations.

Stock Photo Graphics For Business Reports And Charts PowerPoint Slide
This image contains graphics of business reports and charts. Download this image for business and sales presentations where you have to focus on financial growth. Dazzle the audience with your thoughts.
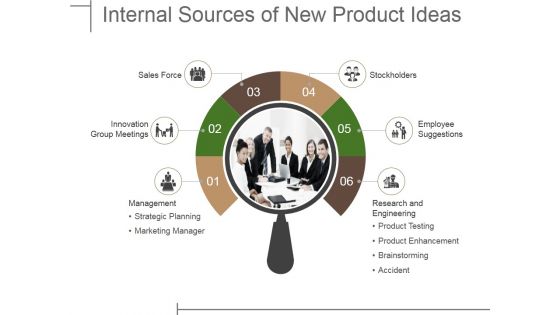
Internal Sources Of New Product Ideas Ppt PowerPoint Presentation Infographics Graphics Download
This is a internal sources of new product ideas ppt powerpoint presentation infographics graphics download. This is a six stage process. The stages in this process are sales force, innovation group meetings, management, stockholders, employee suggestions.
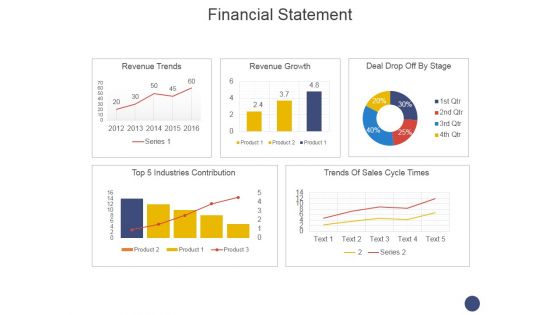
Financial Statement Ppt PowerPoint Presentation Professional Clipart
This is a financial statement ppt powerpoint presentation professional clipart. This is a five stage process. The stages in this process are revenue trends, revenue growth, deal drop off by stage, trends of sales cycle times.

Tools For Prioritization Table Of Contents Ppt PowerPoint Presentation Inspiration Example PDF
Presenting tools for prioritization table of contents ppt powerpoint presentation inspiration example pdf to provide visual cues and insights. Share and navigate important information on one stages that need your due attention. This template can be used to pitch topics like business performance overview, major challenges faced firm, prioritization tools, project management, deal management tools, workflow management tools, time management tools, training and budget, dashboards to measure impact. In addition, this PPT design contains high-resolution images, graphics, etc, that are easily editable and available for immediate download.

Define Campaign Portfolio Result Data Ppt Design Templates
This is a define campaign portfolio result data ppt design templates. This is a five stage process. The stages in this process are define market targets, account specific plan, define campaign portfolio, sales alignment training, result data.
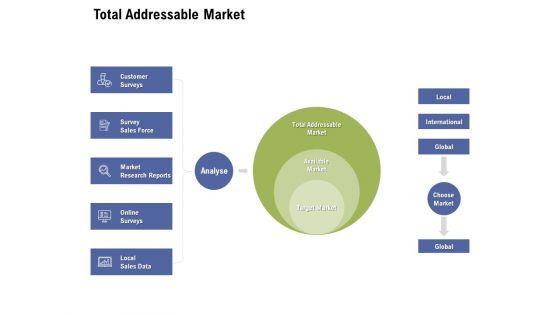
Total Addressable Market Ppt PowerPoint Presentation Infographics Template
Presenting this set of slides with name total addressable market ppt powerpoint presentation infographics template. This is a three stage process. The stages in this process are customer surveys, survey sales force, market research reports, online surveys, local, sales data, target market, total addressable market, choose market, global, international. This is a completely editable PowerPoint presentation and is available for immediate download. Download now and impress your audience.

Financial Statement Ppt PowerPoint Presentation Outline File Formats
This is a financial statement ppt powerpoint presentation outline file formats. This is a five stage process. The stages in this process are trends of sales cycle times, quarter over quarter revenue growth, revenue trends, deal drop off by stage.
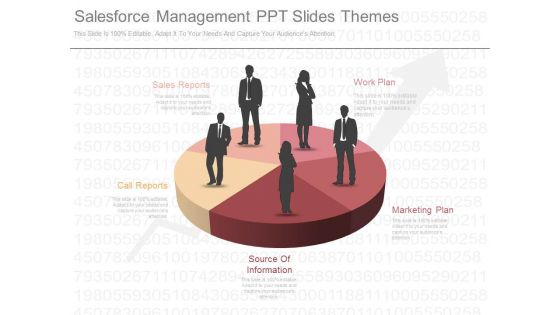
Salesforce Management Ppt Slides Themes
This is a salesforce management ppt slides themes. This is a five stage process. The stages in this process are sales reports, work plan, marketing plan, source of information, call reports.

Convertible Preferred Stock Funding Pitch Deck Competitive Analysis By Financial And Operational Data Brochure PDF
The slide provides the Competitive landscape of the company on the basis of financial data sales and profit and operational data employee count, locations, year of existence etc. Deliver an awe inspiring pitch with this creative convertible preferred stock funding pitch deck competitive analysis by financial and operational data brochure pdf bundle. Topics like sales, profit margin, service, quality, locations can be discussed with this completely editable template. It is available for immediate download depending on the needs and requirements of the user.
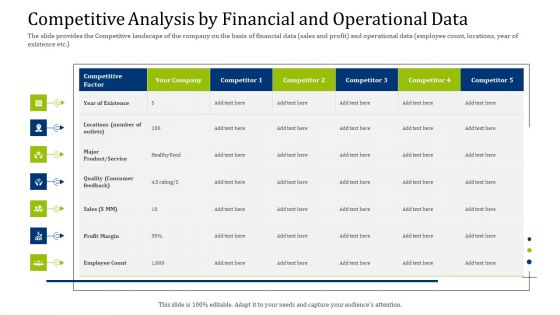
Convertible Debt Financing Pitch Deck Competitive Analysis By Financial And Operational Data Slides PDF
The slide provides the Competitive landscape of the company on the basis of financial data sales and profit and operational data employee count, locations, year of existence etc. Deliver an awe-inspiring pitch with this creative convertible debt financing pitch deck competitive analysis by financial and operational data slides pdf bundle. Topics like profit margin, employee count, sales, product, service can be discussed with this completely editable template. It is available for immediate download depending on the needs and requirements of the user.

Identify Right Customer Segments Example Ppt Slides Download
This is a identify right customer segments example ppt slides download. This is a five stage process. The stages in this process are other solutions, sales forecasting, churn modeling, customer analysis, measure data.

 Home
Home