Sales Leaderboard

Competitor Analysis Ppt PowerPoint Presentation Layouts Slideshow
This is a competitor analysis ppt powerpoint presentation layouts slideshow. This is a four stage process. The stages in this process are sales development of industry, performance indicators, sales development, revenue, sales.
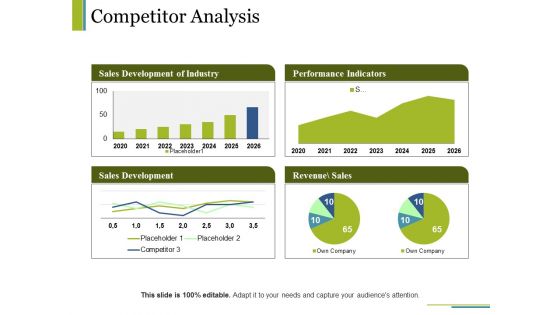
Competitor Analysis Ppt PowerPoint Presentation Visual Aids Model
This is a competitor analysis ppt powerpoint presentation visual aids model. This is a four stage process. The stages in this process are sales development of industry, performance indicators, sales development, revenue sales, business.

Competitor Analysis Ppt PowerPoint Presentation Slides Visuals
This is a competitor analysis ppt powerpoint presentation slides visuals. This is a four stage process. The stages in this process are sales development, revenue, sales, performance, indicators.

KPI Dashboard To Track Techniques Marketing Performance Of Real Estate Information PDF
Following slide demonstrates monthly real estate strategic sales progress KPI dashboard to determine business performance. It includes elements such as monthly sales comparison, yearly sales , revenue by project status, monthly sales trend, maximum sales by states and units sold by states. Showcasing this set of slides titled KPI Dashboard To Track Techniques Marketing Performance Of Real Estate Information PDF. The topics addressed in these templates are Revenue By Status, Monthly Sales Comparison, Monthly Sales Trend. All the content presented in this PPT design is completely editable. Download it and make adjustments in color, background, font etc. as per your unique business setting.
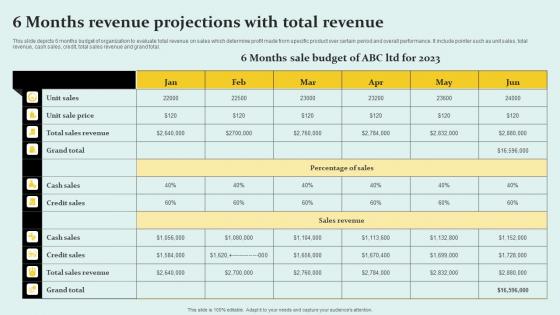
6 Months Revenue Projections With Total Revenue Sample Pdf
This slide depicts 6 months budget of organization to evaluate total revenue on sales which determine profit made from specific product over certain period and overall performance. It include pointer such as unit sales, total revenue, cash sales, credit, total sales revenue and grand total. Showcasing this set of slides titled 6 Months Revenue Projections With Total Revenue Sample Pdf The topics addressed in these templates are Sales Revenue, Percentage Of Sales, Cash Sales All the content presented in this PPT design is completely editable. Download it and make adjustments in color, background, font etc. as per your unique business setting.
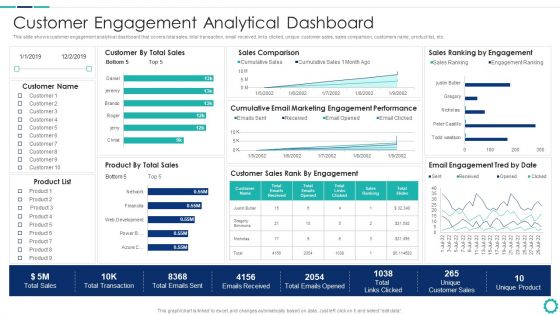
Creating Successful Strategies To Enhance Customer Experience Customer Engagement Analytical Dashboard Slides PDF
This slide shows customer engagement analytical dashboard that covers total sales, total transaction, email received, links clicked, unique customer sales, sales comparison, customers name, product list, etc.Deliver an awe inspiring pitch with this creative Creating Successful Strategies To Enhance Customer Experience Customer Engagement Analytical Dashboard Slides PDF bundle. Topics like Sales Comparison, Engagement Performance, Customer Sales can be discussed with this completely editable template. It is available for immediate download depending on the needs and requirements of the user.

B2B Marketing Content Administration Playbook Bonus Mechanism Structure PDF
This slide provides information regarding bonus scheme for senior sales management team including VP Sales, Sales Manager, Account Executives, Sales Development Representatives, etc. Deliver and pitch your topic in the best possible manner with this b2b marketing content administration playbook bonus mechanism structure pdf Use them to share invaluable insights on account executive, sales development representative, based on team performance and impress your audience. This template can be altered and modified as per your expectations. So, grab it now.

Loyalty Program Performance Dashboard Ppt PowerPoint Presentation Summary Grid
This is a loyalty program performance dashboard ppt powerpoint presentation summary grid. This is a six stage process. The stages in this process are average sale by loyalty member type, average award by customer, all orders by promotions, average sale by loyalty segment, sales by channel.

Competitor Analysis Ppt PowerPoint Presentation Outline Ideas
This is a competitor analysis ppt powerpoint presentation outline ideas. This is a four stage process. The stages in this process are sales development of industry, revenue, sales, performance indicators.

Solution Design Education Powerpoint Slide Backgrounds
This is a solution design education powerpoint slide backgrounds. This is a four stage process. The stages in this process are sales performance analysis, sales activity reports, solution design education, customer interaction.

Channel Management Program Template Slides
This is a channel management program template slides. This is a six stage process. The stages in this process are sales operations, channel management, marketing, new product introduction, sales productivity, service performance management.

Channel Practices And Research Diagram Ppt Diagrams
This is a channel practices and research diagram ppt diagrams. This is a six stage process. The stages in this process are marketing, sales operations, channel management, new product introduction, performance center, sales productivity.
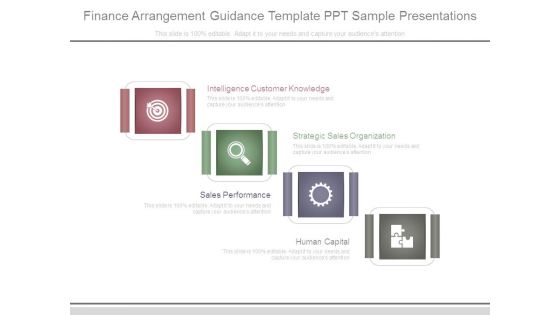
Finance Arrangement Guidance Template Ppt Sample Presentations
This is a finance arrangement guidance template ppt sample presentations. This is a four stage process. The stages in this process are intelligence customer knowledge, strategic sales organization, sales performance, human capital.

Business Drivers Diagram Presentation Background Images
This is a business drivers diagram presentation background images. This is a five stage process. The stages in this process are business process, lead generation, sales activates, sales pipeline management, revenue performance.
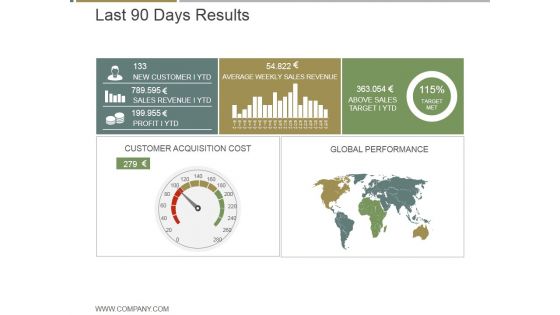
Last 90 Days Results Ppt PowerPoint Presentation Graphics
This is a last 90 days results ppt powerpoint presentation graphics. This is a five stage process. The stages in this process are new customer ytd, average weekly sales revenue, above sales target i ytd, customer acquisition cost, global performance.
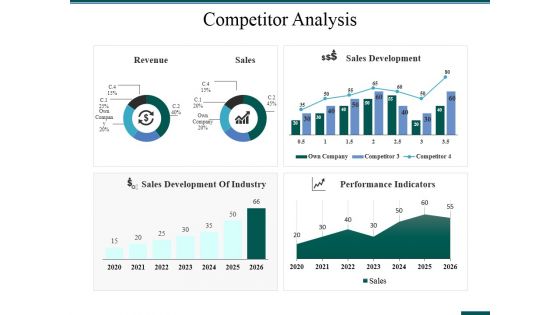
Competitor Analysis Ppt PowerPoint Presentation Model Visual Aids
This is a competitor analysis ppt powerpoint presentation model visual aids. This is a four stage process. The stages in this process are competitor analysis, revenue, sales, sales development, performance indicators.
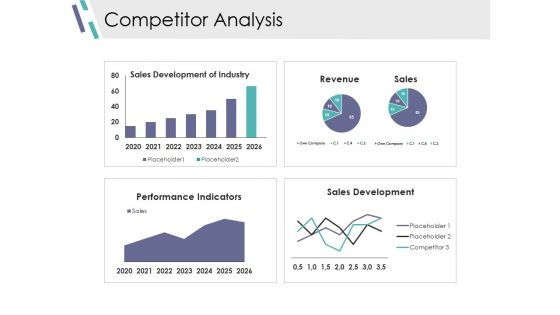
Competitor Analysis Ppt PowerPoint Presentation Layouts Background Images
This is a competitor analysis ppt powerpoint presentation layouts background images. This is a four stage process. The stages in this process are sales development of industry, revenue, performance indicators, sales development.
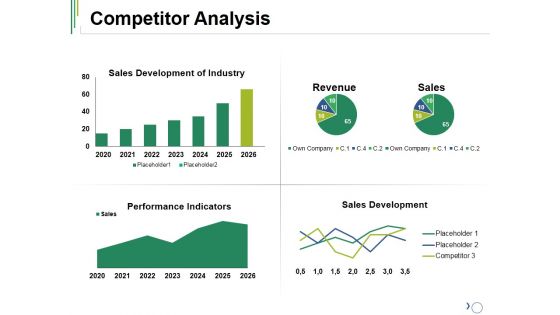
Competitor Analysis Ppt PowerPoint Presentation File Influencers
This is a competitor analysis ppt powerpoint presentation file influencers. This is a four stage process. The stages in this process are revenue, sales, placeholder, performance indicators, sales development.
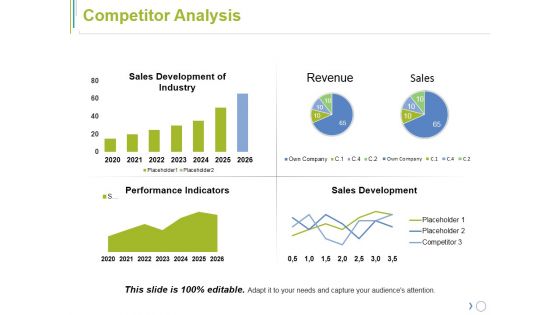
Competitor Analysis Ppt PowerPoint Presentation File Mockup
This is a competitor analysis ppt powerpoint presentation file mockup. This is a four stage process. The stages in this process are sales development of industry, revenue, performance indicators, sales development.
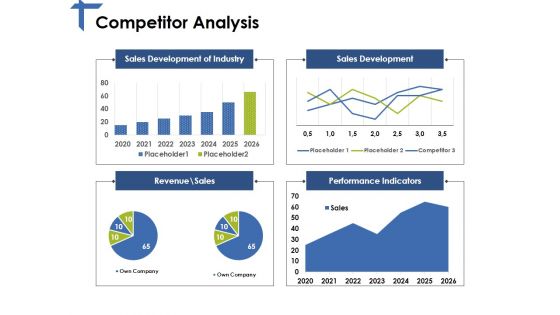
Competitor Analysis Ppt PowerPoint Presentation Professional Designs
This is a competitor analysis ppt powerpoint presentation professional designs. This is a four stage process. The stages in this process are sales development of industry, sales development, performance indicators, revenue.

Content Ppt PowerPoint Presentation Infographics Diagrams
This is a content ppt powerpoint presentation infographics diagrams. This is a thirteen stage process. The stages in this process are business highlights, financial highlights, products offering, sales performance dashboard, sales revenue by region.

KPI Dashboard To Measure Commodity Expansionstrategy Performance Mockup PDF
This slide signifies the key performance indicator dashboard to evaluate commodity market growth performance. It covers information about sales revenue, customer, avg transaction price and new sales by division.Showcasing this set of slides titled KPI Dashboard To Measure Commodity Expansionstrategy Performance Mockup PDF. The topics addressed in these templates are Highest Sales, Sales Division, New Collections. All the content presented in this PPT design is completely editable. Download it and make adjustments in color, background, font etc. as per your unique business setting.
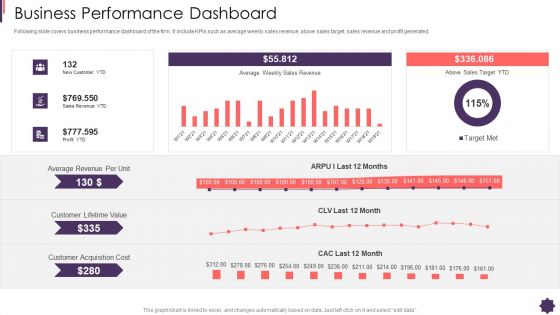
Business Performance Dashboard Brand Techniques Structure Introduction PDF
Following slide covers business performance dashboard of the firm. It include KPIs such as average weekly sales revenue, above sales target, sales revenue and profit generated. Deliver an awe inspiring pitch with this creative business performance dashboard brand techniques structure introduction pdf bundle. Topics like average, revenue, sales, profit, cost can be discussed with this completely editable template. It is available for immediate download depending on the needs and requirements of the user.

Table Of Contents For Marketing Playbook To Maximize Roi Elements PDF
Presenting table of contents for marketing playbook to maximize roi elements pdf to provide visual cues and insights. Share and navigate important information on seven stages that need your due attention. This template can be used to pitch topics like sales pitching through content, managing sales workforce, selecting effective sales methodology, metrics and dashboard for sales performance tracking. In addtion, this PPT design contains high resolution images, graphics, etc, that are easily editable and available for immediate download.

Execution And Delivery Powerpoint Slides Themes
This is a execution and delivery powerpoint slides themes. This is a eight stage process. The stages in this process are sales activity management system, needs analysis and solution design, execution and delivery, support and maintenance, task coordination, sales performance analysis, sales activity reports, solution design education.

B2B Marketing KPI Dashboard INSIGHT Ppt Ideas Information PDF
Deliver an awe-inspiring pitch with this creative b2b marketing kpi dashboard insight ppt ideas information pdf bundle. Topics like revenue breakdown, leads region, sales reps leads, sales representatives leads actual, sales results identify individual performance can be discussed with this completely editable template. It is available for immediate download depending on the needs and requirements of the user.
SFA Dashboard To Track Performance Ppt PowerPoint Presentation Icon Example File PDF
This Slide visually represents sales force automation dashboard to track performance which can be utilized by marketing managers to streamline the process of automated selling. It includes information about sales pipeline, competitors, opportunities, key competitors, etc. Pitch your topic with ease and precision using this sfa dashboard to track performance ppt powerpoint presentation icon example file pdf. This layout presents information on sales pipeline, sales pipeline by sales rep, key competitors, forecast by month, key opportunities. It is also available for immediate download and adjustment. So, changes can be made in the color, design, graphics or any other component to create a unique layout.
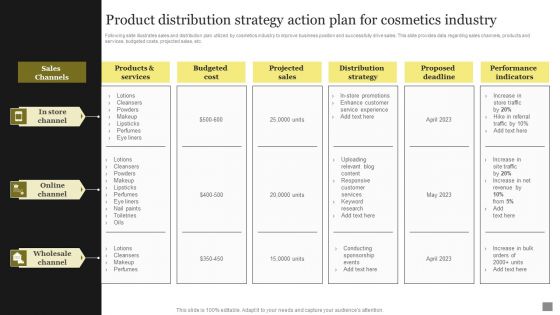
Product Distribution Strategy Action Plan For Cosmetics Industry Mockup PDF
Following slide illustrates sales and distribution plan utilized by cosmetics industry to improve business position and successfully drive sales. This slide provides data regarding sales channels, products and services, budgeted costs, projected sales, etc. Pitch your topic with ease and precision using this Product Distribution Strategy Action Plan For Cosmetics Industry Mockup PDF. This layout presents information on Performance Indicators, Distribution Strategy, Projected Sales. It is also available for immediate download and adjustment. So, changes can be made in the color, design, graphics or any other component to create a unique layout.
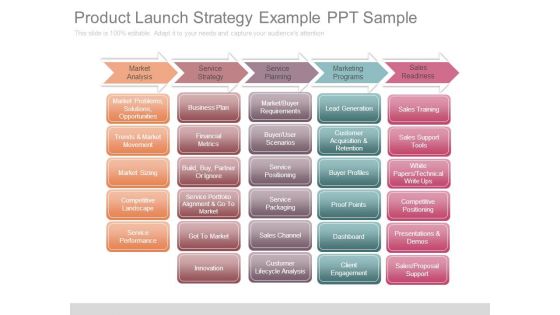
Product Launch Strategy Example Ppt Sample
This is a product launch strategy example ppt sample. This is a five stage process. The stages in this process are market analysis, service strategy, service planning, marketing programs, sales readiness, market problems solutions opportunities, trends and market movement, market sizing, competitive landscape, service performance, business plan, financial metrics, build buy partner or ignore, service portfolio alignment and go to market, got to market, innovation, market buyer requirements, buyer user scenarios, service positioning, service packaging, sales channel, customer lifecycle analysis, lead generation, customer acquisition and retention, buyer profiles, proof points, dashboard, client engagement, sales training, sales support tools, white papers technical write ups, competitive positioning, presentations and demos, sales proposal support.
Performance Analysis Of New Product Development Product Performance Dashboards Icons PDF
The following slide displays the dashboard which highlights the performance of the product, multiple metrics such as Revenues, New customer, gross profit, customer satisfaction and global sales breakdown. Deliver and pitch your topic in the best possible manner with this performance analysis of new product development product performance dashboards icons pdf. Use them to share invaluable insights on revenue, sales comparison, customer satisfaction, gross profit, new customers, sale by product category and impress your audience. This template can be altered and modified as per your expectations. So, grab it now.

Business Performance Review Dashboard To Measure Overall Business Performance Formats PDF
The following slide highlights a comprehensive quarterly business review QBR dashboard which can be used by the organization to evaluate business performance. The metrics used for review are total revenue, new customers, gross profit, overall costs, sales comparison, sales by different products and top performing channels. Showcasing this set of slides titled Business Performance Review Dashboard To Measure Overall Business Performance Formats PDF. The topics addressed in these templates are Sales Comparison, Sales Product, High Performing. All the content presented in this PPT design is completely editable. Download it and make adjustments in color, background, font etc. as per your unique business setting.
Key Performance Indicators For Smarketing Ppt Icon Graphic Images PDF
This slide shows various KPIs which can be used to measure marketing and sales alignment. These are overall revenue, sales cycle length, marketing qualified leads, etc. Presenting Key Performance Indicators For Smarketing Ppt Icon Graphic Images PDF to dispense important information. This template comprises one stages. It also presents valuable insights into the topics including KPIs, Overall Revenue, Sales Cycle Length. This is a completely customizable PowerPoint theme that can be put to use immediately. So, download it and address the topic impactfully.

Analytical Incrementalism Business Performance Measurement Metrics Download PDF
The purpose of this slide is to provide a glimpse about the business marketing performance measurement metrics after logical incrementalism approach. Deliver an awe-inspiring pitch with this creative analytical incrementalism business performance measurement metrics download pdf bundle. Topics like sales revenue, new customer, sales growth, sales region performance, profit can be discussed with this completely editable template. It is available for immediate download depending on the needs and requirements of the user.

Brand Development Manual Business Performance KPI Dashboard Background PDF
Following slide covers business performance dashboard of the firm. It include KPIs such as average weekly sales revenue, above sales target, sales revenue and profit generated.Deliver an awe inspiring pitch with this creative Brand Development Manual Business Performance KPI Dashboard Background PDF bundle. Topics like Business Performance KPI Dashboard can be discussed with this completely editable template. It is available for immediate download depending on the needs and requirements of the user.
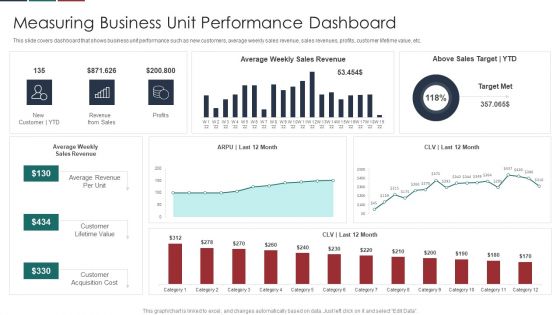
Deliver Efficiency Innovation Measuring Business Unit Performance Dashboard Background PDF
This slide covers dashboard that shows business unit performance such as new customers, average weekly sales revenue, sales revenues, profits, customer lifetime value, etc. Deliver an awe inspiring pitch with this creative Deliver Efficiency Innovation Measuring Business Unit Performance Dashboard Background PDF bundle. Topics like Customer Lifetime Value, Customer Acquisition Cost, Average Revenue Per Unit, Above Sales Target YTD can be discussed with this completely editable template. It is available for immediate download depending on the needs and requirements of the user.
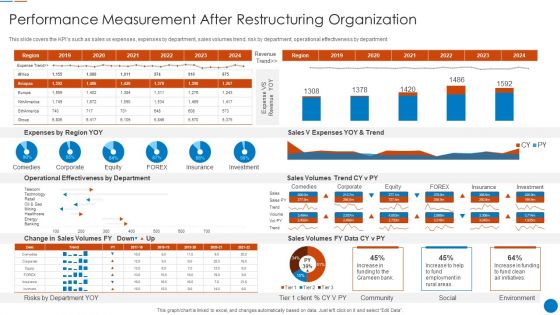
Organizational Restructuring Process Performance Measurement After Restructuring Organization Download PDF
This slide covers the KPIs such as sales vs expenses, expenses by department, sales volumes trend, risk by department, operational effectiveness by department Deliver an awe inspiring pitch with this creative Organizational Restructuring Process Performance Measurement After Restructuring Organization Download PDF bundle. Topics like Operational Effectiveness Department, Expenses By Region, Sales Volumes can be discussed with this completely editable template. It is available for immediate download depending on the needs and requirements of the user.

Business Restructuring Performance Measurement After Business Restructuring Themes PDF
This slide covers the KPIs such as sales vs expenses, expenses by department, sales volumes trend, risk by department, operational effectiveness by department. Deliver an awe inspiring pitch with this creative Business Restructuring Performance Measurement After Business Restructuring Themes PDF bundle. Topics like Sales V Expenses, YOY And Trend, Expenses Region YOY can be discussed with this completely editable template. It is available for immediate download depending on the needs and requirements of the user.
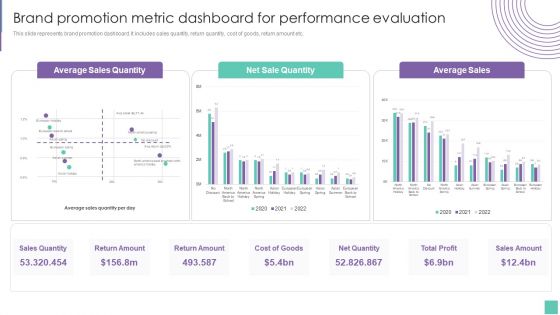
Brand Promotion Metric Dashboard For Performance Evaluation Introduce Promotion Plan Guidelines PDF
This slide represents brand promotion dashboard. It includes sales quantity, return quantity, cost of goods, return amount etc.Deliver an awe inspiring pitch with this creative Brand Promotion Metric Dashboard For Performance Evaluation Introduce Promotion Plan Guidelines PDF bundle. Topics like Average Sales, Net Quantity, Sales Amount can be discussed with this completely editable template. It is available for immediate download depending on the needs and requirements of the user.
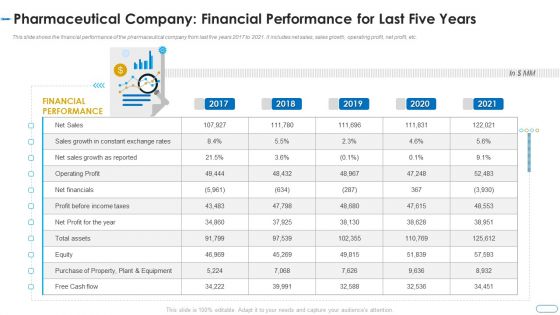
Initiatives Atmosphere Operation Problems Pharmaceutical Firm Pharmaceutical Financial Performance Clipart PDF
This slide shows the financial performance of the pharmaceutical company from last five years 2017 to 2021. It includes net sales, sales growth, operating profit, net profit, etc. Deliver and pitch your topic in the best possible manner with this initiatives atmosphere operation problems pharmaceutical firm pharmaceutical financial performance clipart pdf. Use them to share invaluable insights on financial performance, growth, sales, purchase, equipment and impress your audience. This template can be altered and modified as per your expectations. So, grab it now.
Successful Brand Development Plan Business Performance Measuring KPI Dashboard Icons PDF
Following slide covers business performance dashboard of the firm. It include KPIs such as average weekly sales revenue, above sales target, sales revenue and profit generated.Deliver and pitch your topic in the best possible manner with this successful brand development plan business performance measuring kpi dashboard icons pdf Use them to share invaluable insights on average revenue, customer lifetime value, customer acquisition cost and impress your audience. This template can be altered and modified as per your expectations. So, grab it now.

Establishing Successful Brand Strategy To Captivate Consumers Business Performance Dashboard Microsoft PDF
Following slide covers business performance dashboard of the firm. It include KPIs such as average weekly sales revenue, above sales target, sales revenue and profit generated. Deliver an awe inspiring pitch with this creative establishing successful brand strategy to captivate consumers business performance dashboard microsoft pdf bundle. Topics like customer acquisition cost, customer lifetime value, average revenue per unit can be discussed with this completely editable template. It is available for immediate download depending on the needs and requirements of the user.
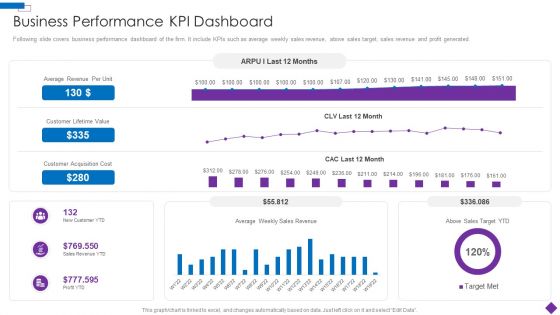
Introducing A New Product To The Market Business Performance KPI Dashboard Brochure PDF
Following slide covers business performance dashboard of the firm. It include KPIs such as average weekly sales revenue, above sales target, sales revenue and profit generated.Deliver and pitch your topic in the best possible manner with this Introducing A New Product To The Market Business Performance KPI Dashboard Brochure PDF Use them to share invaluable insights on Business Performance KPI Dashboard and impress your audience. This template can be altered and modified as per your expectations. So, grab it now.

Assuring Management In Product Innovation To Enhance Processes Measuring Business Unit Performance Dashboard Inspiration PDF
This slide covers dashboard that shows business unit performance such as new customers, average weekly sales revenue, sales revenues, profits, customer lifetime value, etc.Deliver an awe inspiring pitch with this creative assuring management in product innovation to enhance processes measuring business unit performance dashboard inspiration pdf bundle. Topics like average weekly sales revenue, customer lifetime value, customer acquisition cost can be discussed with this completely editable template. It is available for immediate download depending on the needs and requirements of the user.

Organization Chart And Corporate Model Transformation Performance Measurement After Slides PDF
This slide covers the KPIs such as sales vs expenses, expenses by department, sales volumes trend, risk by department, operational effectiveness by department. Deliver and pitch your topic in the best possible manner with this organization chart and corporate model transformation performance measurement after slides pdf. Use them to share invaluable insights on operational effectiveness by department, expenses by region yoy, sales volumes trend and impress your audience. This template can be altered and modified as per your expectations. So, grab it now.
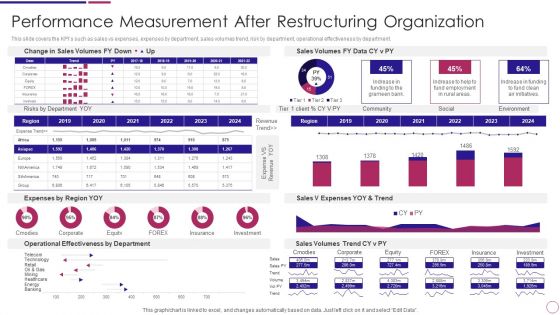
Performance Measurement After Restructuring Organization Ppt PowerPoint Presentation File Structure PDF
This slide covers the KPIs such as sales vs expenses, expenses by department, sales volumes trend, risk by department, operational effectiveness by department. Deliver an awe inspiring pitch with this creative Performance Measurement After Restructuring Organization Ppt PowerPoint Presentation File Structure PDF bundle. Topics like Sales Volumes, Operational Effectiveness, Expense Trend can be discussed with this completely editable template. It is available for immediate download depending on the needs and requirements of the user.
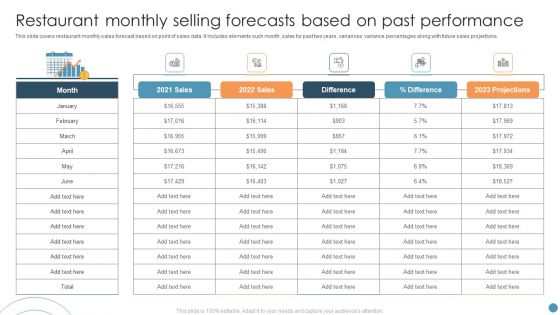
Restaurant Monthly Selling Forecasts Based On Past Performance Microsoft PDF
This slide covers restaurant monthly sales forecast based on point of sales data. It includes elements such month, sales for past two years, variances, variance percentages along with future sales projections. Showcasing this set of slides titled Restaurant Monthly Selling Forecasts Based On Past Performance Microsoft PDF. The topics addressed in these templates are Restaurant Monthly Selling Forecasts, Past Performance. All the content presented in this PPT design is completely editable. Download it and make adjustments in color, background, font etc. as per your unique business setting.
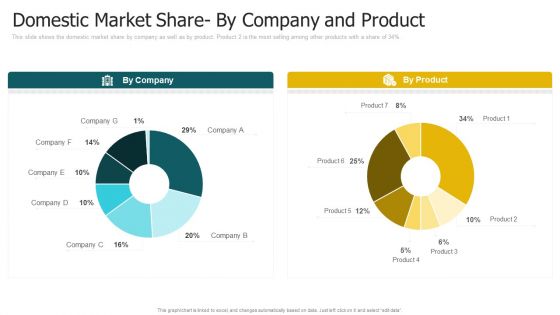
Domestic Market Share By Company And Product Brochure PDF
Following slide illustrates sales performance of the firm both yearly as well as quarterly. Number of units sold in 2020 are 61,213. Deliver and pitch your topic in the best possible manner with this domestic market share by company and product brochure pdf. Use them to share invaluable insights on yearly sales performance, quarterly sales performance and impress your audience. This template can be altered and modified as per your expectations. So, grab it now.
Tactical Planning And Analyzing Organizational Goals Icon Infographics PDF
This slide defines the dashboard for analyzing the sales key performance indicators KPIs. It includes information related to the number of sales, revenue, profit, and cost. Showcasing this set of slides titled Tactical Planning And Analyzing Organizational Goals Icon Infographics PDF. The topics addressed in these templates are Cost Breakdown, Sales Revenue, Accumulated Revenue. All the content presented in this PPT design is completely editable. Download it and make adjustments in color, background, font etc. as per your unique business setting.
Table Of Contents For Go To Market Approach For New Product Icons PDF
Presenting Table Of Contents For Go To Market Approach For New Product Icons PDF to provide visual cues and insights. Share and navigate important information on one stage that need your due attention. This template can be used to pitch topics like Annual Sales Highlights, Analyzing Sales Performance, Determining Sales Revenue In addtion, this PPT design contains high resolution images, graphics, etc, that are easily editable and available for immediate download.

Retailer Channel Partner Boot Camp Partner Scoreboard Summary Report Formats PDF
This slide covers the partner scoreboard report which Is evaluated based on their performance and overall scores. Deliver and pitch your topic in the best possible manner with this retailer channel partner boot camp partner scoreboard summary report formats pdf. Use them to share invaluable insights on sales execution, sales targeting meeting, sales target presentation and impress your audience. This template can be altered and modified as per your expectations. So, grab it now.
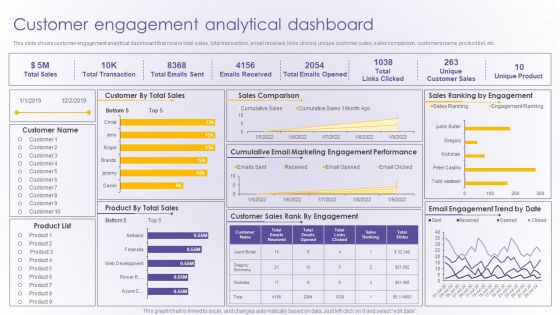
Customer Engagement Analytical Dashboard Developing Online Consumer Engagement Program Professional PDF
This slide shows customer engagement analytical dashboard that covers total sales, total transaction, email received, links clicked, unique customer sales, sales comparison, customers name, product list, etc.Deliver and pitch your topic in the best possible manner with this Customer Engagement Analytical Dashboard Developing Online Consumer Engagement Program Professional PDF. Use them to share invaluable insights on Cumulative Email, Marketing Engagement, Performance and impress your audience. This template can be altered and modified as per your expectations. So, grab it now.

Monthly Planned Vs Actual Revenue Analysis Professional Pdf
This slide showcase monthly target sales with actual sales comparison with variance percentage calculation. It include monthly performance, variance, highest sales. Showcasing this set of slides titled Monthly Planned Vs Actual Revenue Analysis Professional Pdf The topics addressed in these templates are Monthly Planned, Actual Revenue Analysis All the content presented in this PPT design is completely editable. Download it and make adjustments in color, background, font etc. as per your unique business setting.
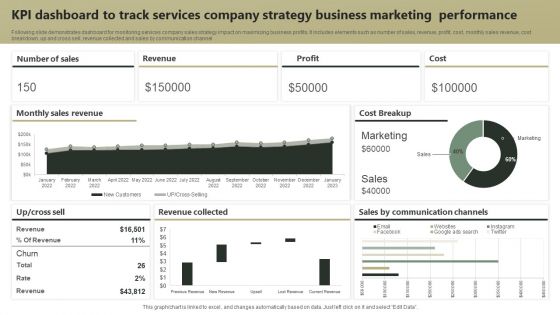
KPI Dashboard To Track Services Company Strategy Business Marketing Performance Guidelines PDF
Following slide demonstrates dashboard for monitoring services company sales strategy impact on maximizing business profits. It includes elements such as number of sales, revenue, profit, cost, monthly sales revenue, cost breakdown, up and cross sell, revenue collected and sales by communication channel. Showcasing this set of slides titled KPI Dashboard To Track Services Company Strategy Business Marketing Performance Guidelines PDF. The topics addressed in these templates are Revenue, Profit, Cost. All the content presented in this PPT design is completely editable. Download it and make adjustments in color, background, font etc. as per your unique business setting.
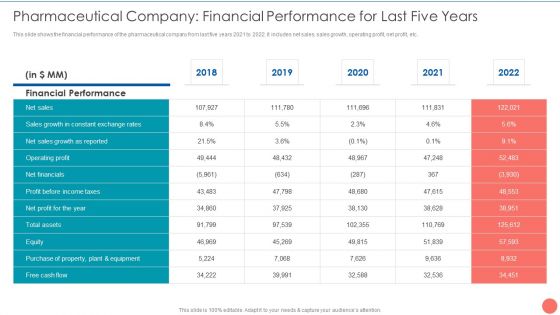
Tactics To Achieve Sustainability Pharmaceutical Company Financial Performance For Last Five Years Portrait PDF
This slide shows the financial performance of the pharmaceutical company from last five years 2021 to 2022. It includes net sales, sales growth, operating profit, net profit, etc. Deliver and pitch your topic in the best possible manner with this Tactics To Achieve Sustainability Pharmaceutical Company Financial Performance For Last Five Years Portrait PDF. Use them to share invaluable insights on Financial Performance Sales, Sales Growth Net, Constant Exchange Rates and impress your audience. This template can be altered and modified as per your expectations. So, grab it now.

Marketing And Operation Planning Dashboard To Drive Better Performance Graphics PDF
This slide covers sales and operations planning dashboard to improve performance. It involves bookings plan, year on year growth, bookings plan per year and total growth and sales made by sales manager. Showcasing this set of slides titled Marketing And Operation Planning Dashboard To Drive Better Performance Graphics PDF. The topics addressed in these templates are Sales Manager, Growth Made, Bookings Plan By Year. All the content presented in this PPT design is completely editable. Download it and make adjustments in color, background, font etc. as per your unique business setting.
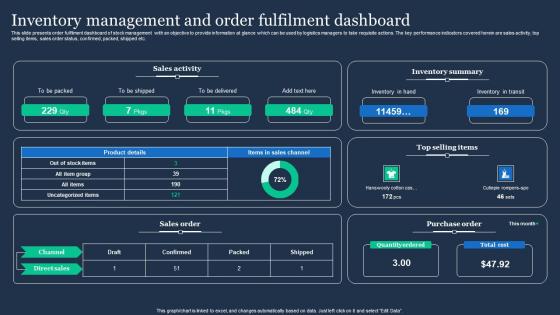
Inventory Management And Order Fulfilment Dashboard Slides Pdf
This slide presents order fulfilment dashboard of stock management with an objective to provide information at glance which can be used by logistics managers to take requisite actions. The key performance indicators covered herein are sales activity, top selling items, sales order status, confirmed, packed, shipped etc. Pitch your topic with ease and precision using this Inventory Management And Order Fulfilment Dashboard Slides Pdf. This layout presents information on Sales Activity, Inventory Summary, Sales Order. It is also available for immediate download and adjustment. So, changes can be made in the color, design, graphics or any other component to create a unique layout.
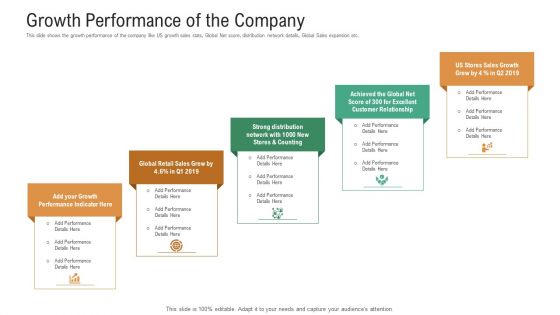
Investor Pitch Deck To Generate Venture Capital Funds Growth Performance Of The Company Ppt File Inspiration PDF
This slide shows the growth performance of the company like US growth sales stats, Global Net score, distribution network details, Global Sales expansion etc. This is a investor pitch deck to generate venture capital funds growth performance of the company ppt file inspiration pdf template with various stages. Focus and dispense information on five stages using this creative set, that comes with editable features. It contains large content boxes to add your information on topics like growth performance indicator, global retail sales, stores sales growth. You can also showcase facts, figures, and other relevant content using this PPT layout. Grab it now.
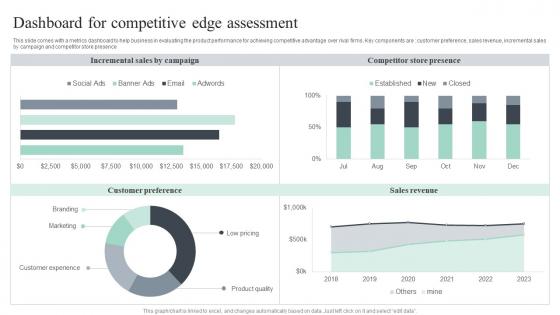
Dashboard For Competitive Edge Assessment Themes Pdf
This slide comes with a metrics dashboard to help business in evaluating the product performance for achieving competitive advantage over rival firms. Key components are customer preference, sales revenue, incremental sales by campaign and competitor store presence Pitch your topic with ease and precision using this Dashboard For Competitive Edge Assessment Themes Pdf. This layout presents information on Incremental Sales, Competitor Store Presence, Sales Revenue. It is also available for immediate download and adjustment. So, changes can be made in the color, design, graphics or any other component to create a unique layout.
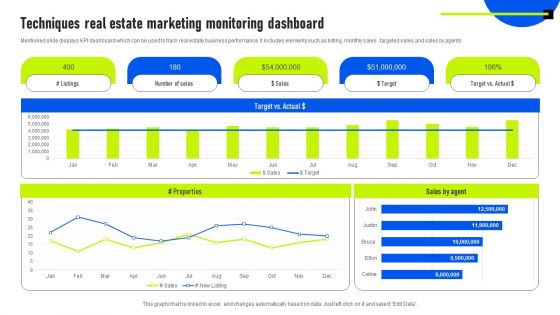
Techniques Real Estate Marketing Monitoring Dashboard Guidelines PDF
Mentioned slide displays KPI dashboard which can be used to track real estate business performance. It includes elements such as listing, monthly sales , targeted sales and sales by agents. Pitch your topic with ease and precision using this Techniques Real Estate Marketing Monitoring Dashboard Guidelines PDF. This layout presents information on Sales By Agent, Target, Marketing Monitoring Dashboard. It is also available for immediate download and adjustment. So, changes can be made in the color, design, graphics or any other component to create a unique layout.

Incentive Program Plan Based On Seasonal Demand Information PDF
This slide showcases seasonal sales commission plan. The purpose of this template is to track sales representatives performance in various seasons to fix commission rate accordingly. It includes key elements such as sales person, season, total sales, etc. along with key takeaways.Showcasing this set of slides titled Incentive Program Plan Based On Seasonal Demand Information PDF. The topics addressed in these templates are Commission Rate, Commission Earned. All the content presented in this PPT design is completely editable. Download it and make adjustments in color, background, font etc. as per your unique business setting.

 Home
Home