Sales Coordinator
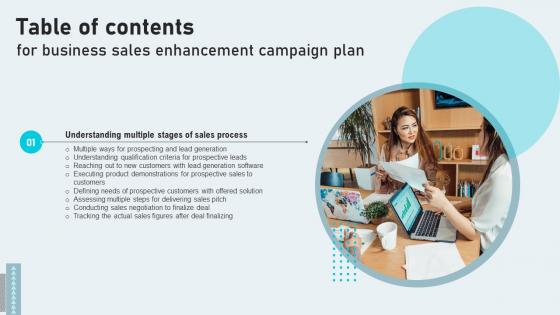
Business Sales Enhancement Campaign Plan Table Of Contents Graphics Pdf
Get a simple yet stunning designed Business Sales Enhancement Campaign Plan Table Of Contents Graphics Pdf. It is the best one to establish the tone in your meetings. It is an excellent way to make your presentations highly effective. So, download this PPT today from Slidegeeks and see the positive impacts. Our easy to edit Business Sales Enhancement Campaign Plan Table Of Contents Graphics Pdf can be your go to option for all upcoming conferences and meetings. So, what are you waiting for Grab this template today.
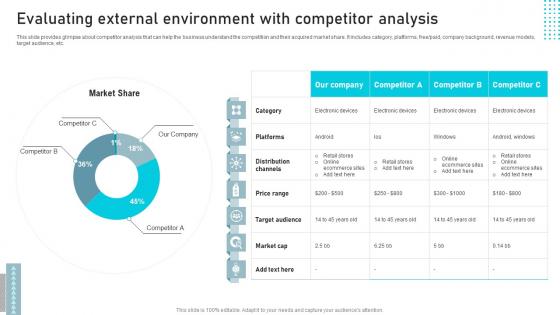
Evaluating External Environment With Business Sales Enhancement Campaign Pictures Pdf
This slide provides glimpse about competitor analysis that can help the business understand the competition and their acquired market share. It includes category, platforms, free paid, company background, revenue models, target audience, etc. Make sure to capture your audiences attention in your business displays with our gratis customizable Evaluating External Environment With Business Sales Enhancement Campaign Pictures Pdf. These are great for business strategies, office conferences, capital raising or task suggestions. If you desire to acquire more customers for your tech business and ensure they stay satisfied, create your own sales presentation with these plain slides.
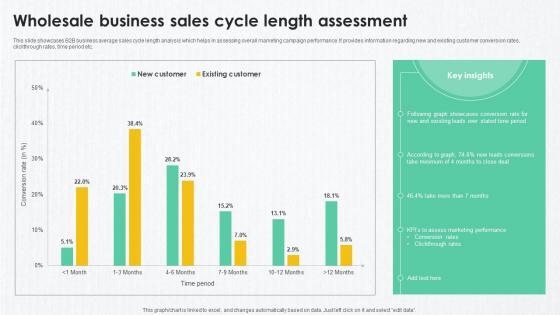
B2B Marketing Techniques Wholesale Business Sales Cycle Length Assessment
This slide showcases B2B business average sales cycle length analysis which helps in assessing overall marketing campaign performance. It provides information regarding new and existing customer conversion rates, clickthrough rates, time period etc. Slidegeeks is here to make your presentations a breeze with B2B Marketing Techniques Wholesale Business Sales Cycle Length Assessment With our easy-to-use and customizable templates, you can focus on delivering your ideas rather than worrying about formatting. With a variety of designs to choose from, you are sure to find one that suits your needs. And with animations and unique photos, illustrations, and fonts, you can make your presentation pop. So whether you are giving a sales pitch or presenting to the board, make sure to check out Slidegeeks first
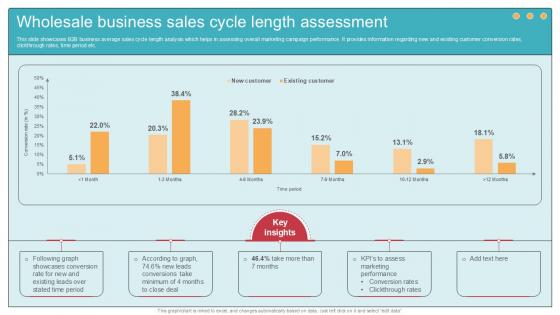
Wholesale Business Sales Cycle Length Assessment Ppt Example
This slide showcases B2B business average sales cycle length analysis which helps in assessing overall marketing campaign performance. It provides information regarding new and existing customer conversion rates, clickthrough rates, time period etc. Here you can discover an assortment of the finest PowerPoint and Google Slides templates. With these templates, you can create presentations for a variety of purposes while simultaneously providing your audience with an eye-catching visual experience. Download Wholesale Business Sales Cycle Length Assessment Ppt Example to deliver an impeccable presentation. These templates will make your job of preparing presentations much quicker, yet still, maintain a high level of quality. Slidegeeks has experienced researchers who prepare these templates and write high-quality content for you. Later on, you can personalize the content by editing the Wholesale Business Sales Cycle Length Assessment Ppt Example.

Analysis Of Ecommerce Sales In Power BI Ppt Slide SS
This slide showcases dashboard for customer segmentation analysis. This template aims to provide opportunities to focus on more customers for selling cosmetics products and can be used to predict business growth. It helps business organization to enhance revenue from sales by focusing on the profit margins. Create an editable Analysis Of Ecommerce Sales In Power BI Ppt Slide SS that communicates your idea and engages your audience. Whether you are presenting a business or an educational presentation, pre-designed presentation templates help save time. Analysis Of Ecommerce Sales In Power BI Ppt Slide SS is highly customizable and very easy to edit, covering many different styles from creative to business presentations. Slidegeeks has creative team members who have crafted amazing templates. So, go and get them without any delay.

Create A Restaurant Marketing Highlighting Graphical Sales Growth Of Restaurant
This slide shows the current revenue growth chart of the restaurant business. The purpose of this slide is to compare the sales growth of pervious year with current year. Find highly impressive Create A Restaurant Marketing Highlighting Graphical Sales Growth Of Restaurant on Slidegeeks to deliver a meaningful presentation. You can save an ample amount of time using these presentation templates. No need to worry to prepare everything from scratch because Slidegeeks experts have already done a huge research and work for you. You need to download Create A Restaurant Marketing Highlighting Graphical Sales Growth Of Restaurant for your upcoming presentation. All the presentation templates are 100 percent editable and you can change the color and personalize the content accordingly. Download now
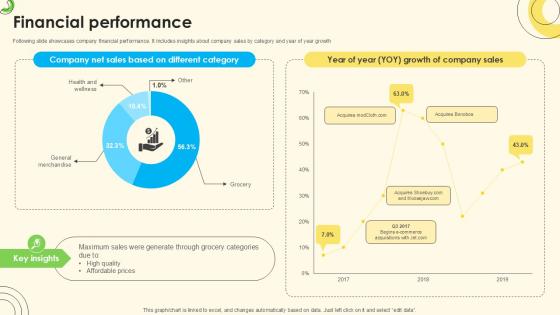
Financial Performance Sales Pitch Deck For Online Retail Ppt Slide
Following slide showcases company financial performance. It includes insights about company sales by category and year of year growth Formulating a presentation can take up a lot of effort and time, so the content and message should always be the primary focus. The visuals of the PowerPoint can enhance the presenters message, so our Financial Performance Sales Pitch Deck For Online Retail Ppt Slide was created to help save time. Instead of worrying about the design, the presenter can concentrate on the message while our designers work on creating the ideal templates for whatever situation is needed. Slidegeeks has experts for everything from amazing designs to valuable content, we have put everything into Financial Performance Sales Pitch Deck For Online Retail Ppt Slide
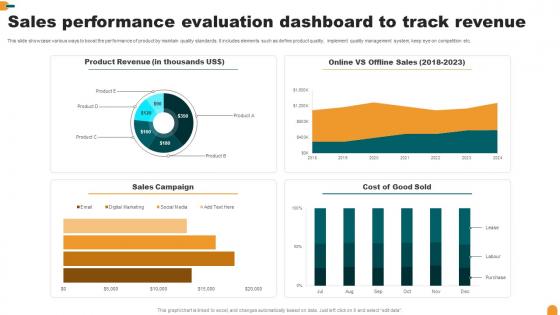
Sales Performance Evaluation Dashboard To Track Revenue Summary Pdf
This slide showcase various ways to boost the performance of product by maintain quality standards. It includes elements such as define product quality, implement quality management system, keep eye on competition etc.Pitch your topic with ease and precision using this Sales Performance Evaluation Dashboard To Track Revenue Summary Pdf This layout presents information on Sales Campaign, Product Revenue, Cost Good Sold It is also available for immediate download and adjustment. So, changes can be made in the color, design, graphics or any other component to create a unique layout.
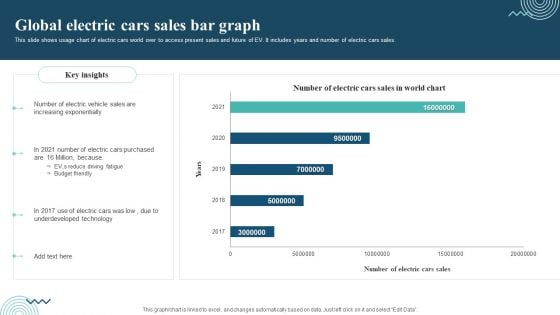
Global Electric Cars Sales Bar Graph Graphics PDF
This slide shows usage chart of electric cars world over to access present sales and future of EV. It includes years and number of electric cars sales. Showcasing this set of slides titled Global Electric Cars Sales Bar Graph Graphics PDF. The topics addressed in these templates are Electric Vehicle Sales, Electric Cars Purchased, Underdeveloped Technology. All the content presented in this PPT design is completely editable. Download it and make adjustments in color, background, font etc. as per your unique business setting.
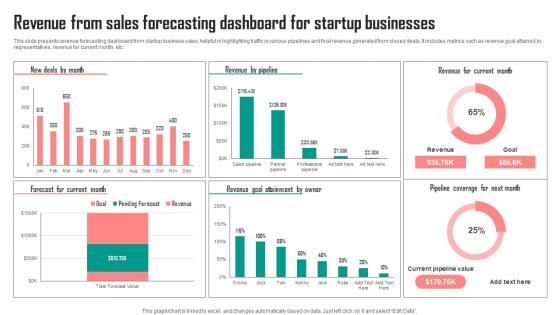
Revenue From Sales Forecasting Dashboard For Startup Businesses Graphics Pdf
This slide presents revenue forecasting dashboard from startup business sales, helpful in highlighting traffic in various pipelines and final revenue generated from closed deals. It includes metrics such as revenue goal attained by representatives, revenue for current month, etc. Showcasing this set of slides titled Revenue From Sales Forecasting Dashboard For Startup Businesses Graphics Pdf. The topics addressed in these templates are Owner, Current Month, Businesses. All the content presented in this PPT design is completely editable. Download it and make adjustments in color, background, font etc. as per your unique business setting.
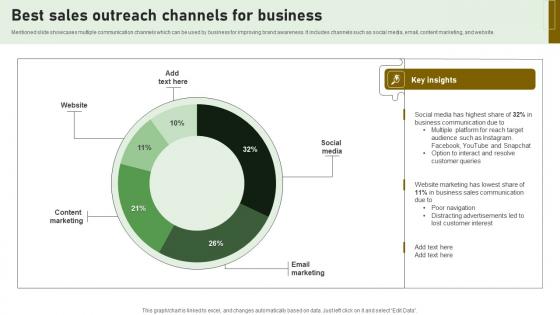
Best Sales Outreach Channels For Business Demonstration Pdf
Mentioned slide showcases multiple communication channels which can be used by business for improving brand awareness. It includes channels such as social media, email, content marketing, and website. Showcasing this set of slides titled Best Sales Outreach Channels For Business Demonstration Pdf. The topics addressed in these templates are Best Sales Outreach, Channels For Business, Social Media, Content Marketing. All the content presented in this PPT design is completely editable. Download it and make adjustments in color, background, font etc. as per your unique business setting.
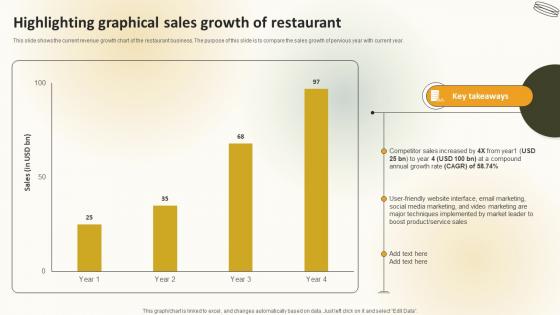
Highlighting Graphical Sales Growth Of Restaurant Create An Effective Restaurant
This slide shows the current revenue growth chart of the restaurant business. The purpose of this slide is to compare the sales growth of pervious year with current year. If your project calls for a presentation, then Slidegeeks is your go-to partner because we have professionally designed, easy-to-edit templates that are perfect for any presentation. After downloading, you can easily edit Highlighting Graphical Sales Growth Of Restaurant Create An Effective Restaurant and make the changes accordingly. You can rearrange slides or fill them with different images. Check out all the handy templates

Monthly Business Sales Performance Report PPT PowerPoint SS
Formulating a presentation can take up a lot of effort and time, so the content and message should always be the primary focus. The visuals of the PowerPoint can enhance the presenters message, so our Monthly Business Sales Performance Report PPT PowerPoint SS was created to help save time. Instead of worrying about the design, the presenter can concentrate on the message while our designers work on creating the ideal templates for whatever situation is needed. Slidegeeks has experts for everything from amazing designs to valuable content, we have put everything into Monthly Business Sales Performance Report PPT PowerPoint SS.
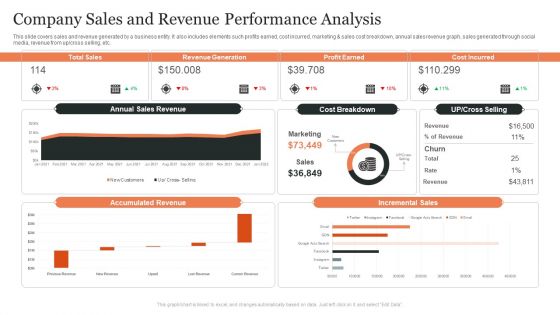
Company Sales And Revenue Performance Analysis Ppt Ideas Format PDF
This slide covers sales and revenue generated by a business entity. It also includes elements such profits earned, cost incurred, marketing and sales cost breakdown, annual sales revenue graph, sales generated through social media, revenue from up OR cross selling, etc. Pitch your topic with ease and precision using this Company Sales And Revenue Performance Analysis Ppt Ideas Format PDF. This layout presents information on Total Sales, Revenue Generation, Profit Earned, Cost Incurred. It is also available for immediate download and adjustment. So, changes can be made in the color, design, graphics or any other component to create a unique layout.
Monthly Sales Performance Tracking And Monitoring Dashboard Diagrams PDF
This slide showcases a dashboard presenting various metrics to measure and analyze sales performance for revenue growth. It includes key components such as number of sales, revenue, profit, cost, sales revenue, sales increment, cost analysis and cross sell. Make sure to capture your audiences attention in your business displays with our gratis customizable Monthly Sales Performance Tracking And Monitoring Dashboard Diagrams PDF. These are great for business strategies, office conferences, capital raising or task suggestions. If you desire to acquire more customers for your tech business and ensure they stay satisfied, create your own sales presentation with these plain slides.
Monthly Sales Performance Tracking And Monitoring Dashboard Designs PDF
This slide showcases a dashboard presenting various metrics to measure and analyze sales performance for revenue growth. It includes key components such as number of sales, revenue, profit, cost, sales revenue, sales increment, cost analysis and cross sell. Make sure to capture your audiences attention in your business displays with our gratis customizable Monthly Sales Performance Tracking And Monitoring Dashboard Designs PDF. These are great for business strategies, office conferences, capital raising or task suggestions. If you desire to acquire more customers for your tech business and ensure they stay satisfied, create your own sales presentation with these plain slides.
Sales Performance Dashboard With Average Lead Tracking Time Background PDF
This slide showcases dashboard for sales performance that can help organization to analyze the effectiveness of sales campaigns and average response time of lead. Its key components are average contract value, average sales cycle length, follow up contract rate and sales activity. Showcasing this set of slides titled Sales Performance Dashboard With Average Lead Tracking Time Background PDF. The topics addressed in these templates are Avg Contract Value, Sales Activity, Contract Rate. All the content presented in this PPT design is completely editable. Download it and make adjustments in color, background, font etc. as per your unique business setting.
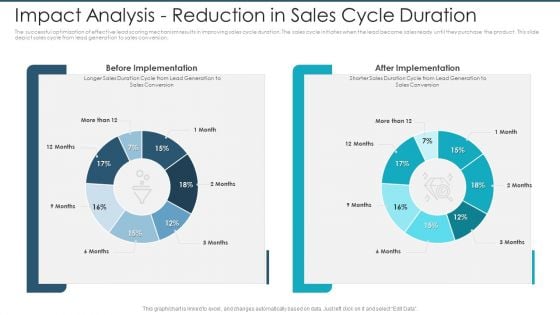
Impact Analysis Reduction In Sales Cycle Duration Infographics PDF
The successful optimization of effective lead scoring mechanism results in improving sales cycle duration. The sales cycle initiates when the lead become sales ready until they purchase the product. This slide depict sales cycle from lead generation to sales conversion.Deliver an awe-inspiring pitch with this creative impact analysis reduction in sales cycle duration infographics pdf. bundle. Topics like before implementation, after implementation can be discussed with this completely editable template. It is available for immediate download depending on the needs and requirements of the user.
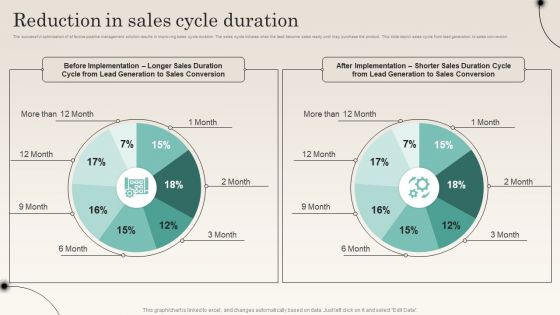
Reduction In Sales Cycle Duration Improving Distribution Channel Slides PDF
The successful optimization of effective pipeline management solution results in improving sales cycle duration. The sales cycle initiates when the lead become sales ready until they purchase the product. This slide depict sales cycle from lead generation to sales conversion.Deliver and pitch your topic in the best possible manner with this Reduction In Sales Cycle Duration Improving Distribution Channel Slides PDF. Use them to share invaluable insights on Positive Momentum, Opportunities Progression, Enhance Engagement and impress your audience. This template can be altered and modified as per your expectations. So, grab it now.
Marketing Team Collaboration Icon For Optimizing Sales Themes PDF
Pitch your topic with ease and precision using this Marketing Team Collaboration Icon For Optimizing Sales Themes PDF This layout presents information on Marketing Team, Collaboration Icon, Optimizing Sales It is also available for immediate download and adjustment. So, changes can be made in the color, design, graphics or any other component to create a unique layout.
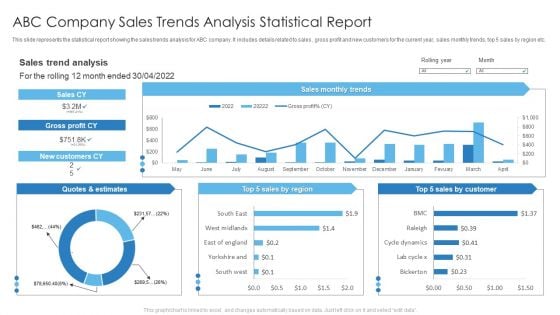
Abc Company Sales Trends Analysis Statistical Report Slides PDF
This slide represents the statistical report showing the sales trends analysis for ABC company. It includes details related to sales , gross profit and new customers for the current year, sales monthly trends, top 5 sales by region etc. Deliver an awe inspiring pitch with this creative Abc Company Sales Trends Analysis Statistical Report Slides PDF bundle. Topics like Abc Company Sales, Trends Analysis Statistical Report can be discussed with this completely editable template. It is available for immediate download depending on the needs and requirements of the user.
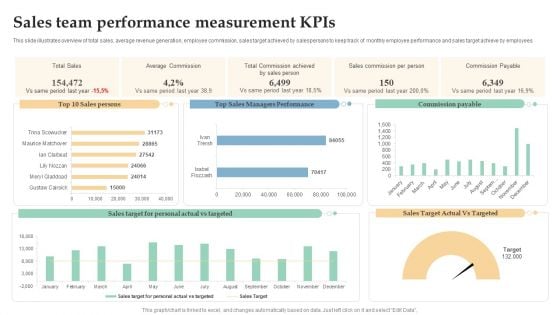
Sales Team Performance Measurement Kpis Ppt Professional Templates PDF
This slide illustrates overview of total sales, average revenue generation, employee commission, sales target achieved by salespersons to keep track of monthly employee performance and sales target achieve by employees. Showcasing this set of slides titled Sales Team Performance Measurement Kpis Ppt Professional Templates PDF. The topics addressed in these templates are Total Sales, Average Commission, Sales Commission, Per Person. All the content presented in this PPT design is completely editable. Download it and make adjustments in color, background, font etc. as per your unique business setting.
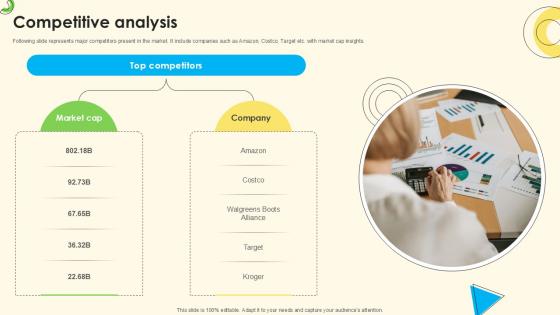
Competitive Analysis Sales Pitch Deck For Online Retail Ppt Presentation
Following slide represents major competitors present in the market. It include companies such as Amazon, Costco, Target etc. with market cap insights. If you are looking for a format to display your unique thoughts, then the professionally designed Competitive Analysis Sales Pitch Deck For Online Retail Ppt Presentation is the one for you. You can use it as a Google Slides template or a PowerPoint template. Incorporate impressive visuals, symbols, images, and other charts. Modify or reorganize the text boxes as you desire. Experiment with shade schemes and font pairings. Alter, share or cooperate with other people on your work. Download Competitive Analysis Sales Pitch Deck For Online Retail Ppt Presentation and find out how to give a successful presentation. Present a perfect display to your team and make your presentation unforgettable.
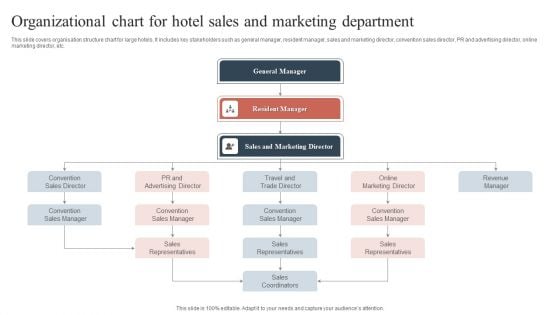
Organizational Chart For Hotel Sales And Marketing Department Guidelines PDF
This slide covers organisation structure chart for large hotels. It includes key stakeholders such as general manager, resident manager, sales and marketing director, convention sales director, PR and advertising director, online marketing director, etc. Persuade your audience using this Organizational Chart For Hotel Sales And Marketing Department Guidelines PDF. This PPT design covers six stages, thus making it a great tool to use. It also caters to a variety of topics including Convention Sales Manager, Sales Representatives, Convention Sales Manager. Download this PPT design now to present a convincing pitch that not only emphasizes the topic but also showcases your presentation skills.
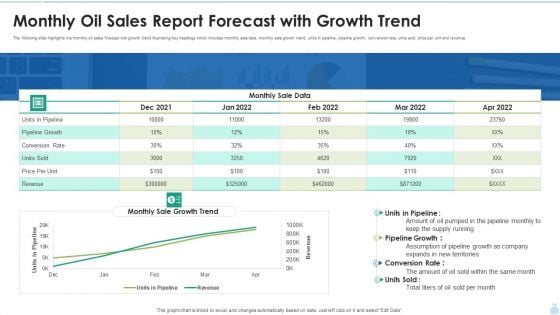
Monthly Oil Sales Report Forecast With Growth Trend Graphics PDF
The following slide highlights the monthly oil sales forecast with growth trend illustrating key headings which includes monthly sale data, monthly sale growth trend, units in pipeline, pipeline growth, conversion rate, units sold, price per unit and revenue. Showcasing this set of slides titled Monthly Oil Sales Report Forecast With Growth Trend Graphics PDF. The topics addressed in these templates are Pipeline Growth, Monthly Sale Data, Conversion Rate. All the content presented in this PPT design is completely editable. Download it and make adjustments in color, background, font etc. as per your unique business setting.
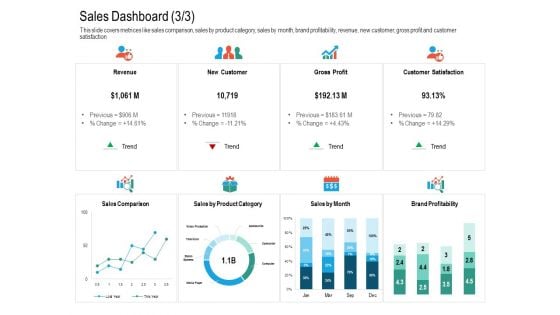
Upselling Strategies For Business Sales Dashboard Trend Guidelines PDF
This slide covers metrices like sales comparison, sales by product category, sales by month, brand profitability, revenue, new customer, gross profit and customer satisfaction. Deliver and pitch your topic in the best possible manner with this upselling strategies for business sales dashboard trend guidelines pdf. Use them to share invaluable insights on revenue, gross profit, customer satisfaction, new customer and impress your audience. This template can be altered and modified as per your expectations. So, grab it now.
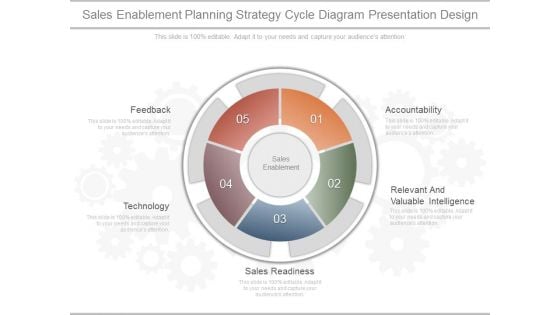
Sales Enablement Planning Strategy Cycle Diagram Presentation Design
This is a sales enablement planning strategy cycle diagram presentation design. This is a five stage process. The stages in this process are accountability, relevant and valuable intelligence, sales readiness, technology, feedback.
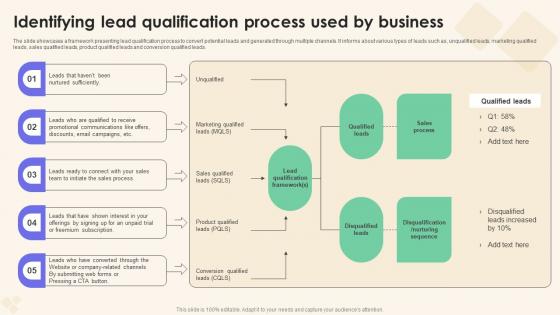
Identifying Lead Qualification Process Sales Performance Enhancement Introduction Pdf
The slide showcases a framework presenting lead qualification process to convert potential leads and generated through multiple channels. It informs about various types of leads such as, unqualified leads, marketing qualified leads, sales qualified leads, product qualified leads and conversion qualified leads. If you are looking for a format to display your unique thoughts, then the professionally designed Identifying Lead Qualification Process Sales Performance Enhancement Introduction Pdf is the one for you. You can use it as a Google Slides template or a PowerPoint template. Incorporate impressive visuals, symbols, images, and other charts. Modify or reorganize the text boxes as you desire. Experiment with shade schemes and font pairings. Alter, share or cooperate with other people on your work. Download Identifying Lead Qualification Process Sales Performance Enhancement Introduction Pdf and find out how to give a successful presentation. Present a perfect display to your team and make your presentation unforgettable.

Sprints Management Roadmap E Sales Generation Checklist Inspiration PDF
The slide displays information regarding various crucial activities such as release management, configuration management, etc. are transformed into small attainable sprints tasks by tracking their progress through the timeline associated to them. This Sprints Management Roadmap E Sales Generation Checklist Inspiration PDF is perfect for any presentation, be it in front of clients or colleagues. It is a versatile and stylish solution for organizing your meetings. The Sprints Management Roadmap E Sales Generation Checklist Inspiration PDF features a modern design for your presentation meetings. The adjustable and customizable slides provide unlimited possibilities for acing up your presentation. Slidegeeks has done all the homework before launching the product for you. So, do not wait, grab the presentation templates today
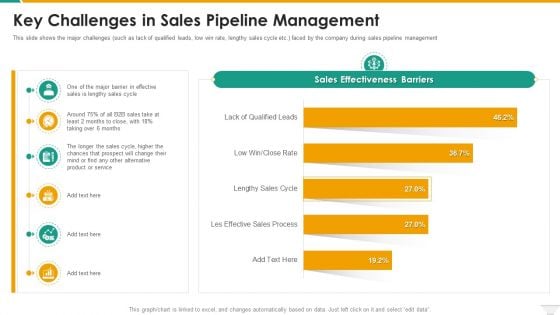
Key Challenges In Sales Pipeline Management Microsoft PDF
This slide shows the major challenges such as lack of qualified leads, low win rate, lengthy sales cycle etc. faced by the company during sales pipeline management Deliver and pitch your topic in the best possible manner with this Key Challenges In Sales Pipeline Management Microsoft PDF. Use them to share invaluable insights on Key Challenges In Sales Pipeline Management and impress your audience. This template can be altered and modified as per your expectations. So, grab it now.
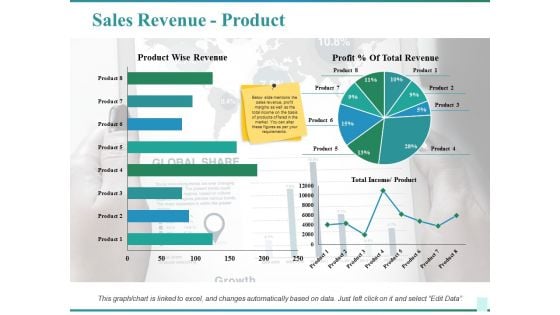
Sales Revenue Product Ppt PowerPoint Presentation Outline Portfolio
This is a sales revenue product ppt powerpoint presentation outline portfolio. This is a three stage process. The stages in this process are total income product, total revenue, product wise revenue, sales, business.
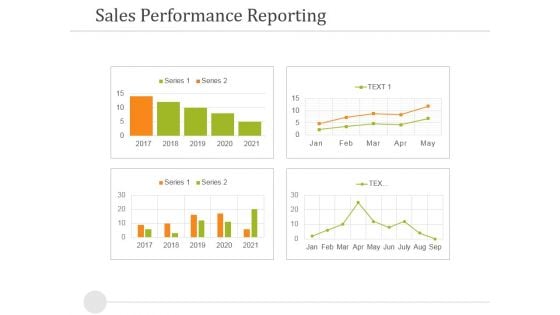
Sales Performance Reporting Ppt PowerPoint Presentation Outline Outfit
This is a sales performance reporting ppt powerpoint presentation outline outfit. This is a four stage process. The stages in this process are sales performance reporting, business, success, strategy, finance.
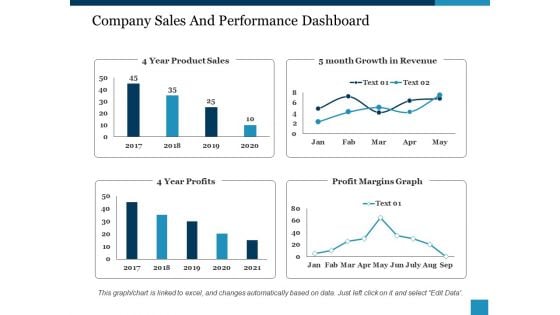
Company Sales And Performance Dashboard Ppt PowerPoint Presentation Show Structure
This is a company sales and performance dashboard ppt powerpoint presentation show structure. This is a four stage process. The stages in this process are year product sales, month growth in revenue, profit margins graph, year profits.
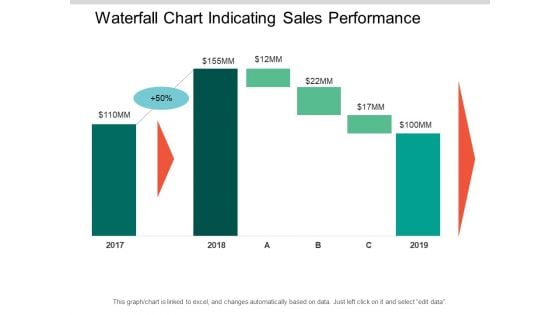
Waterfall Chart Indicating Sales Performance Ppt PowerPoint Presentation Outline Templates
This is a waterfall chart indicating sales performance ppt powerpoint presentation outline templates. This is a seven stage process. The stages in this process are sales waterfall, waterfall chart, business.
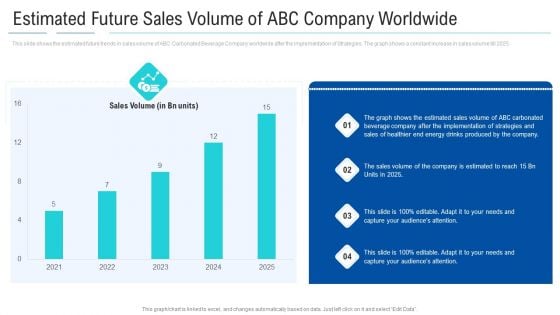
Estimated Future Sales Volume Of ABC Company Worldwide Clipart PDF
This slide shows the estimated future trends in sales volume of ABC Carbonated Beverage Company worldwide after the implementation of Strategies. The graph shows a constant increase in sales volume till 2025. Deliver an awe-inspiring pitch with this creative estimated future sales volume of abc company worldwide clipart pdf. bundle. Topics like estimated future sales volume of abc company worldwide can be discussed with this completely editable template. It is available for immediate download depending on the needs and requirements of the user.
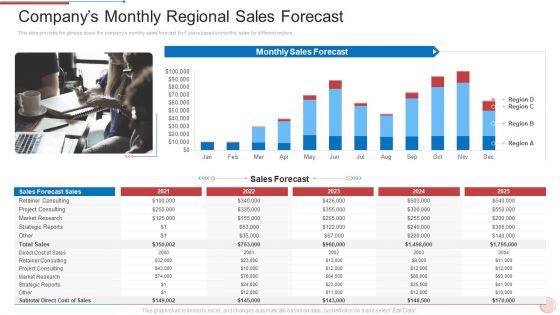
Regional Marketing Strategies Companys Monthly Regional Sales Forecast Graphics PDF
This slide provides the glimpse about the companys monthly sales forecast for 5 years based on monthly sales for different regions. Deliver and pitch your topic in the best possible manner with this regional marketing strategies companys monthly regional sales forecast graphics pdf. Use them to share invaluable insights on strategic, sales, cost and impress your audience. This template can be altered and modified as per your expectations. So, grab it now.
B2B Sales Representative Insights Dashboard Ppt Icon PDF
This slide covers the sales reps dashboard wherein teams contribution to leads, managing SQLs and revenue targets are evaluated.Deliver an awe-inspiring pitch with this creative B2B sales representative insights dashboard ppt icon pdf. bundle. Topics like sales representatives leads actual, sales representatives revenue actual, revenue pace can be discussed with this completely editable template. It is available for immediate download depending on the needs and requirements of the user.
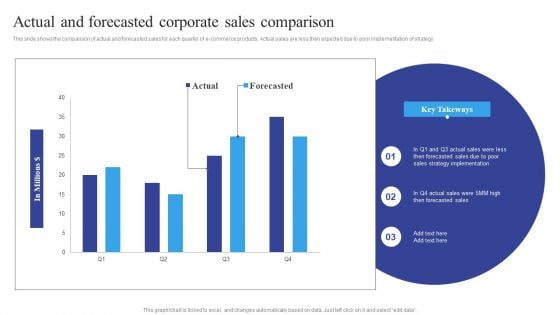
Actual And Forecasted Corporate Sales Comparison Brochure PDF
This slide shows the comparison of actual and forecasted sales for each quarter of e-commerce products. Actual sales are less then expected due to poor implementation of strategy. Showcasing this set of slides titled Actual And Forecasted Corporate Sales Comparison Brochure PDF. The topics addressed in these templates are Actual And Forecasted, Corporate Sales Comparison. All the content presented in this PPT design is completely editable. Download it and make adjustments in color, background, font etc. as per your unique business setting.
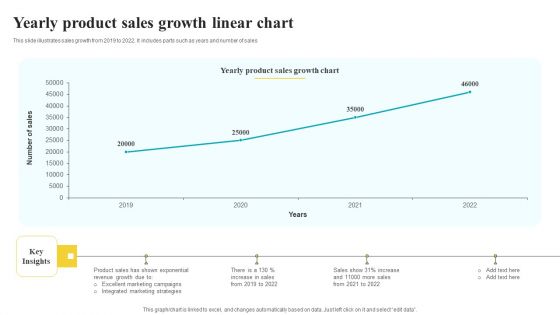
Yearly Product Sales Growth Linear Chart Pictures PDF
This slide illustrates sales growth from 2019 to 2022. It includes parts such as years and number of sales Pitch your topic with ease and precision using this Yearly Product Sales Growth Linear Chart Pictures PDF. This layout presents information on Sales Growth Chart, Key Insights, Strategies. It is also available for immediate download and adjustment. So, changes can be made in the color, design, graphics or any other component to create a unique layout.
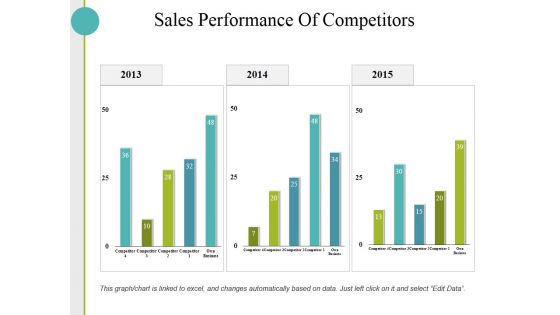
Sales Performance Of Competitors Ppt PowerPoint Presentation Show Graphics Download
This is a sales performance of competitors ppt powerpoint presentation show graphics download. This is a three stage process. The stages in this process are business, finance, marketing, strategy, sales.
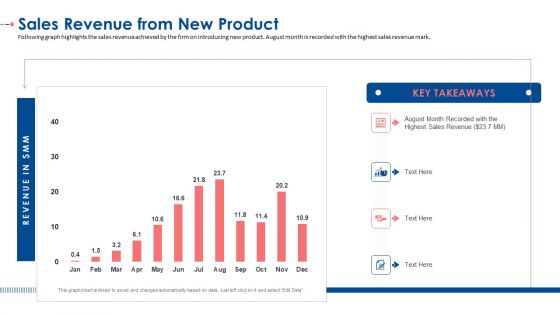
Sales Revenue From New Product Ppt Infographic Template Example PDF
Following graph highlights the sales revenue achieved by the firm on introducing new product. August month is recorded with the highest sales revenue mark. Deliver and pitch your topic in the best possible manner with this sales revenue from new product ppt infographic template example pdf. Use them to share invaluable insights on sales revenue from new product and impress your audience. This template can be altered and modified as per your expectations. So, grab it now.
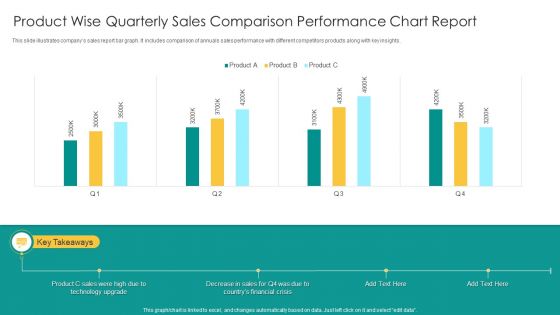
Product Wise Quarterly Sales Comparison Performance Chart Report Infographics PDF
This slide illustrates companys sales report bar graph. It includes comparison of annuals sales performance with different competitors products along with key insights. Showcasing this set of slides titled Product Wise Quarterly Sales Comparison Performance Chart Report Infographics PDF. The topics addressed in these templates are Product C Sales, Technology Upgrade, Financial Crisis. All the content presented in this PPT design is completely editable. Download it and make adjustments in color, background, font etc. as per your unique business setting.
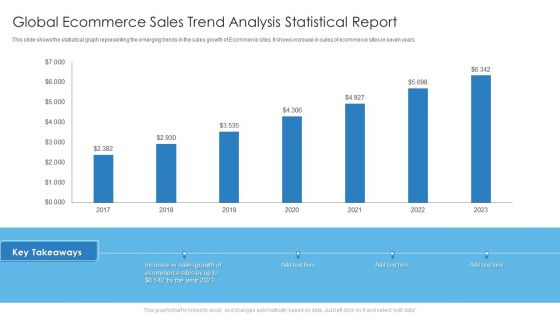
Global Ecommerce Sales Trend Analysis Statistical Report Mockup PDF
This slide shows the statistical graph representing the emerging trends in the sales growth of Ecommerce sites. It shows increase in sales of ecommerce sites in seven years. Deliver and pitch your topic in the best possible manner with this Global Ecommerce Sales Trend Analysis Statistical Report Mockup PDF. Use them to share invaluable insights on Sales Growth, Ecommerce Sites and impress your audience. This template can be altered and modified as per your expectations. So, grab it now.
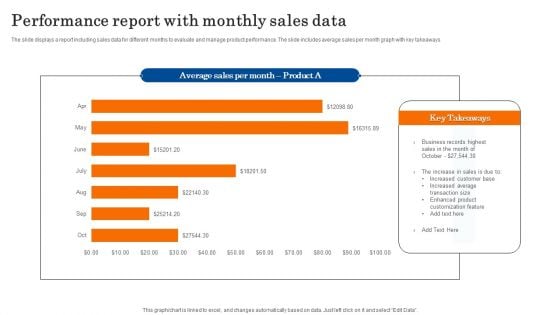
Performance Report With Monthly Sales Data Diagrams PDF
The slide displays a report including sales data for different months to evaluate and manage product performance. The slide includes average sales per month graph with key takeaways. Showcasing this set of slides titled Performance Report With Monthly Sales Data Diagrams PDF. The topics addressed in these templates are Business, Sales, Customization. All the content presented in this PPT design is completely editable. Download it and make adjustments in color, background, font etc. as per your unique business setting.
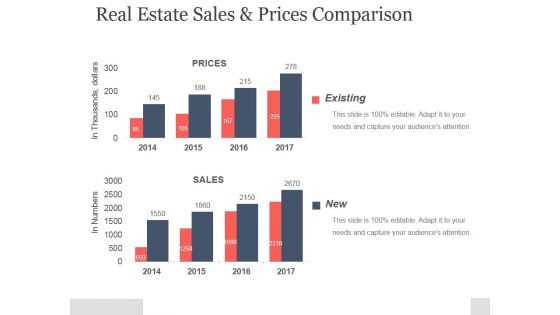
Real Estate Sales And Prices Comparison Ppt PowerPoint Presentation Example
This is a real estate sales and prices comparison ppt powerpoint presentation example. This is a two stage process. The stages in this process are existing, prices, sales, in thousands, dollars.
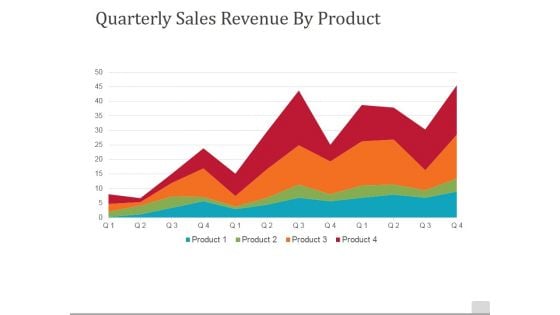
Quarterly Sales Revenue By Product Ppt PowerPoint Presentation File Background
This is a quarterly sales revenue by product ppt powerpoint presentation file background. This is a four stage process. The stages in this process are quarterly, sales revenue by product, business, marketing, success.
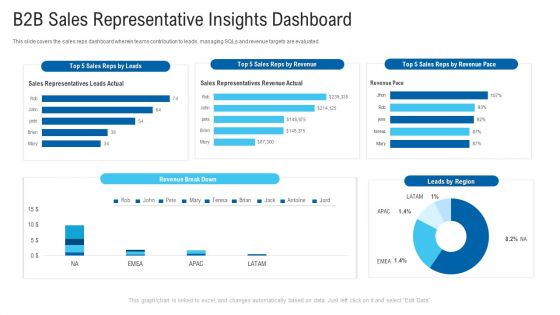
B2B Sales Representative Insights Dashboard Ppt Summary PDF
This slide covers the sales reps dashboard wherein teams contribution to leads, managing SQLs and revenue targets are evaluated.Deliver an awe-inspiring pitch with this creative B2B sales representative insights dashboard ppt summary pdf. bundle. Topics like sales representatives leads actual, sales representatives revenue actual, revenue pace can be discussed with this completely editable template. It is available for immediate download depending on the needs and requirements of the user.
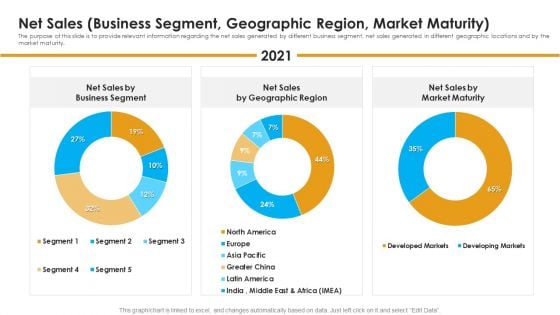
Net Sales Business Segment Geographic Region Market Maturity Information PDF
The purpose of this slide is to provide relevant information regarding the net sales generated by different business segment, net sales generated in different geographic locations and by the market maturity. Deliver an awe-inspiring pitch with this creative net sales business segment geographic region market maturity information pdf bundle. Topics like business segment, net sales by geographic region, market maturity can be discussed with this completely editable template. It is available for immediate download depending on the needs and requirements of the user.
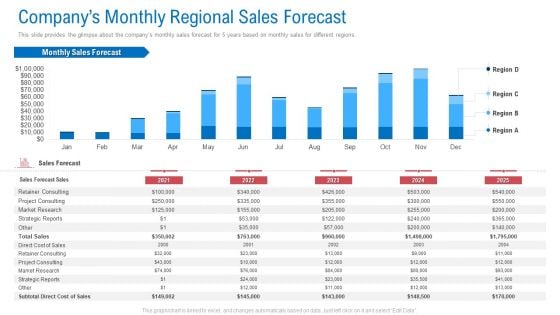
Regional Marketing Planning Companys Monthly Regional Sales Forecast Mockup PDF
This slide provides the glimpse about the companys monthly sales forecast for 5 years based on monthly sales for different regions. Deliver and pitch your topic in the best possible manner with this regional marketing planning companys monthly regional sales forecast mockup pdf. Use them to share invaluable insights on market research, strategic reports, sales forecast and impress your audience. This template can be altered and modified as per your expectations. So, grab it now.
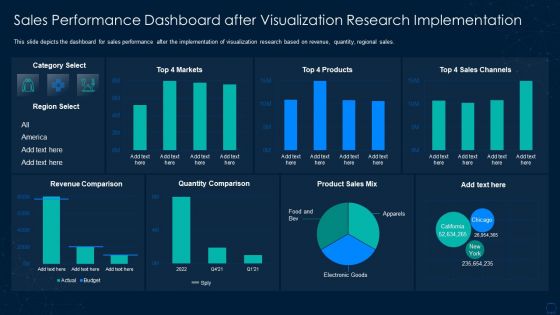
Graphical Representation Of Research IT Sales Performance Dashboard Sample PDF
This slide depicts the dashboard for sales performance after the implementation of visualization research based on revenue, quantity, regional sales. Deliver and pitch your topic in the best possible manner with this graphical representation of research it sales performance dashboard sample pdf. Use them to share invaluable insights on sales performance dashboard after visualization research implementation and impress your audience. This template can be altered and modified as per your expectations. So, grab it now.
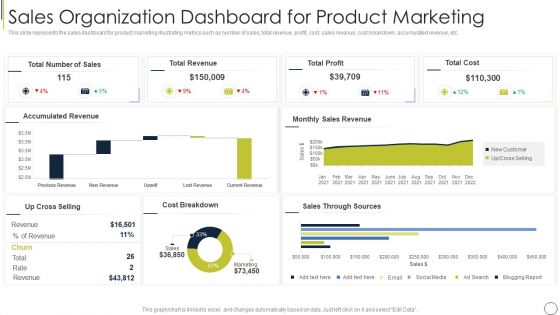
Sales Organization Dashboard For Product Marketing Themes PDF
This slide represents the sales dashboard for product marketing illustrating metrics such as number of sales, total revenue, profit, cost, sales revenue, cost breakdown, accumulated revenue, etc. Pitch your topic with ease and precision using this sales organization dashboard for product marketing themes pdf. This layout presents information on total cost, total profit, total revenue. It is also available for immediate download and adjustment. So, changes can be made in the color, design, graphics or any other component to create a unique layout.
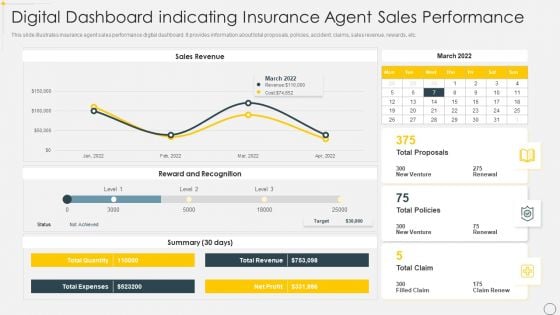
Digital Dashboard Indicating Insurance Agent Sales Performance Portrait PDF
This slide illustrates insurance agent sales performance digital dashboard. It provides information about total proposals, policies, accident, claims, sales revenue, rewards, etc. Pitch your topic with ease and precision using this Digital Dashboard Indicating Insurance Agent Sales Performance Portrait PDF. This layout presents information on Sales Revenue, Reward And Recognition. It is also available for immediate download and adjustment. So, changes can be made in the color, design, graphics or any other component to create a unique layout.
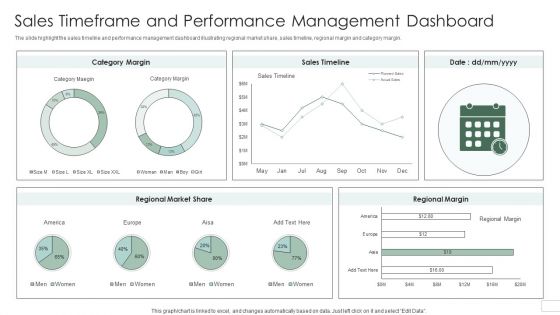
Sales Timeframe And Performance Management Dashboard Introduction PDF
The slide highlight the sales timeline and performance management dashboard illustrating regional market share, sales timeline, regional margin and category margin. Pitch your topic with ease and precision using this Sales Timeframe And Performance Management Dashboard Introduction PDF. This layout presents information on Regional Market Share, Category Margin, Sales Timeline. It is also available for immediate download and adjustment. So, changes can be made in the color, design, graphics or any other component to create a unique layout.
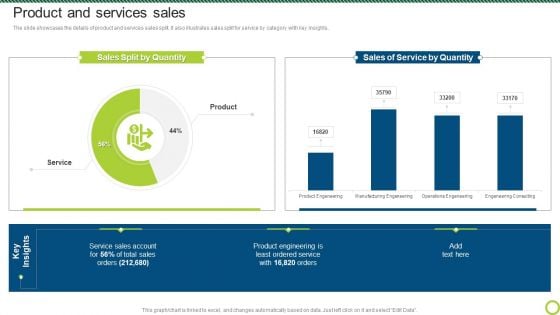
Engineering Solutions Company Detail Product And Services Sales Designs PDF
The slide showcases the details of product and services sales split. It also illustrates sales split for service by category with key insights.Deliver and pitch your topic in the best possible manner with this Engineering Solutions Company Detail Product And Services Sales Designs PDF. Use them to share invaluable insights on Service By Quantity, Sales Account, Product Engineering and impress your audience. This template can be altered and modified as per your expectations. So, grab it now.
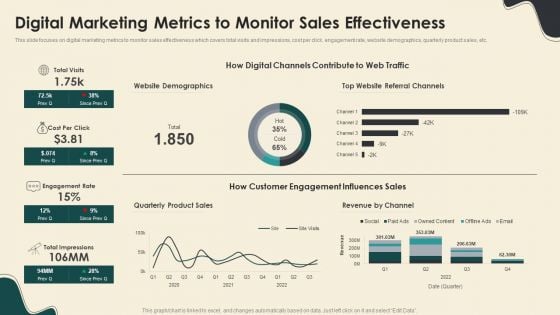
Digital Marketing Metrics To Monitor Sales Effectiveness Graphics PDF
This slide focuses on digital marketing metrics to monitor sales effectiveness which covers total visits and impressions, cost per click, engagement rate, website demographics, quarterly product sales, etc. Deliver an awe inspiring pitch with this creative Digital Marketing Metrics To Monitor Sales Effectiveness Graphics PDF bundle. Topics like Website Demographics, Quarterly Product Sales, Revenue By Channel can be discussed with this completely editable template. It is available for immediate download depending on the needs and requirements of the user.
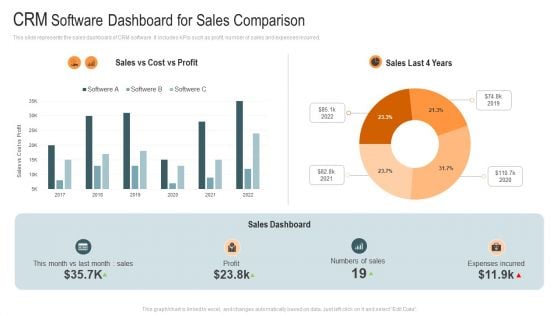
CRM Software Dashboard For Sales Comparison Mockup PDF
This slide represents the sales dashboard of CRM software. It includes KPIs such as profit, number of sales and expenses incurred. Pitch your topic with ease and precision using this CRM Software Dashboard For Sales Comparison Mockup PDF. This layout presents information on Profit, Sales Dashboard, Expenses Incurred. It is also available for immediate download and adjustment. So, changes can be made in the color, design, graphics or any other component to create a unique layout.
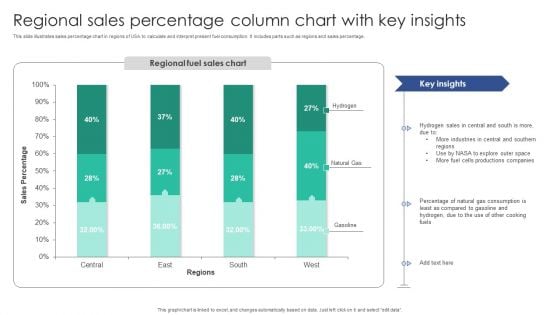
Regional Sales Percentage Column Chart With Key Insights Diagrams PDF
This slide illustrates sales percentage chart in regions of USA to calculate and interpret present fuel consumption. It includes parts such as regions and sales percentage.Pitch your topic with ease and precision using this Regional Sales Percentage Column Chart With Key Insights Diagrams PDF. This layout presents information on Industries Central, Sales Central, Productions Companies. It is also available for immediate download and adjustment. So, changes can be made in the color, design, graphics or any other component to create a unique layout.
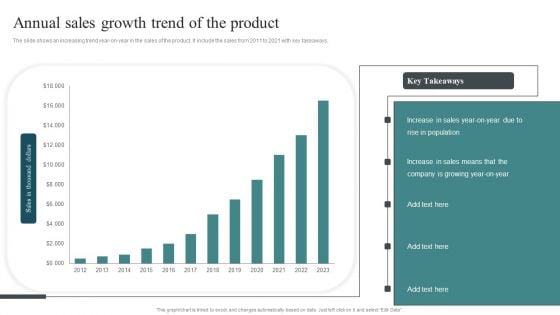
Annual Sales Growth Trend Of The Product Summary PDF
The slide shows an increasing trend year-on-year in the sales of the product. It include the sales from 2011 to 2021 with key takeaways.Pitch your topic with ease and precision using this Annual Sales Growth Trend Of The Product Summary PDF. This layout presents information on Increase Sales, Company Growing, Rise Population. It is also available for immediate download and adjustment. So, changes can be made in the color, design, graphics or any other component to create a unique layout.
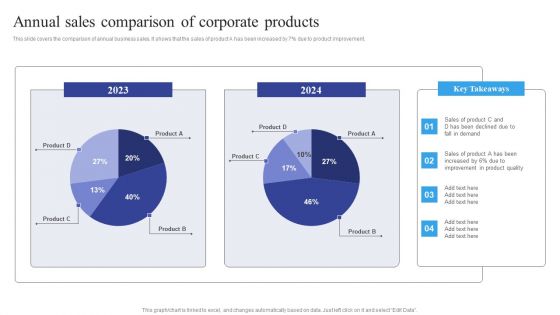
Annual Sales Comparison Of Corporate Products Themes PDF
This slide covers the comparison of annual business sales. It shows that the sales of product A has been increased by 7 percent due to product improvement. Pitch your topic with ease and precision using this Annual Sales Comparison Of Corporate Products Themes PDF. This layout presents information on Annual Sales, Comparison Of Corporate Products. It is also available for immediate download and adjustment. So, changes can be made in the color, design, graphics or any other component to create a unique layout.
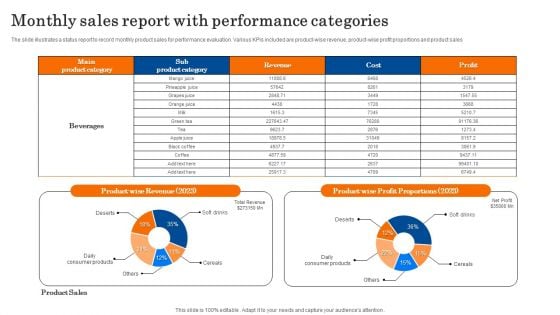
Monthly Sales Report With Performance Categories Diagrams PDF
The slide illustrates a status report to record monthly product sales for performance evaluation. Various KPIs included are product wise revenue, product-wise profit proportions and product sales. Showcasing this set of slides titled Monthly Sales Report With Performance Categories Diagrams PDF. The topics addressed in these templates are Revenue, Profit Proportions, Product Sales. All the content presented in this PPT design is completely editable. Download it and make adjustments in color, background, font etc. as per your unique business setting.

 Home
Home