Road Infographic

Product Rollout Techniques Dashboard To Track Product Sales Performance Infographics PDF
This slide showcases dashboard that can help organization to analyse the sales of product after entering into niche market. Its key elements are sales, sales target, sales growth, sales by channel, inventory days outstanding etc. Are you in need of a template that can accommodate all of your creative concepts This one is crafted professionally and can be altered to fit any style. Use it with Google Slides or PowerPoint. Include striking photographs, symbols, depictions, and other visuals. Fill, move around, or remove text boxes as desired. Test out color palettes and font mixtures. Edit and save your work, or work with colleagues. Download Product Rollout Techniques Dashboard To Track Product Sales Performance Infographics PDF and observe how to make your presentation outstanding. Give an impeccable presentation to your group and make your presentation unforgettable.
Marketers Guide To Data Analysis Optimization Dashboard For Tracking Business Blog Kpis Infographics PDF
This slide covers the dashboard for analyzing blogging KPIs such as performance, published posts, views, new blog subscribers, top blog posts by pageviews, top blog posts by CTR, etc. Coming up with a presentation necessitates that the majority of the effort goes into the content and the message you intend to convey. The visuals of a PowerPoint presentation can only be effective if it supplements and supports the story that is being told. Keeping this in mind our experts created Marketers Guide To Data Analysis Optimization Dashboard For Tracking Business Blog Kpis Infographics PDF to reduce the time that goes into designing the presentation. This way, you can concentrate on the message while our designers take care of providing you with the right template for the situation.
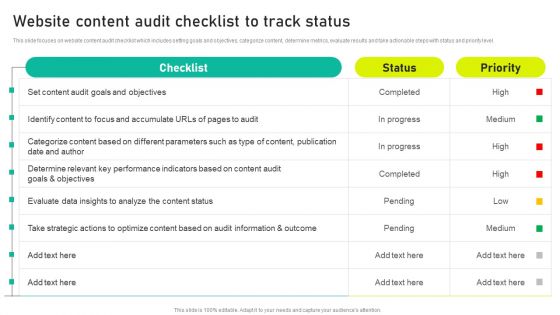
Website Content Audit Checklist To Track Status Ppt Infographics Maker PDF
This slide focuses on website content audit checklist which includes setting goals and objectives, categorize content, determine metrics, evaluate results and take actionable steps with status and priority level. Retrieve professionally designed Website Content Audit Checklist To Track Status Ppt Infographics Maker PDF to effectively convey your message and captivate your listeners. Save time by selecting pre made slideshows that are appropriate for various topics, from business to educational purposes. These themes come in many different styles, from creative to corporate, and all of them are easily adjustable and can be edited quickly. Access them as PowerPoint templates or as Google Slides themes. You do not have to go on a hunt for the perfect presentation because Slidegeeks got you covered from everywhere.
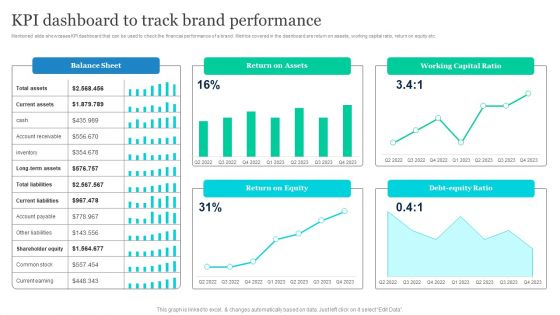
Effective Product Positioning Approach Kpi Dashboard To Track Brand Performance Infographics PDF
Mentioned slide showcases KPI dashboard that can be used to check the financial performance of a brand. Metrics covered in the dashboard are return on assets, working capital ratio, return on equity etc. Slidegeeks is one of the best resources for PowerPoint templates. You can download easily and regulate Effective Product Positioning Approach Kpi Dashboard To Track Brand Performance Infographics PDF for your personal presentations from our wonderful collection. A few clicks is all it takes to discover and get the most relevant and appropriate templates. Use our Templates to add a unique zing and appeal to your presentation and meetings. All the slides are easy to edit and you can use them even for advertisement purposes.

Kpis To Track Personalized Mobile Application Marketing Campaign Results Ppt Pictures Infographics PDF
This slide showcases KPIs that can help organization in measure the results of personalized mobile application marketing campaign. KPIs include audience growth rate, engagement rate, conversion rate, customer satisfaction score and click through rate. Present like a pro with Kpis To Track Personalized Mobile Application Marketing Campaign Results Ppt Pictures Infographics PDF Create beautiful presentations together with your team, using our easy to use presentation slides. Share your ideas in real time and make changes on the fly by downloading our templates. So whether you are in the office, on the go, or in a remote location, you can stay in sync with your team and present your ideas with confidence. With Slidegeeks presentation got a whole lot easier. Grab these presentations today.
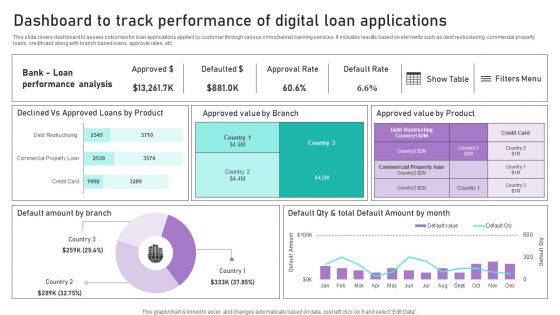
Dashboard To Track Performance Of Digital Loan Applications Ppt Infographics PDF
This slide covers dashboard to assess outcomes for loan applications applied by customer through various omnichannel banking services. It includes results based on elements such as debt restructuring, commercial property loans, credit card along with branch based loans, approval rates, etc. Are you in need of a template that can accommodate all of your creative concepts This one is crafted professionally and can be altered to fit any style. Use it with Google Slides or PowerPoint. Include striking photographs, symbols, depictions, and other visuals. Fill, move around, or remove text boxes as desired. Test out color palettes and font mixtures. Edit and save your work, or work with colleagues. Download Dashboard To Track Performance Of Digital Loan Applications Ppt Infographics PDF and observe how to make your presentation outstanding. Give an impeccable presentation to your group and make your presentation unforgettable.

Employee Retention And Human Capital Strategy Of SW Care Company Ppt Infographics Diagrams PDF
This slide shows the Employee Retention and Human Capital Strategy of SW Care Company. Some strategic points are ensuring proper integration of Human Capital, Effectively build Cross Cultural Teams, Follow Continuous Feedback and Improvement Procedures etc. This is a employee retention and human capital strategy of sw care company ppt infographics diagrams pdf template with various stages. Focus and dispense information on three stages using this creative set, that comes with editable features. It contains large content boxes to add your information on topics like environment, strategic principles, improvement procedures. You can also showcase facts, figures, and other relevant content using this PPT layout. Grab it now.
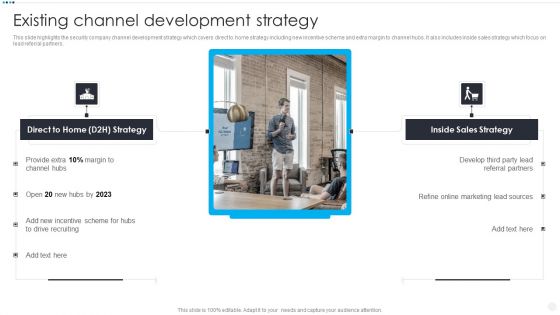
Smart Home Security Solutions Company Profile Existing Channel Development Strategy Infographics PDF
This slide highlights the security company channel development strategy which covers direct to home strategy including new incentive scheme and extra margin to channel hubs. It also includes inside sales strategy which focus on lead referral partners. Presenting Smart Home Security Solutions Company Profile Existing Channel Development Strategy Infographics PDF to provide visual cues and insights. Share and navigate important information on two stages that need your due attention. This template can be used to pitch topics like Direct To Home, Incentive Scheme Hubs. In addtion, this PPT design contains high resolution images, graphics, etc, that are easily editable and available for immediate download.
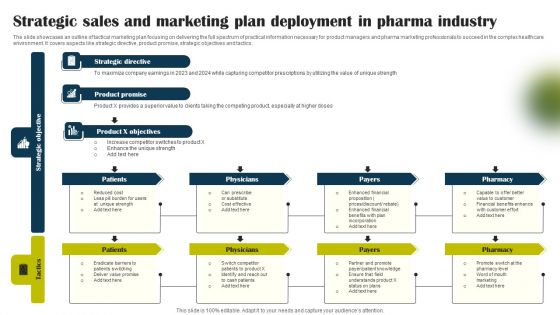
Strategic Sales And Marketing Plan Deployment In Pharma Industry Infographics PDF
The slide showcases an outline of tactical marketing plan focusing on delivering the full spectrum of practical information necessary for product managers and pharma marketing professionals to succeed in the complex healthcare environment. It covers aspects like strategic directive, product promise, strategic objectives and tactics. Presenting Strategic Sales And Marketing Plan Deployment In Pharma Industry Infographics PDF to dispense important information. This template comprises eight stages. It also presents valuable insights into the topics including Product Promise, Strategic Directive, Physicians. This is a completely customizable PowerPoint theme that can be put to use immediately. So, download it and address the topic impactfully.

Project Administration Bundle Statistical PERT Estimation Worksheet With Duration Infographics PDF
The following slide displays the statistical PERT estimation worksheet as it displays the start of the project, the end o fhte project and various critical paths that required to be completed. Presenting Project AdministratProject Administration Bundle Statistical PERT Estimation Worksheet With Duration Infographics PDF to provide visual cues and insights. Share and navigate important information on three stages that need your due attention. This template can be used to pitch topics like Estimation Worksheet, Statistical. In addtion, this PPT design contains high resolution images, graphics, etc, that are easily editable and available for immediate download.

Addressing The Key Stages Of Buyer Journey Retail Merchandising Techniques Infographics PDF
The following slide outlines 5 different stages of buyer journey showcasing customer path to purchase. The stages mentioned in the slide are awareness, consideration, purchase, service, and loyalty expansion.Want to ace your presentation in front of a live audience Our Addressing The Key Stages Of Buyer Journey Retail Merchandising Techniques Infographics PDF can help you do that by engaging all the users towards you. Slidegeeks experts have put their efforts and expertise into creating these impeccable powerpoint presentations so that you can communicate your ideas clearly. Moreover, all the templates are customizable, and easy-to-edit and downloadable. Use these for both personal and commercial use.
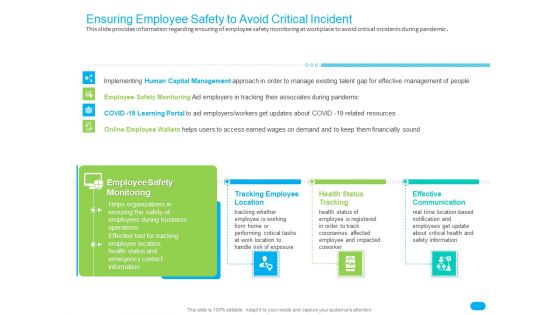
Post COVID Recovery Strategy For Retail Industry Ensuring Employee Safety To Avoid Critical Incident Infographics PDF
This slide provides information regarding ensuring of employee safety monitoring at workplace to avoid critical incidents during pandemic. Presenting post covid recovery strategy for retail industry ensuring employee safety to avoid critical incident infographics pdf to provide visual cues and insights. Share and navigate important information on three stages that need your due attention. This template can be used to pitch topics like tracking employee location, health status tracking, effective communication. In addtion, this PPT design contains high resolution images, graphics, etc, that are easily editable and available for immediate download.

Application Development Best Practice Tools And Templates Need Of Software Engineering Infographics PDF
This slide covers the need of software engineering tools which focuses on version control, coding standards, static code analysis, code reviews, bug tracking, and automated builds and testing. This is a application development best practice tools and templates need of software engineering infographics pdf template with various stages. Focus and dispense information on six stages using this creative set, that comes with editable features. It contains large content boxes to add your information on topics like version control, coding standards, code reviews, static code analysis, bug tracking. You can also showcase facts, figures, and other relevant content using this PPT layout. Grab it now.

Legal Benefits Realization Management Steps Needed To Implement Agile Into Law Team Infographics PDF
This slide provides the glimpse about the steps involved in implementing agile into the team such as setting vision, building product roadmap, releasing plan, planning sprints, daily tracking, sprint review, and sprint retrospective. This is a legal benefits realization management steps needed to implement agile into law team infographics pdf template with various stages. Focus and dispense information on seven stages using this creative set, that comes with editable features. It contains large content boxes to add your information on topics like vision with strategy, product roadmap, planning sprints, sprint review, team tracking. You can also showcase facts, figures, and other relevant content using this PPT layout. Grab it now.

Zestful Investor Capital Raising Pitch Deck Determine Key Characteristics Of Zestful Card Infographics PDF
This slide caters details about key characteristics of Zestful card in terms of real time tracking, card allowance, product allowance and product filtering. Presenting zestful investor capital raising pitch deck determine key characteristics of zestful card infographics pdf to provide visual cues and insights. Share and navigate important information on four stages that need your due attention. This template can be used to pitch topics like real time tracking, card allowance, product allowance, product filtering. In addtion, this PPT design contains high resolution images, graphics, etc, that are easily editable and available for immediate download.
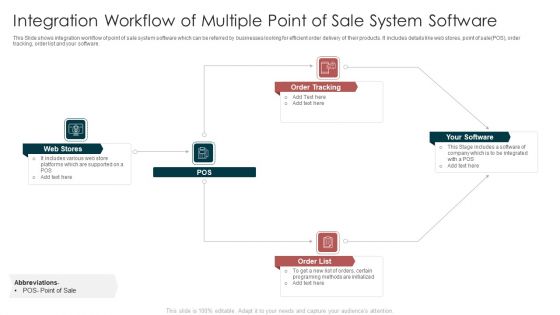
Integration Workflow Of Multiple Point Of Sale System Software Infographics PDF
This Slide shows integration workflow of point of sale system software which can be referred by businesses looking for efficient order delivery of their products. It includes details like web stores, point of sale POS, order tracking, order list and your software. Showcasing this set of slides titled Integration Workflow Of Multiple Point Of Sale System Software Infographics PDF. The topics addressed in these templates are Web Stores, Order Tracking, Your Software. All the content presented in this PPT design is completely editable. Download it and make adjustments in color, background, font etc. as per your unique business setting.

Digital Technology Solutions For Building Industry Ppt PowerPoint Presentation File Infographics PDF
The following slide showcases digital solutions for construction industry to track progress online, give real-time status updates and record number of working hours etc. It includes components such as design management, scheduling, materials management, crew tracking and quality control etc. Showcasing this set of slides titled Digital Technology Solutions For Building Industry Ppt PowerPoint Presentation File Infographics PDF. The topics addressed in these templates are Design Management, Scheduling, Materials Management. All the content presented in this PPT design is completely editable. Download it and make adjustments in color, background, font etc. as per your unique business setting.
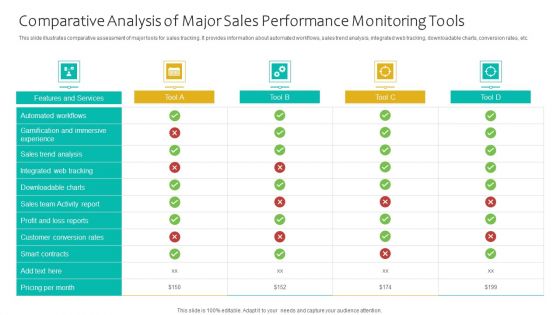
Comparative Analysis Of Major Sales Performance Monitoring Tools Ppt File Infographics PDF
This slide illustrates comparative assessment of major tools for sales tracking. It provides information about automated workflows, sales trend analysis, integrated web tracking, downloadable charts, conversion rates, etc. Pitch your topic with ease and precision using this Comparative Analysis Of Major Sales Performance Monitoring Tools Ppt File Infographics PDF. This layout presents information on Features And Services, Automated Workflows, Sales Trend Analysis. It is also available for immediate download and adjustment. So, changes can be made in the color, design, graphics or any other component to create a unique layout.
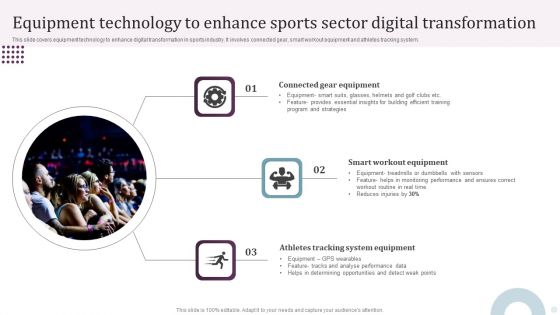
Equipment Technology To Enhance Sports Sector Digital Transformation Ppt PowerPoint Presentation Infographics Microsoft PDF
This slide covers equipment technology to enhance digital transformation in sports industry. It involves connected gear, smart workout equipment and athletes tracking system. Persuade your audience using this Equipment Technology To Enhance Sports Sector Digital Transformation Ppt PowerPoint Presentation Infographics Microsoft PDF. This PPT design covers three stages, thus making it a great tool to use. It also caters to a variety of topics including Connected Gear Equipment, Smart Workout Equipment, Athletes Tracking System. Download this PPT design now to present a convincing pitch that not only emphasizes the topic but also showcases your presentation skills.
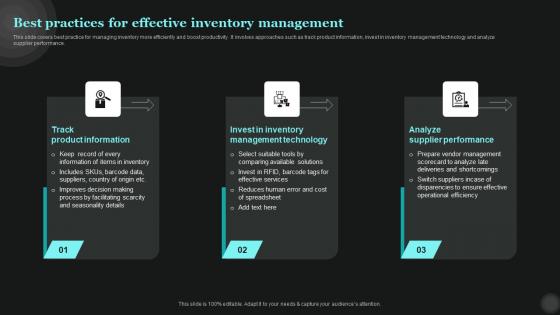
Best Practices For Effective Inventory Management Tech Asset Management Infographics Pdf
This slide covers best practice for managing inventory more efficiently and boost productivity. It involves approaches such as track product information, invest in inventory management technology and analyze supplier performance.Take your projects to the next level with our ultimate collection of Best Practices For Effective Inventory Management Tech Asset Management Infographics Pdf. Slidegeeks has designed a range of layouts that are perfect for representing task or activity duration, keeping track of all your deadlines at a glance. Tailor these designs to your exact needs and give them a truly corporate look with your own brand colors they all make your projects stand out from the rest.
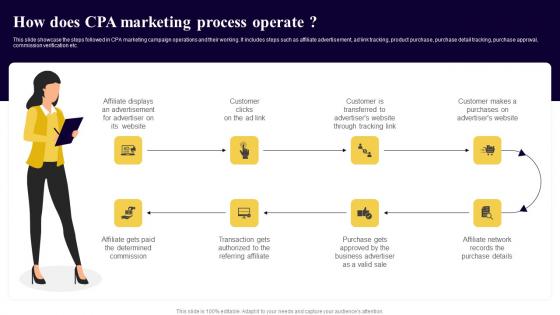
How Does CPA Marketing Process Operate Executing Cost Per Action Marketing Infographics Pdf
This slide showcase the steps followed in CPA marketing campaign operations and their working. It includes steps such as affiliate advertisement, ad link tracking, product purchase, purchase detail tracking, purchase approval, commission verification etc. If your project calls for a presentation, then Slidegeeks is your go-to partner because we have professionally designed, easy-to-edit templates that are perfect for any presentation. After downloading, you can easily edit How Does CPA Marketing Process Operate Executing Cost Per Action Marketing Infographics Pdf and make the changes accordingly. You can rearrange slides or fill them with different images. Check out all the handy templates
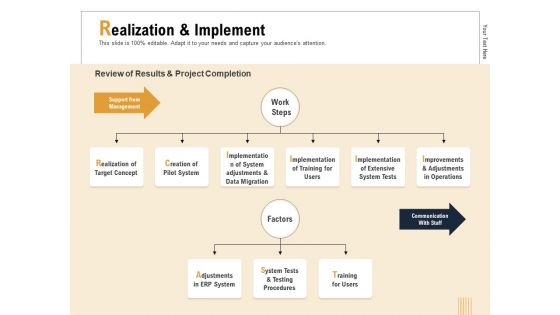
Business Activity Flows Optimization Realization And Implement Ppt PowerPoint Presentation Infographics Examples PDF
Presenting this set of slides with name business activity flows optimization realization and implement ppt powerpoint presentation infographics examples pdf. This is a two stage process. The stages in this process are realization of target concept, creation of pilot system, implementation of system adjustments and data migration, implementation training for users, implementation of extensive system tests, improvements and adjustments in operations, adjustments in erp system, system tests and testing procedures, training for users. This is a completely editable PowerPoint presentation and is available for immediate download. Download now and impress your audience.

Major Advantages Of Business Transformation Process Ppt PowerPoint Presentation Infographics Smartart PDF
This slide shows the key benefits of business process reengineering which includes clarity in business objectives, simplify the operations, increasing efficiency, better outcomes and maximizing investment returns. Presenting major advantages of business transformation process ppt powerpoint presentation infographics smartart pdf to dispense important information. This template comprises five stages. It also presents valuable insights into the topics including organizational objectives, makes procedures easy and fast, reengineering eliminates repetitive operations. This is a completely customizable PowerPoint theme that can be put to use immediately. So, download it and address the topic impactfully.

Impacts Of RUP Approach On Business Ppt Infographics Example Introduction PDF
This slide depicts the impacts of the rational unified process model on business, including improvement in current procedures, expertise in software engineering, requirement management standards, etc. Presenting impacts of rup approach on business ppt infographics example introduction pdf to provide visual cues and insights. Share and navigate important information on ten stages that need your due attention. This template can be used to pitch topics like methods, requirements, management, design, applications. In addtion, this PPT design contains high resolution images, graphics, etc, that are easily editable and available for immediate download.
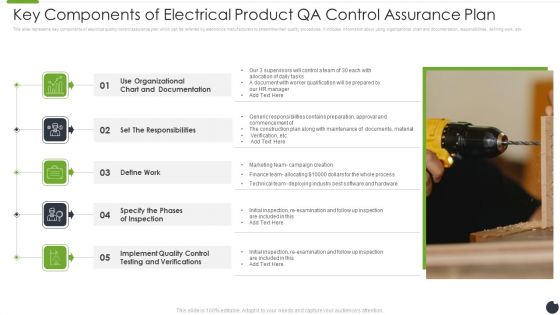
Key Components Of Electrical Product QA Control Assurance Plan Infographics PDF
This slide represents key components of electrical quality control assurance plan which can be referred by electronics manufacturers to streamline their quality procedures. It includes information about using organizational chart and documentation, responsibilities, defining work, etc. Presenting key components of electrical product qa control assurance plan infographics pdf to dispense important information. This template comprises five stages. It also presents valuable insights into the topics including set the responsibilities, define work, specify the phases of inspection. This is a completely customizable PowerPoint theme that can be put to use immediately. So, download it and address the topic impactfully.
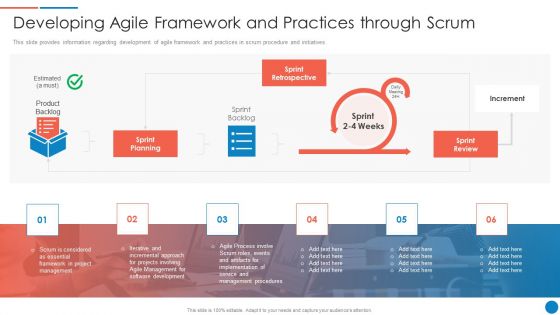
Playbook For Lean Agile Project Administration Developing Agile Framework And Practices Through Scrum Infographics PDF
This slide provides information regarding development of agile framework and practices in scrum procedure and initiatives. Presenting Playbook For Lean Agile Project Administration Developing Agile Framework And Practices Through Scrum Infographics PDF to provide visual cues and insights. Share and navigate important information on six stages that need your due attention. This template can be used to pitch topics like Sprint Planning, Agile Management, Software Development. In addtion, this PPT design contains high resolution images, graphics, etc, that are easily editable and available for immediate download.
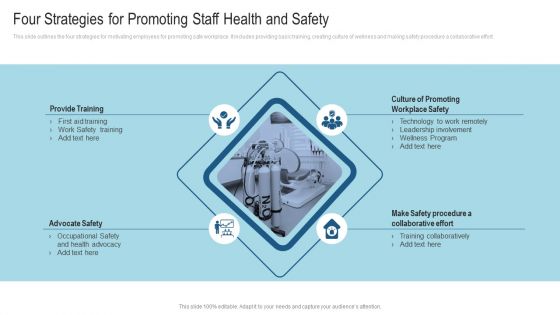
Four Strategies For Promoting Staff Health And Safety Ppt Infographics Example Introduction PDF
This slide outlines the four strategies for motivating employees for promoting safe workplace. It includes providing basic training, creating culture of wellness and making safety procedure a collaborative effort. Showcasing this set of slides titled Four Strategies For Promoting Staff Health And Safety Ppt Infographics Example Introduction PDF. The topics addressed in these templates are Provide Training, Advocate Safety, Culture Of Promoting, Workplace Safety. All the content presented in this PPT design is completely editable. Download it and make adjustments in color, background, font etc. as per your unique business setting.

IT Risk Control Strategies Risk Management Plan Ppt Infographics Background Images PDF
This slide focuses on the risk management plan for information technology project which includes risk level, control and supporting documents that further covers controlling options such as following emergency procedures, preparing maintenance schedule, etc. Showcasing this set of slides titled IT Risk Control Strategies Risk Management Plan Ppt Infographics Background Images PDF. The topics addressed in these templates are Risk Level, Control, Suppoting Documents. All the content presented in this PPT design is completely editable. Download it and make adjustments in color, background, font etc. as per your unique business setting.
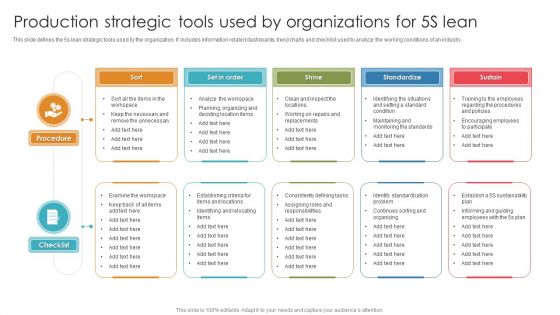
Production Strategic Tools Used By Organizations For 5S Lean Ppt Infographics Microsoft PDF
This slide defines the 5s lean strategic tools used by the organization. It includes information related dashboards, trend charts and checklist used to analyze the working conditions of an industry. Pitch your topic with ease and precision using this Production Strategic Tools Used By Organizations For 5S Lean Ppt Infographics Microsoft PDF. This layout presents information on Procedure, Checklist, Standardize. It is also available for immediate download and adjustment. So, changes can be made in the color, design, graphics or any other component to create a unique layout.
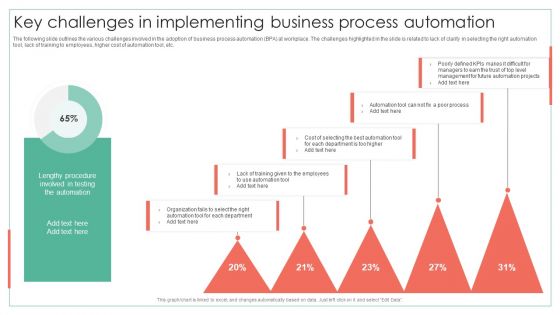
Key Challenges In Implementing Business Process Automation Achieving Operational Efficiency Infographics PDF
The following slide outlines the various challenges involved in the adoption of business process automation BPA at workplace. The challenges highlighted in the slide is related to lack of clarity in selecting the right automation tool, lack of training to employees, higher cost of automation tool, etc.Deliver an awe inspiring pitch with this creative Key Challenges In Implementing Business Process Automation Achieving Operational Efficiency Infographics PDF bundle. Topics like Lengthy Procedure, Involved Testing, Selecting Automation can be discussed with this completely editable template. It is available for immediate download depending on the needs and requirements of the user.
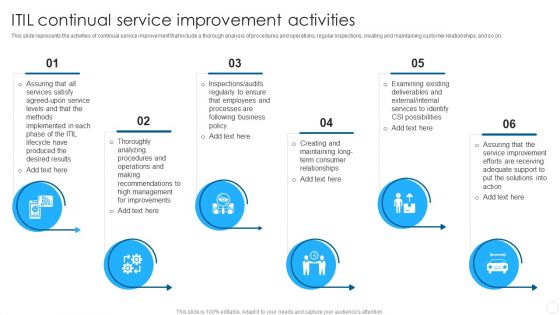
IT Infrastructure Library Methodology Implementation ITIL Continual Service Improvement Activities Infographics PDF
This slide represents the activities of continual service improvement that include a thorough analysis of procedures and operations, regular inspections, creating and maintaining customer relationships, and so on. This is a IT Infrastructure Library Methodology Implementation ITIL Continual Service Improvement Activities Infographics PDF template with various stages. Focus and dispense information on six stages using this creative set, that comes with editable features. It contains large content boxes to add your information on topics like Management, Analyzing, Services. You can also showcase facts, figures, and other relevant content using this PPT layout. Grab it now.

Process Of Transfer Digital Assets Between Sidechain And Its Mainnet Infographics PDF
This slide outlines the procedure to transfer digital assets between the sidechain and its mainnet. The purpose of this slide is to showcase the working process of a sidechain blockchain to transfer digital assets. The components include the mainchain, sidechain, smart contracts, and so on. If your project calls for a presentation, then Slidegeeks is your go-to partner because we have professionally designed, easy-to-edit templates that are perfect for any presentation. After downloading, you can easily edit Process Of Transfer Digital Assets Between Sidechain And Its Mainnet Infographics PDF and make the changes accordingly. You can rearrange slides or fill them with different images. Check out all the handy templates

Future User Statistics Of The Company After Implementing Omnichannel Marketing Infographics PDF
This slide shows the future estimated user statistics of the company after adopting omnichannel marketing strategy. These stats are related to traffic frequency, customer conversion rate, user retention rate, overall company sales etc. from the years 2019 to 2021 along with key takeaways. Deliver an awe-inspiring pitch with this creative future user statistics of the company after implementing omnichannel marketing infographics pdf bundle. Topics like performance parameters, direct traffic frequency, customer conversion rate, overall company sales, 2019 to 2021 estimated can be discussed with this completely editable template. It is available for immediate download depending on the needs and requirements of the user.
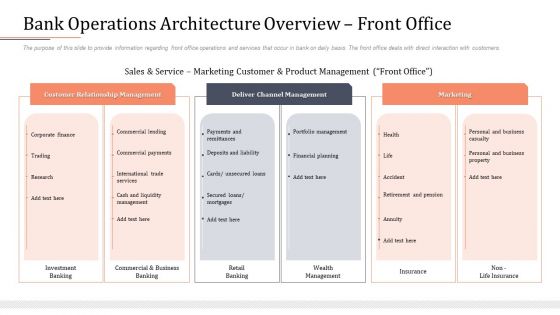
Modifying Banking Functionalities Bank Operations Architecture Overview Front Office Infographics PDF
The purpose of this slide to provide information regarding front office operations and services that occur in bank on daily basis. The front office deals with direct interaction with customers. This is a modifying banking functionalities bank operations architecture overview front office infographics pdf template with various stages. Focus and dispense information on three stages using this creative set, that comes with editable features. It contains large content boxes to add your information on topics like management, marketing, financial, planning, liability. You can also showcase facts, figures, and other relevant content using this PPT layout. Grab it now.
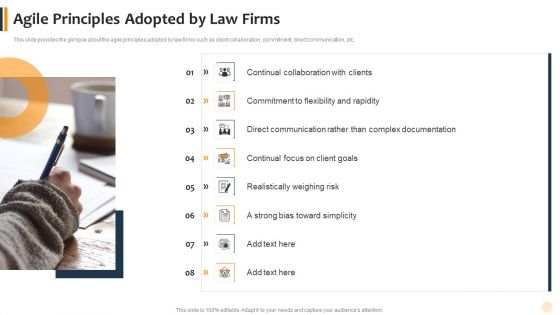
Agile Technique To Lawful Pitch And Proposals IT Agile Principles Adopted By Law Firms Infographics PDF
This slide provides the glimpse about the agile principles adopted by law firms such as client collaboration, commitment, direct communication, etc. This is a agile technique to lawful pitch and proposals it agile principles adopted by law firms infographics pdf template with various stages. Focus and dispense information on eight stages using this creative set, that comes with editable features. It contains large content boxes to add your information on topics like communication, documentation, risk, goals. You can also showcase facts, figures, and other relevant content using this PPT layout. Grab it now.
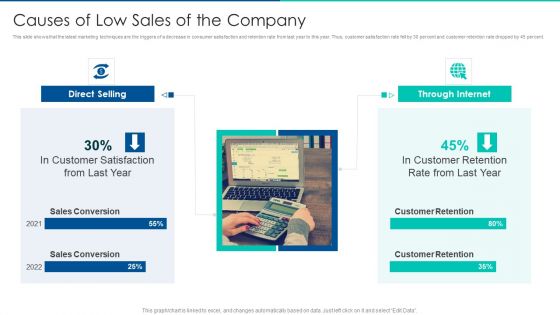
Sales Promotion Of Upgraded Product Through Upselling Causes Of Low Sales Of The Company Infographics PDF
This slide shows that the latest marketing techniques are the triggers of a decrease in consumer satisfaction and retention rate from last year to this year. Thus, customer satisfaction rate fell by 30 percent and customer retention rate dropped by 45 percent. Deliver an awe inspiring pitch with this creative sales promotion of upgraded product through upselling causes of low sales of the company infographics pdf bundle. Topics like direct selling, through internet can be discussed with this completely editable template. It is available for immediate download depending on the needs and requirements of the user.
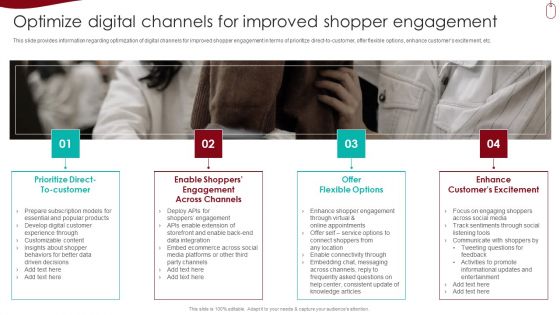
Retail Outlet Experience Optimization Playbook Optimize Digital Channels For Improved Shopper Engagement Infographics PDF
This slide provides information regarding optimization of digital channels for improved shopper engagement in terms of prioritize direct to customer, offer flexible options, enhance customers excitement, etc. Presenting Retail Outlet Experience Optimization Playbook Optimize Digital Channels For Improved Shopper Engagement Infographics PDF to provide visual cues and insights. Share and navigate important information on four stages that need your due attention. This template can be used to pitch topics like Offer Flexible Options, Enhance Customers Excitement, Social Listening Tools. In addtion, this PPT design contains high resolution images, graphics, etc, that are easily editable and available for immediate download.
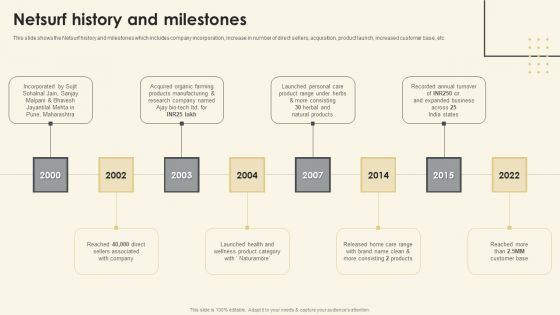
Netsurf Business Profile Netsurf History And Milestones Ppt Infographics Design Inspiration PDF
This slide shows the Netsurf history and milestones which includes company incorporation, increase in number of direct sellers, acquisition, product launch, increased customer base, etc. Presenting Netsurf Business Profile Netsurf History And Milestones Ppt Infographics Design Inspiration PDF to provide visual cues and insights. Share and navigate important information on eight stages that need your due attention. This template can be used to pitch topics like Acquired Organic Farming, Products Manufacturing, 2000 To 2022. In addtion, this PPT design contains high resolution images, graphics, etc, that are easily editable and available for immediate download.

AMR Robot Introduction Of Autonomous Mobile Robot Amr Ppt PowerPoint Presentation File Infographics PDF
This slide represents the introduction of autonomous mobile robots, and it also includes the market value in 2021 and the estimated CAGR rate by 2027. AMR robots can understand and navigate their surroundings without the direct instructions of a human. From laying roadmaps to briefing everything in detail, our templates are perfect for you. You can set the stage with your presentation slides. All you have to do is download these easy to edit and customizable templates. AMR Robot Introduction Of Autonomous Mobile Robot Amr Ppt PowerPoint Presentation File Infographics PDF will help you deliver an outstanding performance that everyone would remember and praise you for. Do download this presentation today.

Bank And Finance Risk Management Tools And Methodologies Key Figures Related Infographics PDF
This slide shows the key figures related to the bank such as turnover, guaranteed receivables, financed receivables, direct presence, client worldwide, etc. Want to ace your presentation in front of a live audience Our Bank And Finance Risk Management Tools And Methodologies Key Figures Related Infographics PDF can help you do that by engaging all the users towards you. Slidegeeks experts have put their efforts and expertise into creating these impeccable powerpoint presentations so that you can communicate your ideas clearly. Moreover, all the templates are customizable, and easy-to-edit and downloadable. Use these for both personal and commercial use.
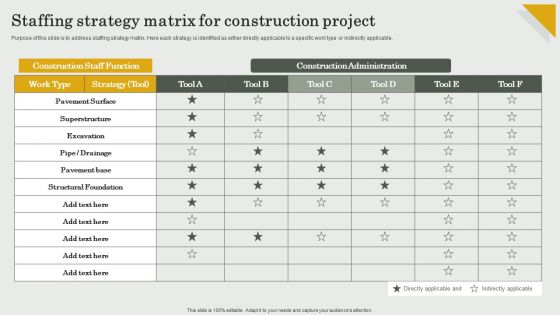
Submission Of Project Viability Report For Bank Loan Staffing Strategy Matrix For Construction Project Infographics PDF
Purpose of this slide is to address staffing strategy matrix. Here each strategy is identified as either directly applicable to a specific work type or indirectly applicable. Slidegeeks have 100 percent editable powerpoint slides making them incredibly versatile. With these quality presentation templates, you can create a captivating and memorable presentation by combining visually appealing slides and effectively communicating your message. Download Submission Of Project Viability Report For Bank Loan Staffing Strategy Matrix For Construction Project Infographics PDF from Slidegeeks and deliver a wonderful presentation.

Cremation Services Business Investor Funding Elevator Pitch Deck Financial Projections Infographics PDF
This slide represents financial estimate for the legal and funeral service company for two years, highlighting direct-to-consumer D2C revenue and partnership revenue. Find a pre designed and impeccable Cremation Services Business Investor Funding Elevator Pitch Deck Financial Projections Infographics PDF. The templates can ace your presentation without additional effort. You can download these easy to edit presentation templates to make your presentation stand out from others. So, what are you waiting for Download the template from Slidegeeks today and give a unique touch to your presentation.

Designing Great Client Experience Action Plan Customer Feedback And Rating Team Ppt Infographics Outfit PDF
Keep a track of customer feedback, both positive and negative to get the complete picture. This is a designing great client experience action plan customer feedback and rating team ppt infographics outfit pdf template with various stages. Focus and dispense information on five stages using this creative set, that comes with editable features. It contains large content boxes to add your information on topics like customer feedback and rating team. You can also showcase facts, figures, and other relevant content using this PPT layout. Grab it now.
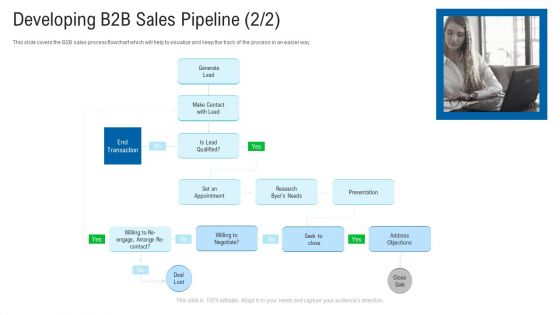
New Era Of B2B Trading Developing B2B Sales Pipeline Research Ppt Infographics Deck PDF
This slide covers the B2B sales process flowchart which will help to visualize and keep the track of the process in an easier way. This is a new era of B2B trading developing B2B sales pipeline research ppt infographics deck pdf. template with various stages. Focus and dispense information on one stage using this creative set, that comes with editable features. It contains large content boxes to add your information on topics like presentation, generate lead, end transaction. You can also showcase facts, figures, and other relevant content using this PPT layout. Grab it now.
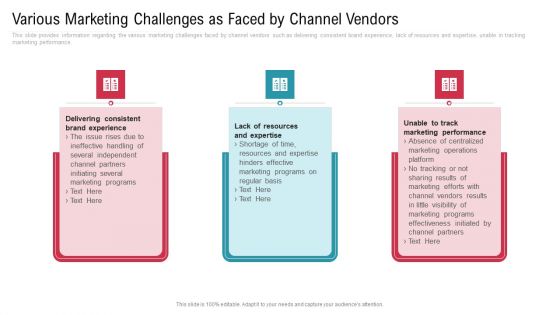
Co Variety Advertisement Various Marketing Challenges As Faced By Channel Vendors Infographics PDF
This slide provides information regarding the various marketing challenges faced by channel vendors such as delivering consistent brand experience, lack of resources and expertise, unable in tracking marketing performance. This is a co variety advertisement various marketing challenges as faced by channel vendors infographics pdf template with various stages. Focus and dispense information on three stages using this creative set, that comes with editable features. It contains large content boxes to add your information on topics like resources and expertise, marketing performance, brand experience. You can also showcase facts, figures, and other relevant content using this PPT layout. Grab it now.
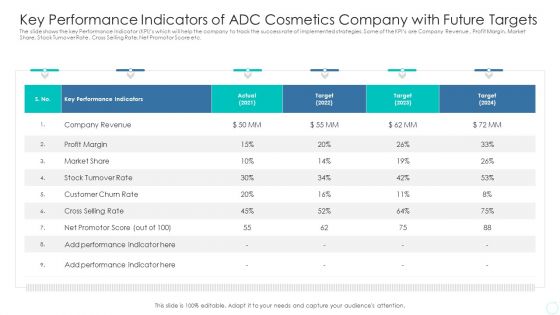
Key Performance Indicators Of ADC Cosmetics Company With Future Targets Infographics PDF
The slide shows the key Performance Indicator KPIs which will help the company to track the success rate of implemented strategies. Some of the KPIs are Company Revenue , Profit Margin, Market Share, Stock Turnover Rate , Cross Selling Rate, Net Promotor Score etc. Deliver and pitch your topic in the best possible manner with this key performance indicators of adc cosmetics company with future targets infographics pdf. Use them to share invaluable insights on company revenue, profit margin, market share, stock turnover rate, customer churn rate and impress your audience. This template can be altered and modified as per your expectations. So, grab it now.
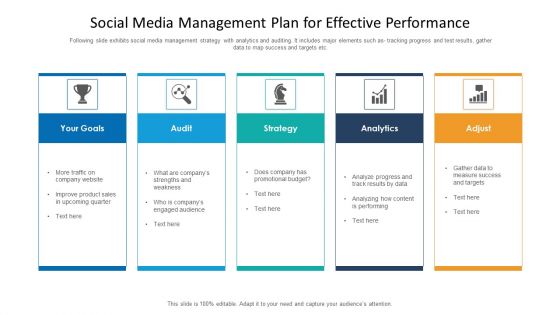
Social Media Management Plan For Effective Performance Ppt Infographics Background Images PDF
Following slide exhibits social media management strategy with analytics and auditing. It includes major elements such as- tracking progress and test results, gather data to map success and targets etc. Showcasing this set of slides titled social media management plan for effective performance ppt infographics background images pdf. The topics addressed in these templates are strategy, analytics, adjust, goals, audit. All the content presented in this PPT design is completely editable. Download it and make adjustments in color, background, font etc. as per your unique business setting.

Challenges Faced By Global Logistics And Supply Chain Companies Infographics PDF
This slide shows some common challenges and problems that are faced by Global Logistics and Supply Chain Companies such as Increasing Fuel Costs, poor Business Process Improvements, Problematic Automated Softwares, Unavailability of Real Time Freight Data, Shipment and Carrier Tracking issues etc. Deliver an awe inspiring pitch with this creative challenges faced by global logistics and supply chain companies infographics pdf bundle. Topics like increasing fuel costs, business process improvements, problematic automated softwares can be discussed with this completely editable template. It is available for immediate download depending on the needs and requirements of the user.

Rising Construction Defect Claims Against The Corporation Key Performance Indicators Construction Company Infographics PDF
The slide shows the key Performance Indicator KPI s which will help the company to track the success rate of implemented strategies. Major KPIs include Number of construction projects, Number of construction defect, Total project cost, customer satisfaction level etc. Deliver an awe inspiring pitch with this creative rising construction defect claims against the corporation key performance indicators construction company infographics pdf bundle. Topics like performance, project, customer satisfaction level can be discussed with this completely editable template. It is available for immediate download depending on the needs and requirements of the user.
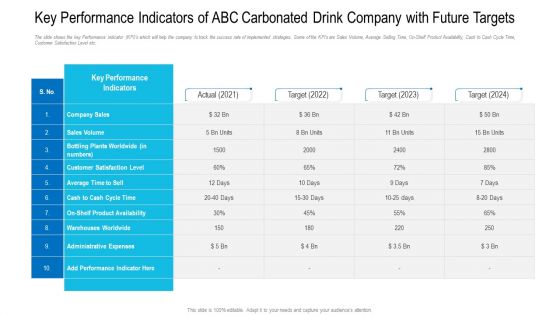
Key Performance Indicators Of ABC Carbonated Drink Company With Future Targets Infographics PDF
The slide shows the key Performance Indicator KPI s which will help the company to track the success rate of implemented strategies. Some of the KPIs are Sales Volume, Average Selling Time, On-Shelf Product Availability, Cash to Cash Cycle Time, Customer Satisfaction Level etc. Deliver and pitch your topic in the best possible manner with this key performance indicators of abc carbonated drink company with future targets infographics pdf. Use them to share invaluable insights on company sales, sales volume, average time to sell, cash to cash cycle time and impress your audience. This template can be altered and modified as per your expectations. So, grab it now.
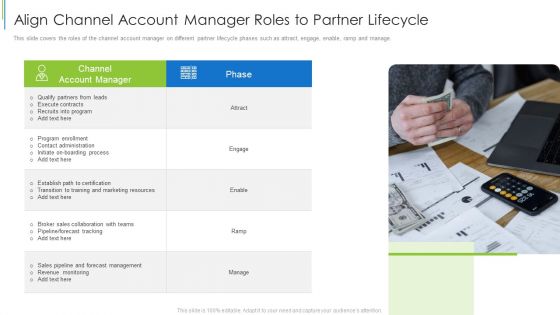
Align Channel Account Manager Roles To Partner Lifecycle Ppt Infographics Visual Aids PDF
This slide covers the roles of the channel account manager on different partner lifecycle phases such as attract, engage, enable, ramp and manage. Presenting align channel account manager roles to partner lifecycle ppt infographics visual aids pdf to provide visual cues and insights. Share and navigate important information on one stages that need your due attention. This template can be used to pitch topics like contact administration, execute contracts, forecast tracking. In addtion, this PPT design contains high resolution images, graphics, etc, that are easily editable and available for immediate download.
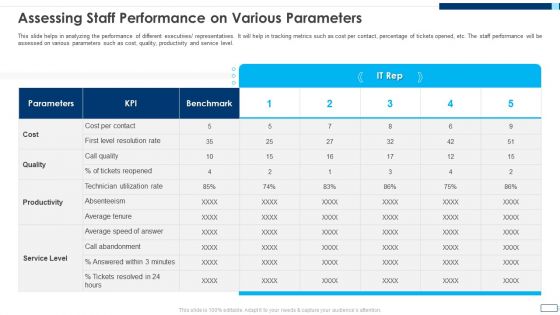
Evolving BI Infrastructure Assessing Staff Performance On Various Parameters Infographics PDF
This slide helps in analyzing the performance of different executives or representatives. It will help in tracking metrics such as cost per contact, percentage of tickets opened, etc. The staff performance will be assessed on various parameters such as cost, quality, productivity and service level. Deliver an awe inspiring pitch with this creative evolving bi infrastructure assessing staff performance on various parameters infographics pdf bundle. Topics like cost, quality, productivity, service level, parameters can be discussed with this completely editable template. It is available for immediate download depending on the needs and requirements of the user.
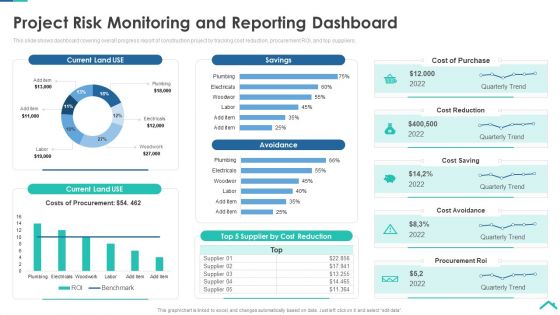
Risk Analysis Strategies For Real Estate Construction Project Project Risk Monitoring And Reporting Infographics PDF
This slide shows dashboard covering overall progress report of construction project by tracking cost reduction, procurement ROI, and top suppliers. Deliver and pitch your topic in the best possible manner with this risk analysis strategies for real estate construction project project risk monitoring and reporting infographics pdf. Use them to share invaluable insights on cost of purchase, cost reduction, cost saving, cost avoidance, procurement roi and impress your audience. This template can be altered and modified as per your expectations. So, grab it now.
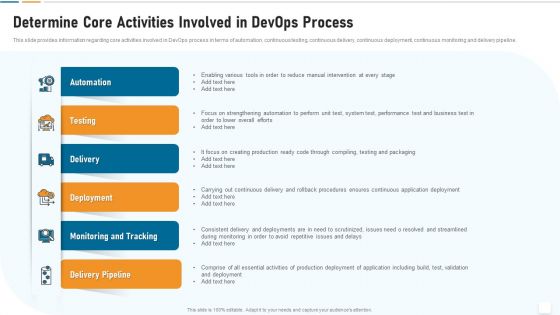
Strategic Development And Operations Execution IT Determine Core Activities Involved Infographics PDF
This slide provides information regarding core activities involved in DevOps process in terms of automation, continuous testing, continuous delivery, continuous deployment, continuous monitoring and delivery pipeline. Presenting strategic development and operations execution it determine core activities involved infographics pdf to provide visual cues and insights. Share and navigate important information on six stages that need your due attention. This template can be used to pitch topics like automation, testing, delivery, deployment, monitoring and tracking. In addtion, this PPT design contains high resolution images, graphics, etc, that are easily editable and available for immediate download.
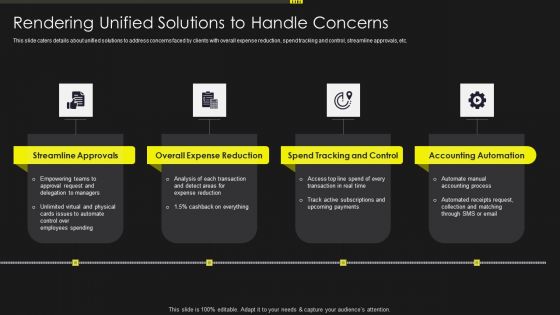
Investment Service Provider Capital Raising Elevator Rendering Unified Solutions Infographics PDF
This slide caters details about unified solutions to address concerns faced by clients with overall expense reduction, spend tracking and control, streamline approvals, etc. Presenting investment service provider capital raising elevator rendering unified solutions infographics pdf to provide visual cues and insights. Share and navigate important information on four stages that need your due attention. This template can be used to pitch topics like teams, payments, accounting process. In addtion, this PPT design contains high resolution images, graphics, etc, that are easily editable and available for immediate download.

Moz Investor Capital Raising SEO Solutions Offered By Moz Ppt Infographics Slideshow PDF
This slide provides information about some of the SEO solutions that are offered by Moz for researching and modifying SEO keywords and generating relevant content. This is a moz investor capital raising seo solutions offered by moz ppt infographics slideshow pdf template with various stages. Focus and dispense information on four stages using this creative set, that comes with editable features. It contains large content boxes to add your information on topics like site audits, rank tracking, backlink analysis, keyword research. You can also showcase facts, figures, and other relevant content using this PPT layout. Grab it now.
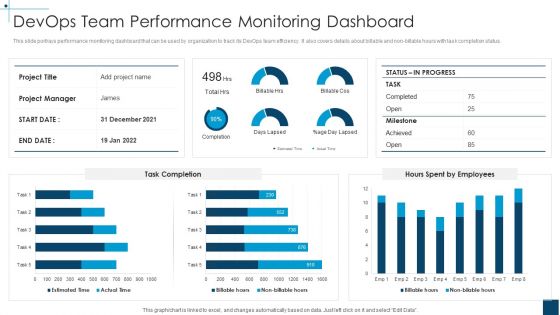
Devops Principles For Hybrid Cloud IT Devops Team Performance Monitoring Dashboard Infographics PDF
This slide portrays performance monitoring dashboard that can be used by organization to track its DevOps team efficiency. It also covers details about billable and non-billable hours with task completion status.Deliver and pitch your topic in the best possible manner with this devops principles for hybrid cloud it devops team performance monitoring dashboard infographics pdf Use them to share invaluable insights on devops team performance monitoring dashboard and impress your audience. This template can be altered and modified as per your expectations. So, grab it now.

Operating B2B Sales Content Planning Worksheet For Account Nurturing Infographics PDF
This slide provides information regarding the content marketing worksheet that is prepared to keep track on different personalized campaigns initiated for individual customer. Customized content is in the form of webinars, blogs, social media campaigns, etc. Deliver an awe inspiring pitch with this creative operating b2b sales content planning worksheet for account nurturing infographics pdf bundle. Topics like content planning worksheet for account nurturing can be discussed with this completely editable template. It is available for immediate download depending on the needs and requirements of the user.
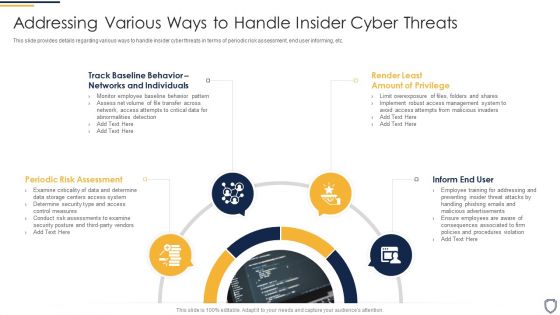
Corporate Security And Risk Management Addressing Various Ways To Handle Insider Cyber Threats Infographics PDF
This slide provides details regarding various ways to handle insider cyber threats in terms of periodic risk assessment, end user informing, etc. This is a corporate security and risk management addressing various ways to handle insider cyber threats infographics pdf template with various stages. Focus and dispense information on four stages using this creative set, that comes with editable features. It contains large content boxes to add your information on topics like periodic risk assessment, inform end user, render least amount of privilege, track baseline behavior networks and individuals . You can also showcase facts, figures, and other relevant content using this PPT layout. Grab it now.
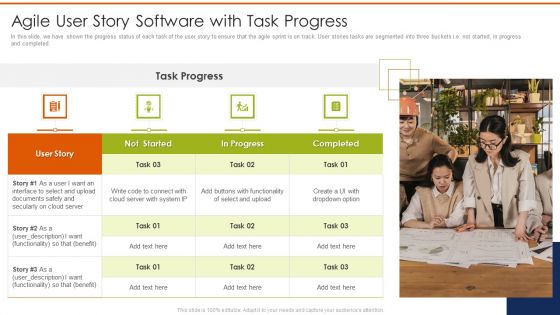
Agile User Story Software With Task Progress Ppt Slides Infographics PDF
In this slide, we have shown the progress status of each task of the user story to ensure that the agile sprint is on track. User stories tasks are segmented into three buckets i.e. not started, in progress and completed. This is a agile user story software with task progress ppt slides infographics pdf template with various stages. Focus and dispense information on one stages using this creative set, that comes with editable features. It contains large content boxes to add your information on topics like agile user story software with task progress. You can also showcase facts, figures, and other relevant content using this PPT layout. Grab it now.

 Home
Home