Revenue
Consumer Journey Mapping Techniques Referral Program Performance Tracking Dashboard Formats PDF
This slide covers the KPI dashboard for analyzing referral campaign results. It includes metrics such as total revenue generated, monthly recurring revenue, new customers, clicks, cancelled customers, paying customers, etc. Showcasing this set of slides titled Consumer Journey Mapping Techniques Referral Program Performance Tracking Dashboard Formats PDF. The topics addressed in these templates are Revenue, New Customers, Paying Customers. All the content presented in this PPT design is completely editable. Download it and make adjustments in color, background, font etc. as per your unique business setting.
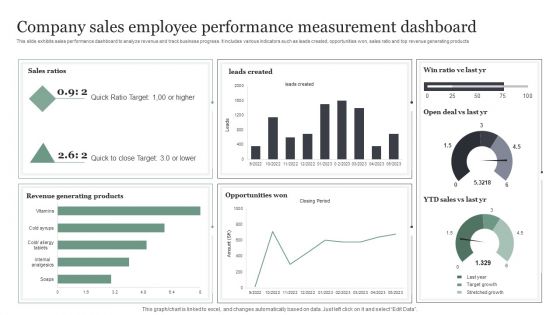
Company Sales Employee Performance Measurement Dashboard Information PDF
This slide exhibits sales performance dashboard to analyze revenue and track business progress. It includes various indicators such as leads created, opportunities won, sales ratio and top revenue generating products. Showcasing this set of slides titled Company Sales Employee Performance Measurement Dashboard Information PDF. The topics addressed in these templates are Quick Ratio Target, Opportunities Won, Revenue Generating Products. All the content presented in this PPT design is completely editable. Download it and make adjustments in color, background, font etc. as per your unique business setting.

Supermarket Online Service Delivery And Management Dashboard Formats PDF
This slide shows the online grocery delivery dashboard of various products based on certain metrics and KPIs to achieve grocery retail revenue goals. It includes total orders, total customers total categories, and revenue. Showcasing this set of slides titled Supermarket Online Service Delivery And Management Dashboard Formats PDF. The topics addressed in these templates are Total Revenue, Total Customers, Dashboard. All the content presented in this PPT design is completely editable. Download it and make adjustments in color, background, font etc. as per your unique business setting.
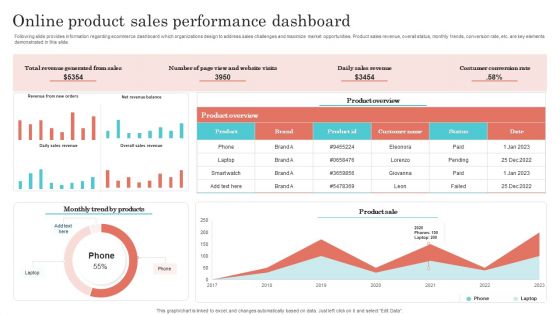
Online Product Sales Performance Dashboard Designs PDF
Following slide provides information regarding ecommerce dashboard which organizations design to address sales challenges and maximize market opportunities. Product sales revenue, overall status, monthly trends, conversion rate, etc. are key elements demonstrated in this slide. Showcasing this set of slides titled Online Product Sales Performance Dashboard Designs PDF. The topics addressed in these templates are Revenue Generated From Sales, Daily Sales Revenue, Costumer Conversion Rate. All the content presented in this PPT design is completely editable. Download it and make adjustments in color, background, font etc. as per your unique business setting.
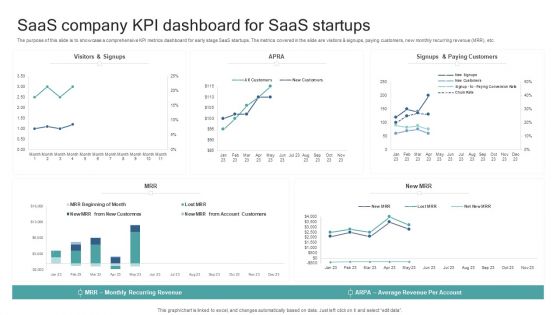
Saas Company KPI Dashboard For Saas Startups Background PDF
The purpose of this slide is to showcase a comprehensive KPI metrics dashboard for early stage SaaS startups. The metrics covered in the slide are visitors and signups, paying customers, new monthly recurring revenue MRR, etc. Showcasing this set of slides titled Saas Company KPI Dashboard For Saas Startups Background PDF. The topics addressed in these templates are Average Revenue Per Account, Monthly Recurring Revenue. All the content presented in this PPT design is completely editable. Download it and make adjustments in color, background, font etc. as per your unique business setting.

Saas Company Management Dashboard With Key Kpl Template PDF
The purpose of this slide is to showcase various metrics of SaaS company in the form of dashboard. The metrics could be, Paying customers, monthly recurring revenue MRR, customer acquisition cost CAC, etc. Showcasing this set of slides titled Saas Company Management Dashboard With Key Kpl Template PDF. The topics addressed in these templates are Monthly Recurring Revenue, Customer Acquisition Cost, Customer Lifetime Value, Average Revenue Per Unit. All the content presented in this PPT design is completely editable. Download it and make adjustments in color, background, font etc. as per your unique business setting.

Sales Dashboard After Using Digital Technology Approaches Infographics PDF
Following slide shows the sales dashboard with the use of digital technology which will assist in generating more of leads in a business . It includes KPI such as revenue generation, revenue chart , client satisfaction , etc. Showcasing this set of slides titled Sales Dashboard After Using Digital Technology Approaches Infographics PDF. The topics addressed in these templates are Licenses Sold, Revenue Generation, Client Satisfaction. All the content presented in this PPT design is completely editable. Download it and make adjustments in color, background, font etc. as per your unique business setting.

Sales Sales By Geographic Region Report With Doughnut Chart Themes PDF
This slide illustrates graphical representation of sales contribution of countries. It includes revenue of FY19 in percentage and numbers and revenue of FY20 in percentage and numbers. Showcasing this set of slides titled Sales Sales By Geographic Region Report With Doughnut Chart Themes PDF. The topics addressed in these templates are Revenue, Doughnut Chart, Geographic Region Report. All the content presented in this PPT design is completely editable. Download it and make adjustments in color, background, font etc. as per your unique business setting.
Market Study Company Outline Diversified And Growing Business Icons PDF
This slide highlights the Nielsen diversified and growing business which includes solutions revenue share, customer base and revenue by geography, contracted revenue and years of experience. Slidegeeks has constructed Market Study Company Outline Diversified And Growing Business Icons PDF after conducting extensive research and examination. These presentation templates are constantly being generated and modified based on user preferences and critiques from editors. Here, you will find the most attractive templates for a range of purposes while taking into account ratings and remarks from users regarding the content. This is an excellent jumping off point to explore our content and will give new users an insight into our top notch PowerPoint Templates.

Data And Customer Analysis Company Outline Diversified And Growing Business Elements PDF
This slide highlights the Nielsen diversified and growing business which includes solutions revenue share, customer base and revenue by geography, contracted revenue and years of experience. Find a pre designed and impeccable Data And Customer Analysis Company Outline Diversified And Growing Business Elements PDF. The templates can ace your presentation without additional effort. You can download these easy to edit presentation templates to make your presentation stand out from others. So, what are you waiting for Download the template from Slidegeeks today and give a unique touch to your presentation.
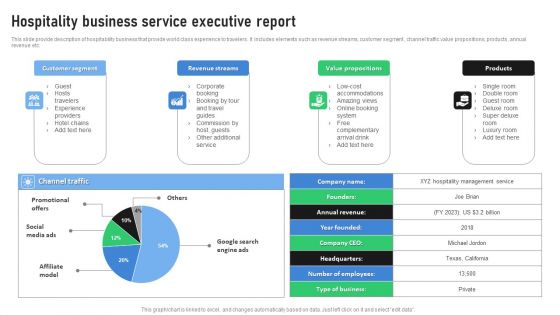
Hospitality Business Service Executive Report Demonstration PDF
This slide provide description of hospitability business that provide world class experience to travelers. It includes elements such as revenue streams, customer segment , channel traffic value propositions, products, annual revenue etc. Showcasing this set of slides titled Hospitality Business Service Executive Report Demonstration PDF. The topics addressed in these templates are Customer Segment, Revenue Streams, Value Propositions. All the content presented in this PPT design is completely editable. Download it and make adjustments in color, background, font etc. as per your unique business setting.
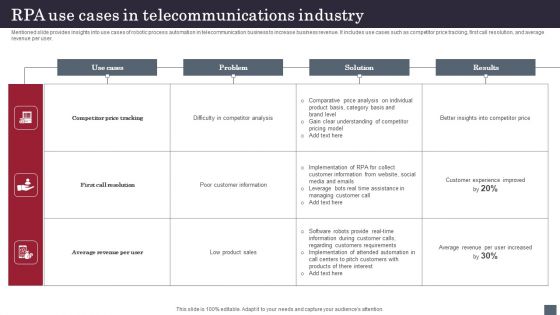
RPA Use Cases In Telecommunications Industry Infographics PDF
Mentioned slide provides insights into use cases of robotic process automation in telecommunication business to increase business revenue. It includes use cases such as competitor price tracking, first call resolution, and average revenue per user. Showcasing this set of slides titled RPA Use Cases In Telecommunications Industry Infographics PDF. The topics addressed in these templates are Competitor Price Tracking, First Call Resolution, Average Revenue Per User . All the content presented in this PPT design is completely editable. Download it and make adjustments in color, background, font etc. as per your unique business setting.

KPI Dashboard To Track Monthly Business Goals Microsoft Pdf
Following slide demonstrates KPI dashboard for monitoring monthly revenue targets achieved by business to determine overall organisation growth. It includes key components such as monthly business revenue, new customer base, average revenue and customer acquisition cost. Pitch your topic with ease and precision using this KPI Dashboard To Track Monthly Business Goals Microsoft Pdf. This layout presents information on Target Per Customer, Target Set. It is also available for immediate download and adjustment. So, changes can be made in the color, design, graphics or any other component to create a unique layout.

Business Kpis To Plan Subscription Strategic Pictures Pdf
The following slide highlights business key performance indicators to plan subscription strategy. It includes various metrics such as monthly recurring revenue, customer lifetime value, churn rate and average revenue per user. Showcasing this set of slides titled Business Kpis To Plan Subscription Strategic Pictures Pdf. The topics addressed in these templates are Monthly Recurring Revenue, Customer Lifetime Value, Churn Rate. All the content presented in this PPT design is completely editable. Download it and make adjustments in color, background, font etc. as per your unique business setting.
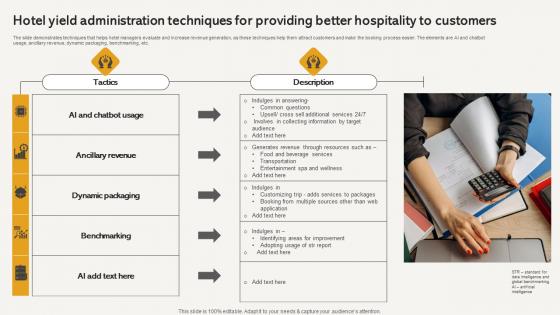
Hotel Yield Administration Techniques For Providing Better Hospitality To Customers Sample Pdf
The slide demonstrates techniques that helps hotel managers evaluate and increase revenue generation, as these techniques help them attract customers and make the booking process easier. The elements are AI and chatbot usage, ancillary revenue, dynamic packaging, benchmarking, etc. Showcasing this set of slides titled Hotel Yield Administration Techniques For Providing Better Hospitality To Customers Sample Pdf The topics addressed in these templates are Ancillary Revenue, Dynamic Packaging, Benchmarking All the content presented in this PPT design is completely editable. Download it and make adjustments in color, background, font etc. as per your unique business setting.

Sales Kpi Performance Summary Ppt PowerPoint Presentation Infographic Template Elements
This is a sales kpi performance summary ppt powerpoint presentation infographic template elements. This is a seven stage process. The stages in this process are revenue comparison, quantity comparison, product sales mix, regional sales mix, budget.
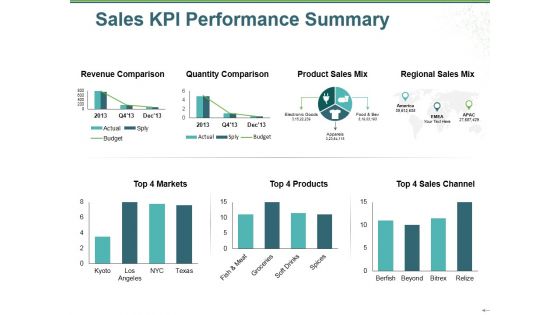
Sales Kpi Performance Summary Ppt PowerPoint Presentation Show Inspiration
This is a sales kpi performance summary ppt powerpoint presentation show inspiration. This is a two stage process. The stages in this process are revenue comparison, quantity comparison, product sales mix, regional sales mix, budget.
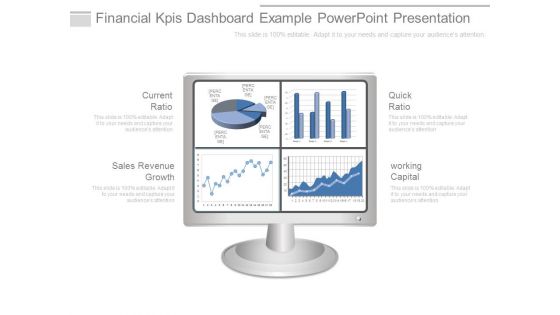
Financial Kpis Dashboard Example Powerpoint Presentation
This is a financial kpis dashboard example powerpoint presentation. This is a four stage process. The stages in this process are current ratio, sales revenue growth, quick ratio, working capital.

Financial Scorecard Example Powerpoint Presentation Examples
This is a financial scorecard example powerpoint presentation examples. This is a four stage process. The stages in this process are working capital, quick ratio, current ratio, sales revenue growth.

Financial Performance Content Management Platform Investor Funding Elevator Pitch Deck
This slide provides glimpse of the financial performance of content marketing platform. It provides information about annual revenue, revenue per employee, variance of revenue growth, and annual revenue growth since founding. Present like a pro with Financial Performance Content Management Platform Investor Funding Elevator Pitch Deck. Create beautiful presentations together with your team, using our easy-to-use presentation slides. Share your ideas in real-time and make changes on the fly by downloading our templates. So whether you are in the office, on the go, or in a remote location, you can stay in sync with your team and present your ideas with confidence. With Slidegeeks presentation got a whole lot easier. Grab these presentations today.
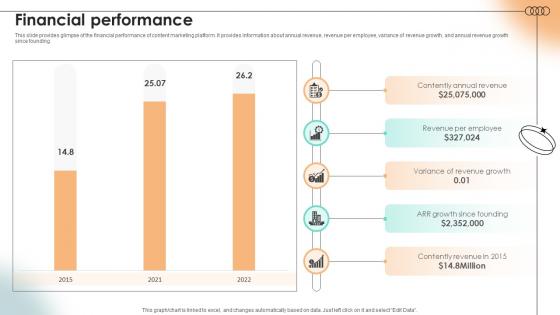
Financial Performance Content Marketing Platform Investor Funding Elevator Pitch Deck
This slide provides glimpse of the financial performance of content marketing platform. It provides information about annual revenue, revenue per employee, variance of revenue growth, and annual revenue growth since founding. Slidegeeks is here to make your presentations a breeze with Financial Performance Content Marketing Platform Investor Funding Elevator Pitch Deck With our easy-to-use and customizable templates, you can focus on delivering your ideas rather than worrying about formatting. With a variety of designs to choose from, you are sure to find one that suits your needs. And with animations and unique photos, illustrations, and fonts, you can make your presentation pop. So whether you are giving a sales pitch or presenting to the board, make sure to check out Slidegeeks first

Financial Projection Content Marketing Platform Investor Funding Elevator Pitch Deck
This slide highlights the anticipated annual change in revenue over the span of the next four years. It includes elements such as actual revenue, forecasted revenue, and estimated revenue per employee. Do you have an important presentation coming up Are you looking for something that will make your presentation stand out from the rest Look no further than Financial Projection Content Marketing Platform Investor Funding Elevator Pitch Deck. With our professional designs, you can trust that your presentation will pop and make delivering it a smooth process. And with Slidegeeks, you can trust that your presentation will be unique and memorable. So why wait Grab Financial Projection Content Marketing Platform Investor Funding Elevator Pitch Deck today and make your presentation stand out from the rest
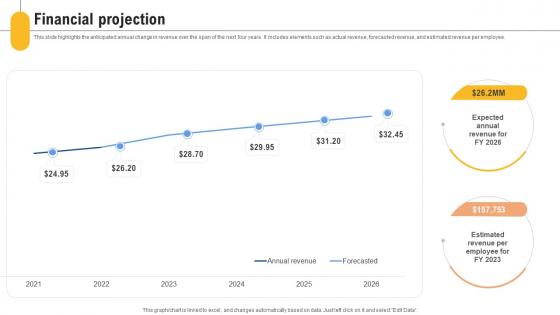
Financial Projection Content Management Platform Investor Funding Elevator Pitch Deck
This slide highlights the anticipated annual change in revenue over the span of the next four years. It includes elements such as actual revenue, forecasted revenue, and estimated revenue per employee. Slidegeeks is here to make your presentations a breeze with Financial Projection Content Management Platform Investor Funding Elevator Pitch Deck With our easy-to-use and customizable templates, you can focus on delivering your ideas rather than worrying about formatting. With a variety of designs to choose from, you are sure to find one that suits your needs. And with animations and unique photos, illustrations, and fonts, you can make your presentation pop. So whether you are giving a sales pitch or presenting to the board, make sure to check out Slidegeeks first.

Example Of Economic Issues Ppt Powerpoint Shapes
This is a example of economic issues ppt powerpoint shapes. This is a five stage process. The stages in this process are electricity shortfall, dependence on loans, excess of import than export, weak revenue system, foreign exchange rate.

Business Economic Value Diagram Ppt Slides Examples
This is a business economic value diagram ppt slides examples. This is a four stage process. The stages in this process are revenue model, value chain structure, value proposition, market segments.
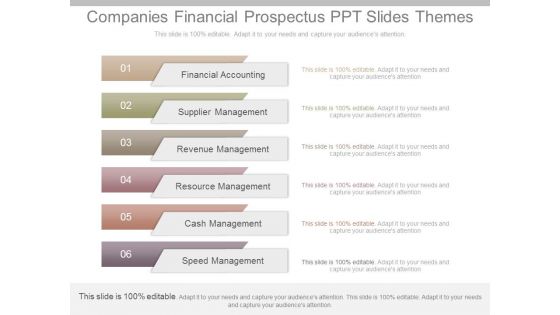
Companies Financial Prospectus Ppt Slides Themes
This is a companies financial prospectus ppt slides themes. This is a six stage process. The stages in this process are financial accounting, supplier management, revenue management, resource management, cash management, speed management.
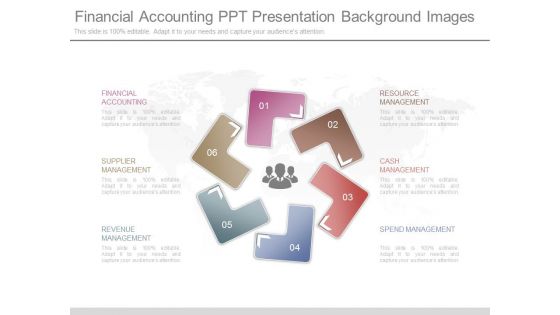
Financial Accounting Ppt Presentation Background Images
This is a financial accounting ppt presentation background images. This is a six stage process. The stages in this process are financial accounting, supplier management, revenue management, resource management, cash management, spend management.

Financial Measures Ppt PowerPoint Presentation Model Infographics
This is a financial measures ppt powerpoint presentation model infographics. This is a seven stage process. The stages in this process are cost of raw material, revenue from goods sold, inventory holding cost, transportation cost, cost of expired perishable goods.
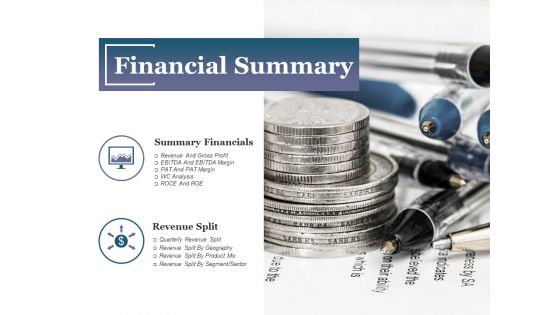
Financial Summary Ppt PowerPoint Presentation Infographics Design Inspiration
This is a financial summary ppt powerpoint presentation infographics design inspiration. This is a two stage process. The stages in this process are summary financials, revenue split, financial summary, business, marketing.
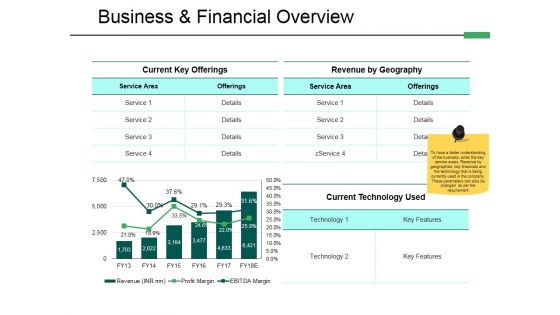
Business And Financial Overview Ppt PowerPoint Presentation Pictures Visuals
This is a business and financial overview ppt powerpoint presentation pictures visuals. This is a two stage process. The stages in this process are current key offerings, revenue by geography, current technology used, business financial overview.

Sales Performance Dashboard Ppt PowerPoint Presentation Show
This is a sales performance dashboard ppt powerpoint presentation show. This is a four stage process. The stages in this process are lead sources revenue share, total sales by month, opportunities total sales by probability, win loss ratio.
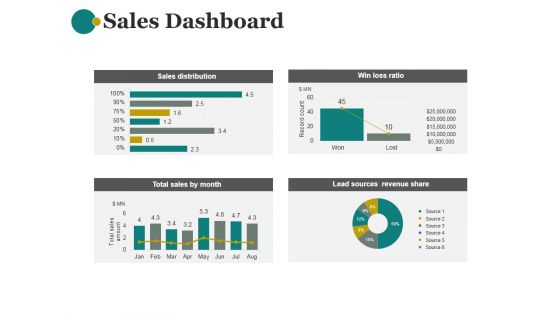
Sales Dashboard Template 2 Ppt PowerPoint Presentation Examples
This is a sales dashboard template 2 ppt powerpoint presentation examples. This is a four stage process. The stages in this process are sales distribution, win loss ratio, lead sources revenue share, total sales by month.
Website Performance Review Template 2 Ppt PowerPoint Presentation Icon Design Ideas
This is a website performance review template 2 ppt powerpoint presentation icon design ideas. This is a four stage process. The stages in this process are column two, revenue trends, traffic sources.
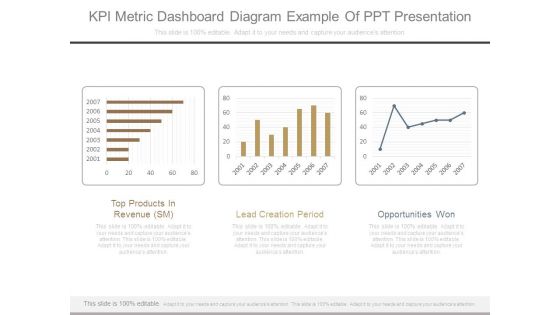
Kpi Metric Dashboard Diagram Example Of Ppt Presentation
This is a kpi metric dashboard diagram example of ppt presentation. This is a three stage process. The stages in this process are top products in revenue sm, lead creation period, opportunities won.
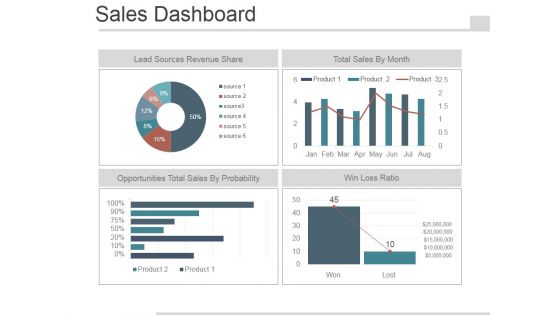
Sales Dashboard Slide Template 2 Ppt PowerPoint Presentation Images
This is a sales dashboard slide template 2 ppt powerpoint presentation images. This is a four stage process. The stages in this process are lead sources revenue share, total sales by month, opportunities total sales by probability, win loss ratio.
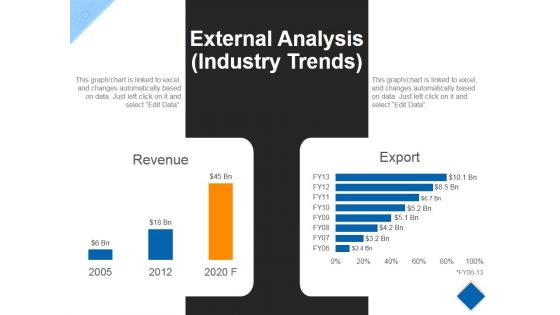
External Analysis Template 2 Ppt PowerPoint Presentation Styles Example File
This is a external analysis template 2 ppt powerpoint presentation styles example file. This is a two stage process. The stages in this process are revenue export, year, growth.

Goals Of Funding Ppt PowerPoint Presentation Pictures Format
This is a goals of funding ppt powerpoint presentation pictures format. This is a five stage process. The stages in this process are market share will increase by, operating cost will reduce by, revenue will increase by.
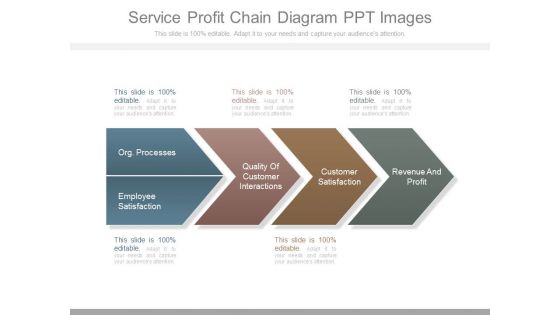
Service Profit Chain Diagram Ppt Images
This is a service profit chain diagram ppt images. This is a four stage process. The stages in this process are org processes, employee satisfaction, quality of customer interactions, customer satisfaction, revenue and profit.
Stacked Line Ppt PowerPoint Presentation Icon Professional
This is a stacked line ppt powerpoint presentation icon professional. This is a three stage process. The stages in this process are Business, Financial, Marketing, Graph, Strategy Revenue In Percentage.
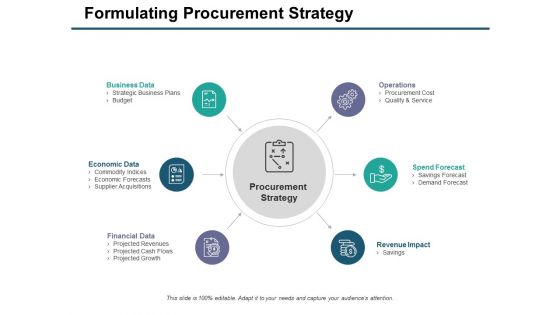
Formulating Procurement Strategy Ppt PowerPoint Presentation Model Visual Aids
This is a formulating procurement strategy ppt powerpoint presentation model visual aids. This is a six stage process. The stages in this process are business data, operations, revenue impact, financial data, economic data.

Daily Executive Dashboards For Web Ppt Presentation Ideas
This is a daily executive dashboards for web ppt presentation ideas. This is a six stage process. The stages in this process are homepage, login, purchase ticket, email confirmation, ecommerce website, revenue per minute.
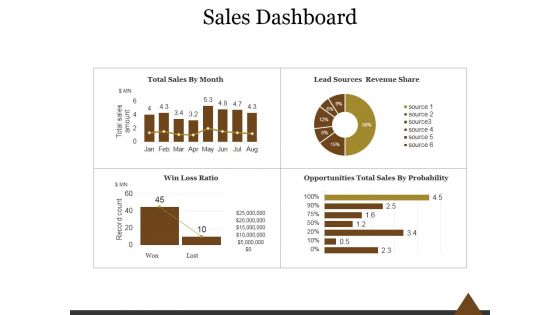
Sales Dashboard Template 2 Ppt PowerPoint Presentation Introduction
This is a sales dashboard template 2 ppt powerpoint presentation introduction. This is a four stage process. The stages in this process are total sales by month, lead sources revenue share, win loss ratio, opportunities total sales by probability.
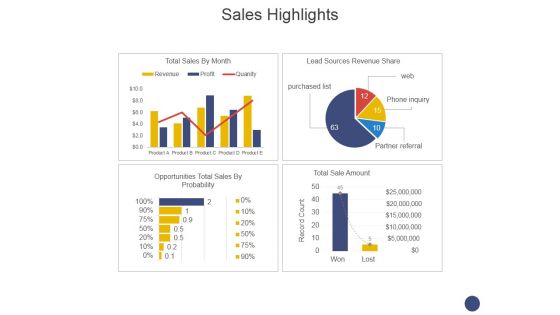
Sales Highlights Ppt PowerPoint Presentation Gallery Tips
This is a sales highlights ppt powerpoint presentation gallery tips. This is a four stage process. The stages in this process are opportunities total sales by probability, lead sources revenue share, total sales by month, total sale amount.
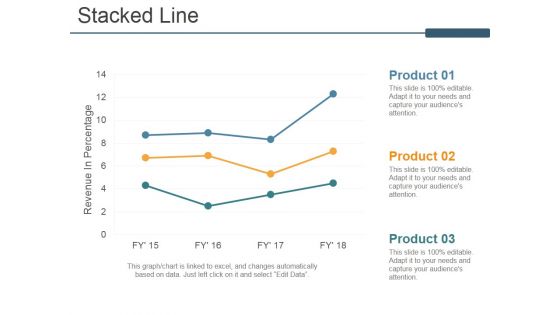
Stacked Line Ppt PowerPoint Presentation Ideas Model
This is a stacked line ppt powerpoint presentation ideas model. This is a three stage process. The stages in this process are revenue in percentage, stacked line, product, business, marketing.

Sales Highlight Ppt PowerPoint Presentation Ideas Design Templates
This is a sales highlight ppt powerpoint presentation ideas design templates. This is a five stage process. The stages in this process are total sales by month, lead sources revenue share, opportunities total sales by probability, total sale amount.
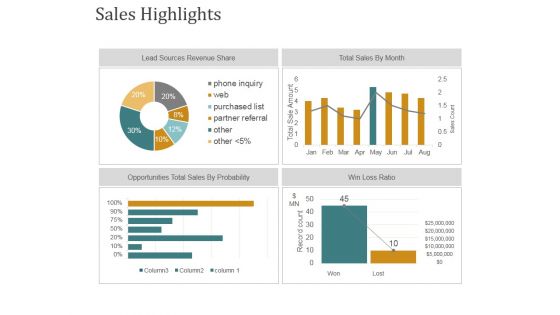
Sales Highlights Ppt PowerPoint Presentation Infographic Template Show
This is a sales highlights ppt powerpoint presentation infographic template show. This is a four stage process. The stages in this process are lead sources revenue share, total sales by month, opportunities total sales by probability, win loss ratio.
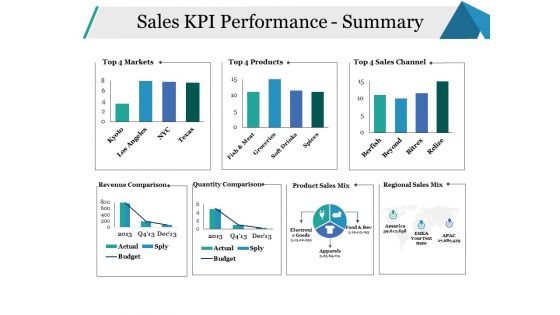
Sales KPI Performance Summary Ppt PowerPoint Presentation Infographics Model
This is a sales kpi performance summary ppt powerpoint presentation infographics model. This is a seven stage process. The stages in this process are sales channel, revenue comparison, quantity comparison, business, marketing.
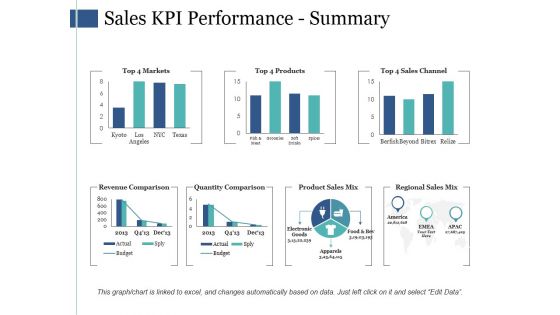
Sales Kpi Performance Summary Ppt PowerPoint Presentation Infographic Template Infographics
This is a sales kpi performance summary ppt powerpoint presentation infographic template infographics. This is a seven stage process. The stages in this process are revenue comparison, quantity comparison, product sales mix, regional sales mix.
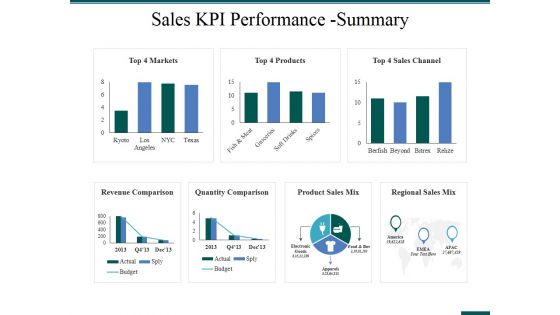
Sales Kpi Performance Summary Ppt PowerPoint Presentation Ideas Graphics Template
This is a sales kpi performance summary ppt powerpoint presentation ideas graphics template. This is a seven stage process. The stages in this process are revenue comparison, quantity comparison, product sales mix, regional sales mix.
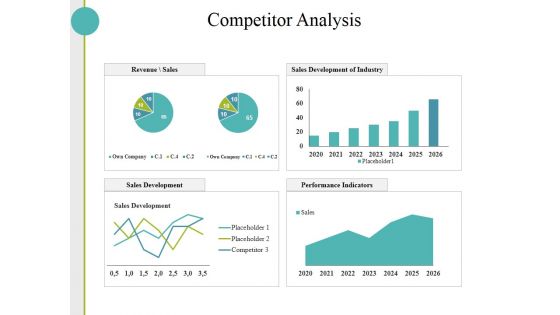
Competitor Analysis Ppt PowerPoint Presentation Layouts Slides
This is a competitor analysis ppt powerpoint presentation layouts slides. This is a four stage process. The stages in this process are sales development, performance indicators, sales development of industry, revenue sales.
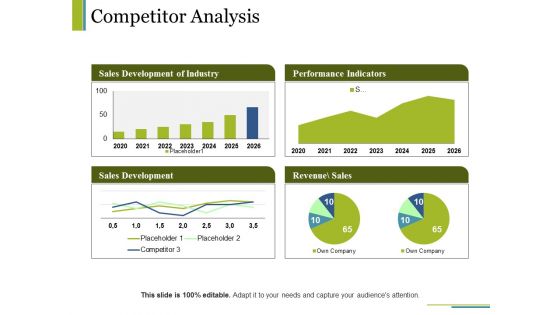
Competitor Analysis Ppt PowerPoint Presentation Visual Aids Model
This is a competitor analysis ppt powerpoint presentation visual aids model. This is a four stage process. The stages in this process are sales development of industry, performance indicators, sales development, revenue sales, business.

Stacked Line Ppt PowerPoint Presentation Professional Graphics Pictures
This is a stacked line ppt powerpoint presentation professional graphics pictures. This is a two stage process. The stages in this process are revenue in percentage, business, marketing, graph, finance.
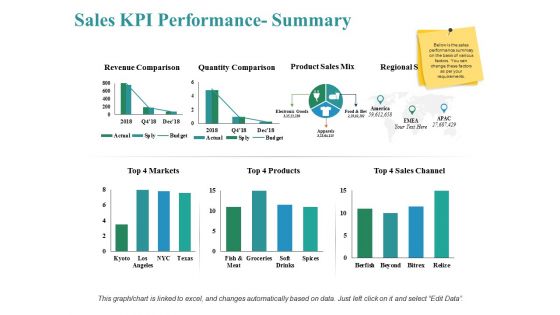
Sales Kpi Performance Summary Ppt PowerPoint Presentation Show Themes
This is a sales kpi performance summary ppt powerpoint presentation show themes. This is a three stage process. The stages in this process are revenue comparison, quantity comparison, product sales mix, markets, sales channel.
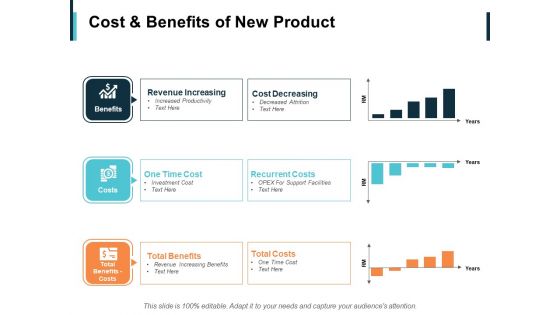
Cost And Benefits Of New Product Ppt PowerPoint Presentation Inspiration Diagrams
This is a cost and benefits of new product ppt powerpoint presentation inspiration diagrams. This is a three stage process. The stages in this process are recurrent costs, cost decreasing, revenue increasing, benefits, costs.
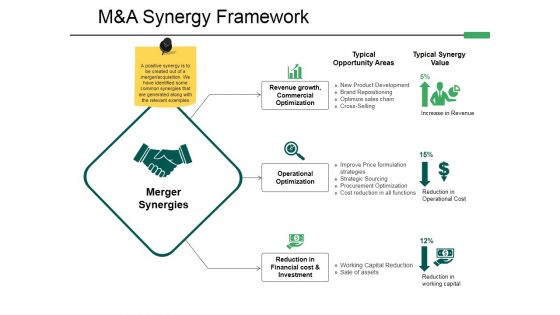
M And A Synergy Framework Ppt PowerPoint Presentation Professional Graphics
This is a m and a synergy framework ppt powerpoint presentation professional graphics. This is a three stage process. The stages in this process are revenue growth, commercial optimization, operational optimization, reduction in financial cost investment.

Sales Performance Dashboard Ppt PowerPoint Presentation Good
This is a sales performance dashboard ppt powerpoint presentation good. This is a four stage process. The stages in this process are lead sources revenue share, total sales by month, opportunities total sales by probability, win loss ratio.

Example Of Price And Profitability Optimization Diagram Powerpoint Slides
This is a example of price and profitability optimization diagram powerpoint slides. This is a three stage process. The stages in this process are price and revenue optimization, sales and operations planning, performance management.

Strategy Managing Ppt Layout Powerpoint Slides Design
This is a strategy managing ppt layout powerpoint slides design. This is a eight stage process. The stages in this process are customer perspective, financial perspective, cost efficiency, innovation processes, revenue growth, strategy map, market share, organization capital.

Market Size Template 2 Ppt PowerPoint Presentation Example File
This is a market size template 2 ppt powerpoint presentation example file. This is a two stage process. The stages in this process are in team of users, in team of revenue from customers.

Table Of Contents Template 2 Ppt PowerPoint Presentation Slide
This is a table of contents template 2 ppt powerpoint presentation slide. This is a two stage process. The stages in this process are business model, revenue model, growth strategy, marketing strategy, market size, financial summary, financial projection, shareholding pattern.

 Home
Home