Revenue
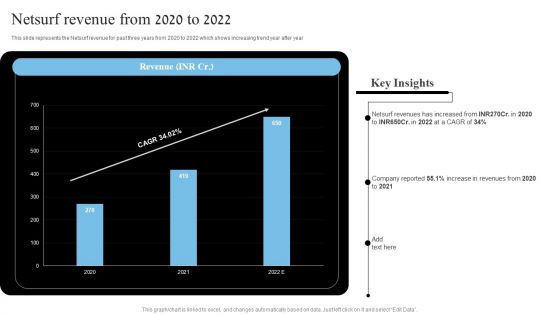
Network Marketing Company Profile Netsurf Revenue From 2020 To 2022 Elements PDF
This slide represents the Netsurf revenue for past three years from 2020 to 2022 which shows increasing trend year after year Get a simple yet stunning designed Network Marketing Company Profile Netsurf Revenue From 2020 To 2022 Elements PDF. It is the best one to establish the tone in your meetings. It is an excellent way to make your presentations highly effective. So, download this PPT today from Slidegeeks and see the positive impacts. Our easy to edit Network Marketing Company Profile Netsurf Revenue From 2020 To 2022 Elements PDF can be your go to option for all upcoming conferences and meetings. So, what are you waiting for Grab this template today.

Over The Top Platform Company Profile Average Revenue Per Customer Infographics PDF
The following slide highlights the quarterly revenue generated from each customer. The average revenue depicted is from domestic customers, international customers and Disney plus Hotstar customers. Boost your pitch with our creative Over The Top Platform Company Profile Average Revenue Per Customer Infographics PDF. Deliver an awe-inspiring pitch that will mesmerize everyone. Using these presentation templates you will surely catch everyones attention. You can browse the ppts collection on our website. We have researchers who are experts at creating the right content for the templates. So you do not have to invest time in any additional work. Just grab the template now and use them.
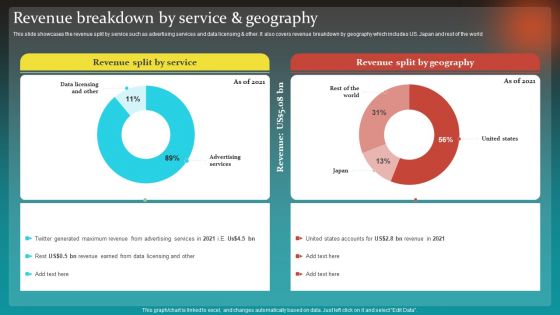
Social Network Business Summary Revenue Breakdown By Service And Geography Summary PDF
This slide showcases the revenue split by service such as advertising services and data licensing and other. It also covers revenue breakdown by geography which includes US. Japan and rest of the world Want to ace your presentation in front of a live audience Our Social Network Business Summary Revenue Breakdown By Service And Geography Summary PDF can help you do that by engaging all the users towards you. Slidegeeks experts have put their efforts and expertise into creating these impeccable powerpoint presentations so that you can communicate your ideas clearly. Moreover, all the templates are customizable, and easy to edit and downloadable. Use these for both personal and commercial use.
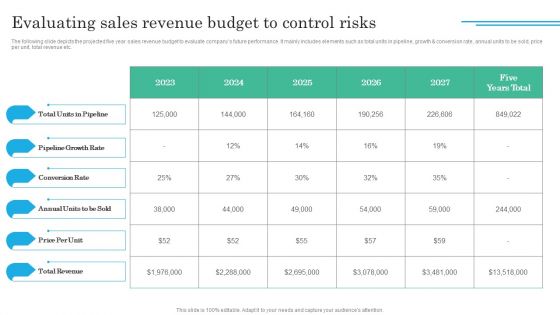
Implementing Sales Volatility Management Techniques Evaluating Sales Revenue Budget To Control Summary PDF
The following slide depicts the projected five year sales revenue budget to evaluate companys future performance. It mainly includes elements such as total units in pipeline, growth and conversion rate, annual units to be sold, price per unit, total revenue etc. From laying roadmaps to briefing everything in detail, our templates are perfect for you. You can set the stage with your presentation slides. All you have to do is download these easy to edit and customizable templates. Implementing Sales Volatility Management Techniques Evaluating Sales Revenue Budget To Control Summary PDF will help you deliver an outstanding performance that everyone would remember and praise you for. Do download this presentation today.

Determining Risks In Sales Administration Procedure Evaluating Sales Revenue Budget To Control Risks Portrait PDF
The following slide depicts the projected five year sales revenue budget to evaluate companys future performance. It mainly includes elements such as total units in pipeline, growth and conversion rate, annual units to be sold, price per unit, total revenue etc. The best PPT templates are a great way to save time, energy, and resources. Slidegeeks have 100 percent editable powerpoint slides making them incredibly versatile. With these quality presentation templates, you can create a captivating and memorable presentation by combining visually appealing slides and effectively communicating your message. Download Determining Risks In Sales Administration Procedure Evaluating Sales Revenue Budget To Control Risks Portrait PDF from Slidegeeks and deliver a wonderful presentation.
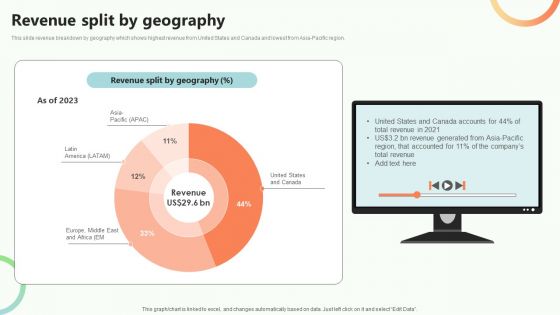
Online Video Content Provider Business Profile Revenue Split By Geography Sample PDF
This slide revenue breakdown by geography which shows highest revenue from United States and Canada and lowest from Asia-Pacific region. The Online Video Content Provider Business Profile Revenue Split By Geography Sample PDF is a compilation of the most recent design trends as a series of slides. It is suitable for any subject or industry presentation, containing attractive visuals and photo spots for businesses to clearly express their messages. This template contains a variety of slides for the user to input data, such as structures to contrast two elements, bullet points, and slides for written information. Slidegeeks is prepared to create an impression.

Online Advertising Firm Business Profile Revenue From Operations From 2018 To 2022 Ideas PDF
This slide showcases the revenue generated from operations for last five years from 2018 to 2022 such as consumer and enterprise platforms which shows increasing revenue year after year The best PPT templates are a great way to save time, energy, and resources. Slidegeeks have 100 percent editable powerpoint slides making them incredibly versatile. With these quality presentation templates, you can create a captivating and memorable presentation by combining visually appealing slides and effectively communicating your message. Download Online Advertising Firm Business Profile Revenue From Operations From 2018 To 2022 Ideas PDF from Slidegeeks and deliver a wonderful presentation.

Implementing Strategies To Enhance Promotion Campaign Plan To Enhance Sales Revenue
This slide represents marketing campaign plan for ecommerce website with aim to increase sales revenue and brand search. It includes flash sales, SEO, lower cart abandonment rate etc. Create an editable Implementing Strategies To Enhance Promotion Campaign Plan To Enhance Sales Revenue that communicates your idea and engages your audience. Whether you are presenting a business or an educational presentation, pre-designed presentation templates help save time. Implementing Strategies To Enhance Promotion Campaign Plan To Enhance Sales Revenue is highly customizable and very easy to edit, covering many different styles from creative to business presentations. Slidegeeks has creative team members who have crafted amazing templates. So, go and get them without any delay.

Waterfall Graph Showing Sales Expenses Revenue And Taxes Ppt PowerPoint Presentation Pictures Summary
This is a waterfall graph showing sales expenses revenue and taxes ppt powerpoint presentation pictures summary. This is a three stage process. The stages in this process are profit and loss, balance sheet, income statement, benefit and loss.

Financial Report With Sales Revenue And Income Ppt PowerPoint Presentation Gallery Brochure
This is a financial report with sales revenue and income ppt powerpoint presentation gallery brochure. This is a four stage process. The stages in this process are accounting review, accounting report, accounting statement.
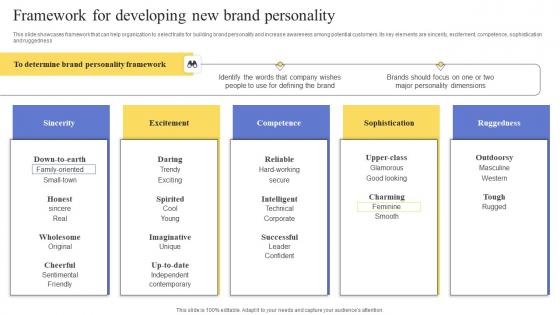
Framework For Developing New Brand Personality Maximizing Revenue Using Pictures Pdf
This slide showcases framework that can help organization to select traits for building brand personality and increase awareness among potential customers. Its key elements are sincerity, excitement, competence, sophistication and ruggedness. This modern and well-arranged Framework For Developing New Brand Personality Maximizing Revenue Using Pictures Pdf provides lots of creative possibilities. It is very simple to customize and edit with the Powerpoint Software. Just drag and drop your pictures into the shapes. All facets of this template can be edited with Powerpoint no extra software is necessary. Add your own material, put your images in the places assigned for them, adjust the colors, and then you can show your slides to the world, with an animated slide included.

Competitor Revenue And Profit Option 1 Of 2 Ppt PowerPoint Presentation Ideas Gallery
This is a competitor revenue and profit option 1 of 2 ppt powerpoint presentation ideas gallery. This is a two stage process. The stages in this process are finance, business, management, strategy, analysis.
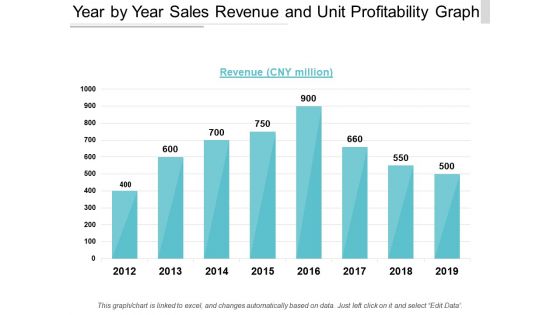
Year By Year Sales Revenue And Unit Profitability Graph Ppt PowerPoint Presentation Show Professional
This is a year by year sales revenue and unit profitability graph ppt powerpoint presentation show professional. This is a eight stage process. The stages in this process are business unit profitability, profitable organization, corporate unit profitability.
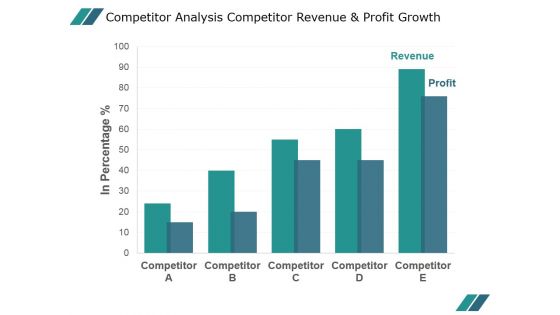
Competitor Analysis Competitor Revenue And Profit Growth Ppt PowerPoint Presentation Slide Download
This is a competitor analysis competitor revenue and profit growth ppt powerpoint presentation slide download. This is a five stage process. The stages in this process are business, marketing, management, finance, growth.

Competitor Revenue And Profit Template Ppt PowerPoint Presentation Model Design Inspiration
This is a competitor revenue and profit template ppt powerpoint presentation model design inspiration. This is a five stage process. The stages in this process are business, marketing, graph, success, growth.
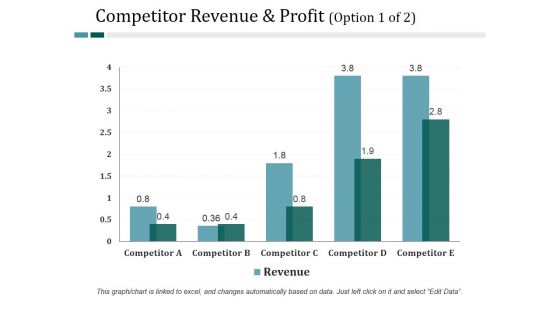
Competitor Revenue And Profit Template 1 Ppt PowerPoint Presentation Professional Example File
This is a competitor revenue and profit template 1 ppt powerpoint presentation professional example file. This is a five stage process. The stages in this process are business, finance, marketing, strategy, analysis, growth.
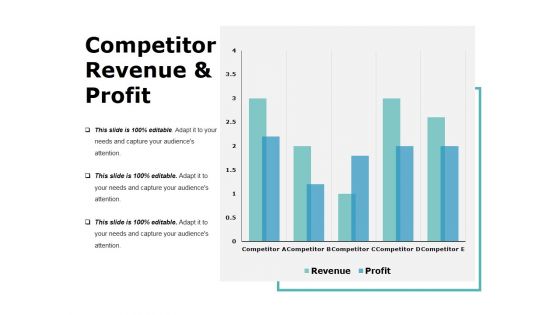
Competitor Revenue And Profit Template 1 Ppt PowerPoint Presentation Layouts Display
This is a competitor revenue and profit template 1 ppt powerpoint presentation layouts display. This is a five stage process. The stages in this process are business, bar graph, finance, marketing, analysis.
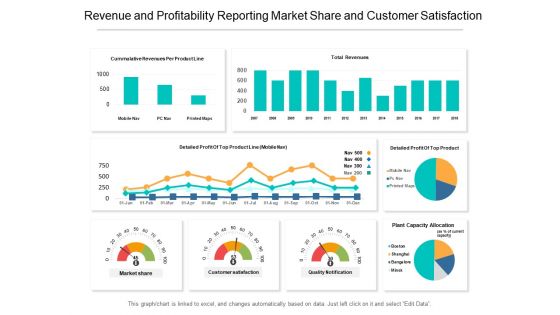
Revenue And Profitability Reporting Market Share And Customer Satisfaction Ppt PowerPoint Presentation Styles Format Ideas
This is a revenue and profitability reporting market share and customer satisfaction ppt powerpoint presentation styles format ideas. This is a four stage process. The stages in this process are business analytics, ba, organizations data.

Recurring Income Generation Model Annual Recurring Revenue For The Future Infographics PDF
The purpose of the following slide is to display the annual recurring revenue for the financial year of 2020, the provided table calculates the actual revenue earned in comparison to forecasted revenue. Are you in need of a template that can accommodate all of your creative concepts This one is crafted professionally and can be altered to fit any style. Use it with Google Slides or PowerPoint. Include striking photographs, symbols, depictions, and other visuals. Fill, move around, or remove text boxes as desired. Test out color palettes and font mixtures. Edit and save your work, or work with colleagues. Download Recurring Income Generation Model Annual Recurring Revenue For The Future Infographics PDF and observe how to make your presentation outstanding. Give an impeccable presentation to your group and make your presentation unforgettable.

Property Investment Strategies Budget Variance Analysis Revenue Ppt PowerPoint Presentation Model Demonstration PDF
This is a property investment strategies budget variance analysis revenue ppt powerpoint presentation model demonstration pdf. template with various stages. Focus and dispense information on one stages using this creative set, that comes with editable features. It contains large content boxes to add your information on topics like projected, budget, total revenue, total operating expenses, real estate taxes. You can also showcase facts, figures, and other relevant content using this PPT layout. Grab it now.
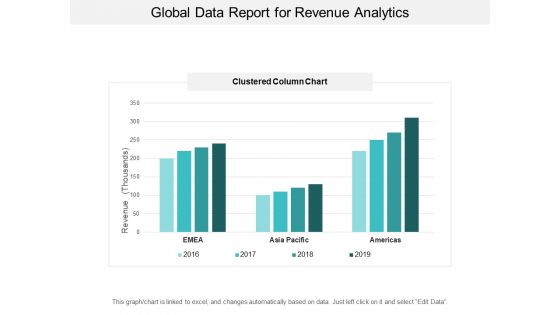
Global Data Report For Revenue Analytics Ppt PowerPoint Presentation Inspiration Visuals
This is a global data report for revenue analytics ppt powerpoint presentation inspiration visuals. This is a four stage process. The stages in this process are financial analysis, quantitative, statistical modelling.
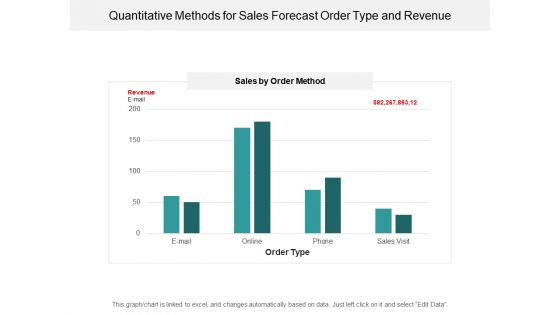
Quantitative Methods For Sales Forecast Order Type And Revenue Ppt PowerPoint Presentation Styles Show
This is a quantitative methods for sales forecast order type and revenue ppt powerpoint presentation styles show. This is a four stage process. The stages in this process are financial analysis, quantitative, statistical modelling.

Current State Analysis Revenue Versus Target Ppt PowerPoint Presentation Model Smartart
This is a current state analysis revenue versus target ppt powerpoint presentation model smartart. This is a two stage process. The stages in this process are actual, target, actual vs target value.

Revenue Split By Product Segment Template 1 Ppt PowerPoint Presentation Summary Example
This is a revenue split by product segment template 1 ppt powerpoint presentation summary example. This is a four stage process. The stages in this process are bar, business, marketing, finance, analysis.

Revenue Split By Product Segment Template 1 Ppt PowerPoint Presentation Infographics Smartart
This is a revenue split by product segment template 1 ppt powerpoint presentation infographics smartart. This is a four stage process. The stages in this process are business, finance, marketing, bar graph, product.

Aims And Results Increase Revenue And Improve Service Quality Ppt PowerPoint Presentation Gallery Design Inspiration
This is a aims and results increase revenue and improve service quality ppt powerpoint presentation gallery design inspiration. This is a two stage process. The stages in this process are objective and benefit, goal and benefit, plan and benefit.

Sales Learning Curve Showing Revenue Gaps Ppt PowerPoint Presentation Infographic Template Master Slide
This is a sales learning curve showing revenue gaps ppt powerpoint presentation infographic template master slide. This is a two stage process. The stages in this process are experience curve, learning curve.

Retail Kpi Dashboard Showing Revenue Vs Units Sold Ppt PowerPoint Presentation File Formats
This is a retail kpi dashboard showing revenue vs units sold ppt powerpoint presentation file formats. This is a three stage process. The stages in this process are finance, marketing, management, investment, analysis.
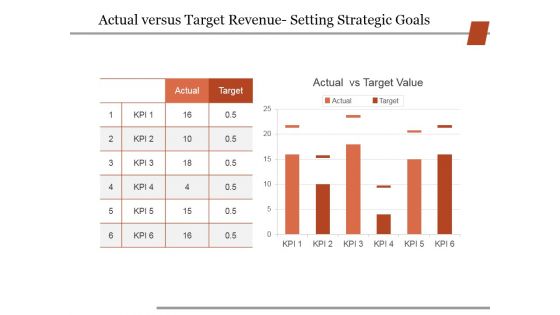
Actual Versus Target Revenue Setting Strategic Goals Ppt PowerPoint Presentation Outline Show
This is a actual versus target revenue setting strategic goals ppt powerpoint presentation outline show. This is a two stage process. The stages in this process are business, strategy, marketing, finance, analysis.

Investor Pitch Deck Collect Capital Financial Market Major Sources Of Revenue Template PDF
The slide provides the details about major sources of revenue i.e. interest on loan, investment income, fee income etc. Deliver an awe-inspiring pitch with this creative investor pitch deck collect capital financial market major sources of revenue template pdf bundle. Topics like other sources, investment income, interest on loans can be discussed with this completely editable template. It is available for immediate download depending on the needs and requirements of the user.

Event Management Firm Overview Financial Highlights Revenue Gross Profit And Net Profit Information PDF
This slide focuses on financial highlights of event management company which represents revenue, gross profit and net profit for last five years from 2018 to 2022.Deliver and pitch your topic in the best possible manner with this Event Management Firm Overview Financial Highlights Revenue Gross Profit And Net Profit Information PDF Use them to share invaluable insights on Value, Gross Profit, Net Profit and impress your audience. This template can be altered and modified as per your expectations. So, grab it now.
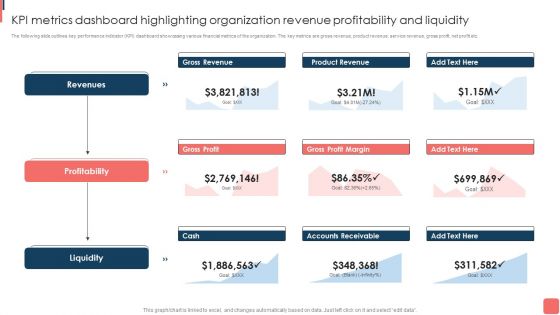
KPI Metrics Dashboard Highlighting Organization Revenue Profitability And Liquidity Template PDF
The following slide outlines key performance indicator KPI dashboard showcasing various financial metrics of the organization. The key metrics are gross revenue, product revenue, service revenue, gross profit, net profit etc. This KPI Metrics Dashboard Highlighting Organization Revenue Profitability And Liquidity Template PDF from Slidegeeks makes it easy to present information on your topic with precision. It provides customization options, so you can make changes to the colors, design, graphics, or any other component to create a unique layout. It is also available for immediate download, so you can begin using it right away. Slidegeeks has done good research to ensure that you have everything you need to make your presentation stand out. Make a name out there for a brilliant performance.

Financial Report To Analyse Sales And Revenue Ppt PowerPoint Presentation Infographics Samples
This is a financial report to analyse sales and revenue ppt powerpoint presentation infographics samples. This is a four stage process. The stages in this process are accounting review, accounting report, accounting statement.

Company Revenue 2019 To 2023 Engineering Company Financial Analysis Report Structure PDF
The slide shows annual revenue growth of the company with the CAGR for last five financial years from 2019 to 2023 along with key insights.Presenting this PowerPoint presentation, titled Company Revenue 2019 To 2023 Engineering Company Financial Analysis Report Structure PDF, with topics curated by our researchers after extensive research. This editable presentation is available for immediate download and provides attractive features when used. Download now and captivate your audience. Presenting this Company Revenue 2019 To 2023 Engineering Company Financial Analysis Report Structure PDF. Our researchers have carefully researched and created these slides with all aspects taken into consideration. This is a completely customizable Company Revenue 2019 To 2023 Engineering Company Financial Analysis Report Structure PDF that is available for immediate downloading. Download now and make an impact on your audience. Highlight the attractive features available with our PPTs.
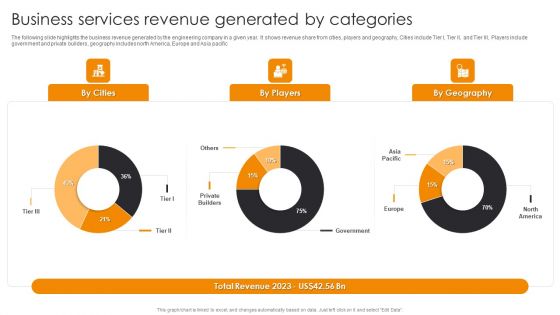
Business Services Revenue Generated By Categories Engineering Company Financial Analysis Report Graphics PDF
The following slide highlights the business revenue generated by the engineering company in a given year. It shows revenue share from cities, players and geography, Cities include Tier I, Tier II, and Tier III, Players include government and private builders, geography includes north America, Europe and Asia pacific.If you are looking for a format to display your unique thoughts, then the professionally designed Business Services Revenue Generated By Categories Engineering Company Financial Analysis Report Graphics PDF is the one for you. You can use it as a Google Slides template or a PowerPoint template. Incorporate impressive visuals, symbols, images, and other charts. Modify or reorganize the text boxes as you desire. Experiment with shade schemes and font pairings. Alter, share or cooperate with other people on your work. Download Business Services Revenue Generated By Categories Engineering Company Financial Analysis Report Graphics PDF and find out how to give a successful presentation. Present a perfect display to your team and make your presentation unforgettable.
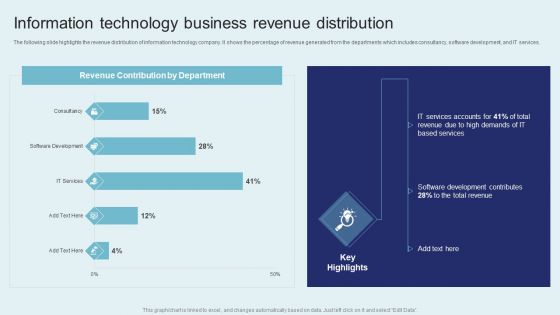
IT Firm Financial Statement Information Technology Business Revenue Distribution Portrait PDF
The following slide highlights the revenue distribution of information technology company. It shows the percentage of revenue generated from the departments which includes consultancy, software development, and IT services. Create an editable IT Firm Financial Statement Information Technology Business Revenue Distribution Portrait PDF that communicates your idea and engages your audience. Whether you are presenting a business or an educational presentation, pre designed presentation templates help save time. IT Firm Financial Statement Information Technology Business Revenue Distribution Portrait PDF is highly customizable and very easy to edit, covering many different styles from creative to business presentations. Slidegeeks has creative team members who have crafted amazing templates. So, go and get them without any delay.
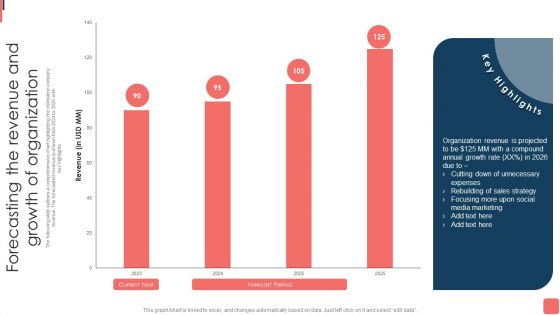
Effective Financial Planning Assessment Techniques Forecasting The Revenue And Growth Of Organization Sample PDF
The following slide outlines a comprehensive chart highlighting the estimated company revenue. The forecasted revenue is shown from 2024 to 2026 with key highlights.Formulating a presentation can take up a lot of effort and time, so the content and message should always be the primary focus. The visuals of the PowerPoint can enhance the presenters message, so our Effective Financial Planning Assessment Techniques Forecasting The Revenue And Growth Of Organization Sample PDF was created to help save time. Instead of worrying about the design, the presenter can concentrate on the message while our designers work on creating the ideal templates for whatever situation is needed. Slidegeeks has experts for everything from amazing designs to valuable content, we have put everything into Effective Financial Planning Assessment Techniques Forecasting The Revenue And Growth Of Organization Sample PDF.

Revenue Split By Geography Financial Performance Report Of Software Firm Background PDF
The slide highlights the historical revenue split for software company since its inception and revenue share for current year based on geography. Do you have an important presentation coming up Are you looking for something that will make your presentation stand out from the rest Look no further than Revenue Split By Geography Financial Performance Report Of Software Firm Background PDF. With our professional designs, you can trust that your presentation will pop and make delivering it a smooth process. And with Slidegeeks, you can trust that your presentation will be unique and memorable. So why wait Grab Revenue Split By Geography Financial Performance Report Of Software Firm Background PDF today and make your presentation stand out from the rest.
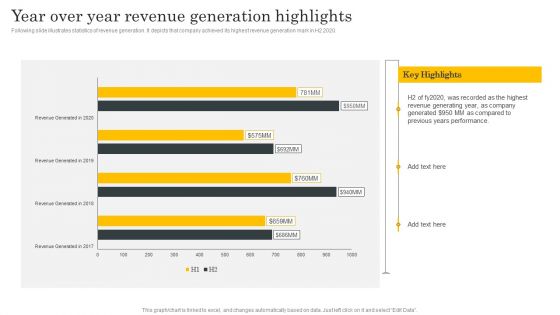
Financial Evaluation Report Year Over Year Revenue Generation Highlights Designs PDF
Following slide illustrates statistics of revenue generation. It depicts that company achieved its highest revenue generation mark in H2 2020. Are you searching for a Financial Evaluation Report Year Over Year Revenue Generation Highlights Designs PDF that is uncluttered, straightforward, and original Its easy to edit, and you can change the colors to suit your personal or business branding. For a presentation that expresses how much effort youve put in, this template is ideal With all of its features, including tables, diagrams, statistics, and lists, its perfect for a business plan presentation. Make your ideas more appealing with these professional slides. Download Financial Evaluation Report Year Over Year Revenue Generation Highlights Designs PDF from Slidegeeks today.
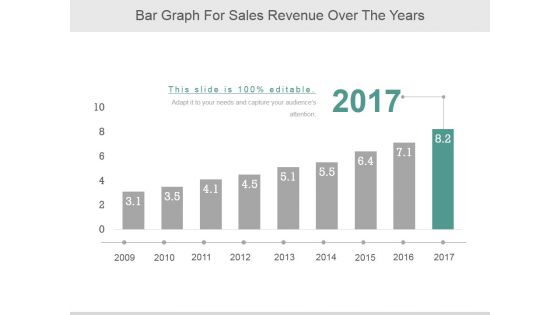
Bar Graph For Sales Revenue Over The Years Ppt PowerPoint Presentation Professional
This is a bar graph for sales revenue over the years ppt powerpoint presentation professional. This is a nine stage process. The stages in this process are business, marketing, growth, bar, years.
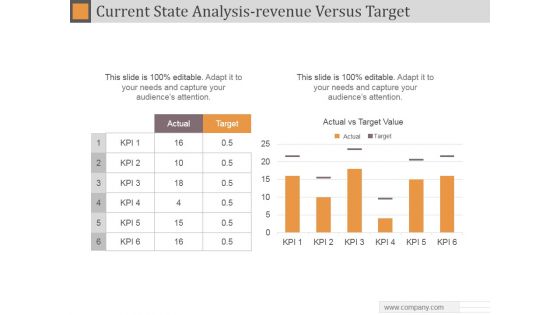
Current State Analysis Revenue Versus Target Ppt PowerPoint Presentation Background Designs
This is a current state analysis revenue versus target ppt powerpoint presentation background designs. This is a six stage process. The stages in this process are actual, target, actual vs target value.
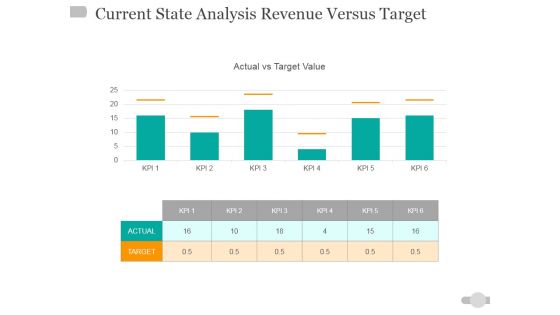
Current State Analysis Revenue Versus Target Ppt PowerPoint Presentation Ideas Master Slide
This is a current state analysis revenue versus target ppt powerpoint presentation ideas master slide. This is a two stage process. The stages in this process are actual, target, actual vs target value.
Revenue Split By Product Segment Template 1 Ppt PowerPoint Presentation Ideas Icons
This is a revenue split by product segment template 1 ppt powerpoint presentation ideas icons. This is a four stage process. The stages in this process are business, marketing, success, bar graph, product.
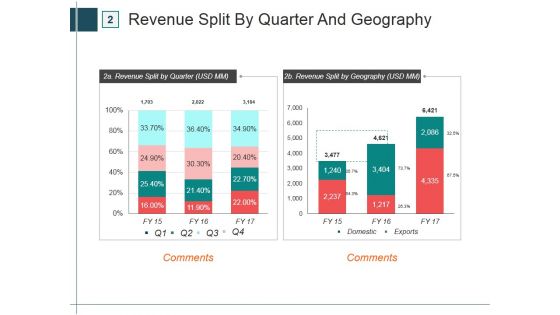
Revenue Split By Quarter And Geography Template 1 Ppt PowerPoint Presentation Infographics Graphics Template
This is a revenue split by quarter and geography template 1 ppt powerpoint presentation infographics graphics template. This is a two stage process. The stages in this process are domestic, exports, comments.
Revenue Split By Product And Segment Ppt PowerPoint Presentation Icon Design Inspiration
This is a revenue split by product and segment ppt powerpoint presentation icon design inspiration. This is a two stage process. The stages in this process are carbon steel, alloy steel, stainless steel, fitting.

Current State Analysis Revenue Versus Target Ppt Powerpoint Presentation Styles Influencers
This is a current state analysis revenue versus target ppt powerpoint presentation styles influencers. This is a six stage process. The stages in this process are actual vs target value, actual, target, finance.
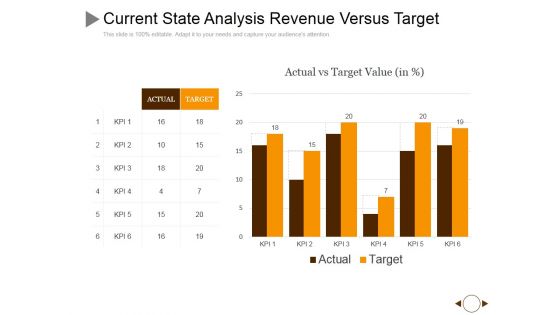
Current State Analysis Revenue Versus Target Ppt PowerPoint Presentation Summary Slides
This is a current state analysis revenue versus target ppt powerpoint presentation summary slides. This is a six stage process. The stages in this process are actual, target, kpi, finance, business.
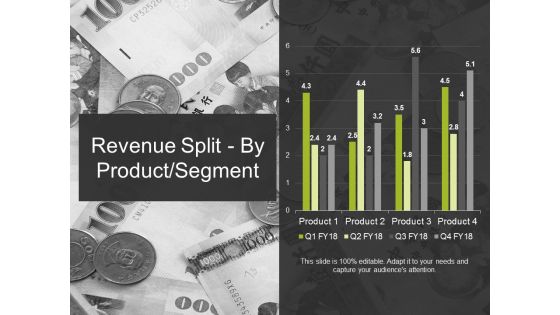
Revenue Split By Product Segment Template 2 Ppt PowerPoint Presentation Ideas Graphic Images
This is a revenue split by product segment template 2 ppt powerpoint presentation ideas graphic images. This is a four stage process. The stages in this process are business, marketing, finance, graph, strategy.

Revenue Split By Product Segment Template 2 Ppt PowerPoint Presentation Styles Guidelines
This is a revenue split by product segment template 2 ppt powerpoint presentation styles guidelines. This is a four stage process. The stages in this process are business, finance, analysis, marketing, strategy.

Revenue Split By Product And Segment Ppt PowerPoint Presentation Summary Portfolio
This is a revenue split by product and segment ppt powerpoint presentation summary portfolio. This is a two stage process. The stages in this process are business, marketing, strategy, planning, finance.
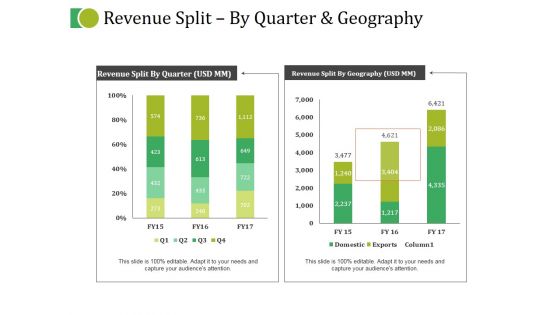
Revenue Split By Quarter And Geography Ppt PowerPoint Presentation Layouts Templates
This is a revenue split by quarter and geography ppt powerpoint presentation layouts templates. This is a two stage process. The stages in this process are business, marketing, strategy, planning, finance.

Revenue Split By Product Segment Template 2 Ppt PowerPoint Presentation Summary Good
This is a revenue split by product segment template 2 ppt powerpoint presentation summary good. This is a four stage process. The stages in this process are business, marketing, finance, strategy, graph.
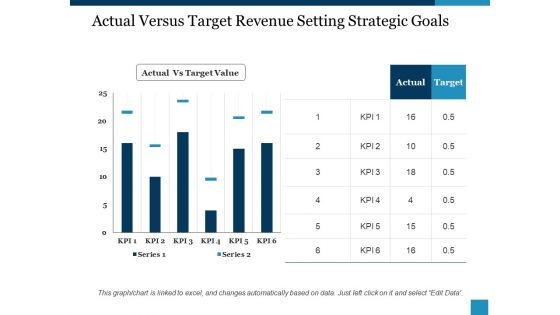
Actual Versus Target Revenue Setting Strategic Goals Ppt PowerPoint Presentation Visual Aids Diagrams
This is a actual versus target revenue setting strategic goals ppt powerpoint presentation visual aids diagrams. This is a six stage process. The stages in this process are actual vs target value, actual, target, kpi, series.
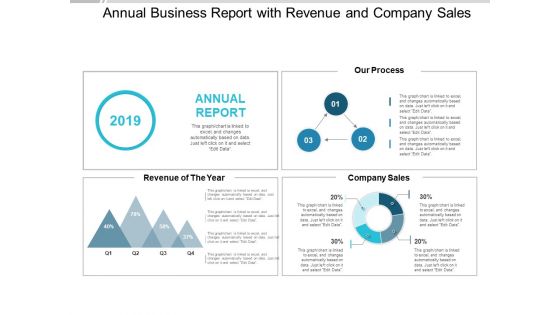
Annual Business Report With Revenue And Company Sales Ppt PowerPoint Presentation Model Template
This is a annual business report with revenue and company sales ppt powerpoint presentation model template. This is a four stage process. The stages in this process are progress report, growth report, improvement report.

Marketing Performance Statistical Analysis Customers And Revenue Report Ppt PowerPoint Presentation Outline Shapes
This is a marketing performance statistical analysis customers and revenue report ppt powerpoint presentation outline shapes. This is a four stage process. The stages in this process are marketing analytics, marketing performance, marketing discovery.
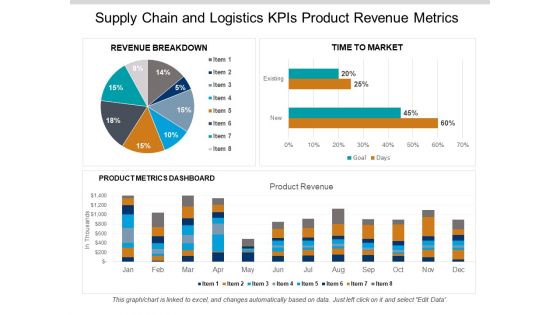
Supply Chain And Logistics Kpis Product Revenue Metrics Ppt PowerPoint Presentation Gallery Aids
This is a supply chain and logistics kpis product revenue metrics ppt powerpoint presentation gallery aids. This is a three stage process. The stages in this process are logistics performance, logistics dashboard, logistics kpis.
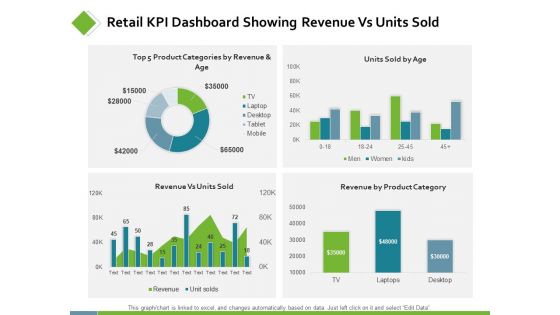
Retail KPI Dashboard Showing Revenue Vs Units Sold Ppt PowerPoint Presentation Professional Smartart
This is a retail kpi dashboard showing revenue vs units sold ppt powerpoint presentation professional smartart. This is a four stage process. The stages in this process are finance, analysis, business, investment, marketing.

Retail KPI Dashboard Showing Sales Revenue Customers Ppt PowerPoint Presentation Show Background Designs
This is a retail kpi dashboard showing sales revenue customers ppt powerpoint presentation show background designs. This is a six stage process. The stages in this process are finance, analysis, business, investment, marketing.

Revenue Waterfall Chart Showing Fixed And Variable Cost Ppt PowerPoint Presentation Infographic Template Images
This is a revenue waterfall chart showing fixed and variable cost ppt powerpoint presentation infographic template images. This is a five stage process. The stages in this process are sales waterfall, waterfall chart, business.

Waterfall Chart With Merchandising Sales Cost And Net Revenue Ppt PowerPoint Presentation Summary Show
This is a waterfall chart with merchandising sales cost and net revenue ppt powerpoint presentation summary show. This is a three stage process. The stages in this process are sales waterfall, waterfall chart, business.

 Home
Home