Results
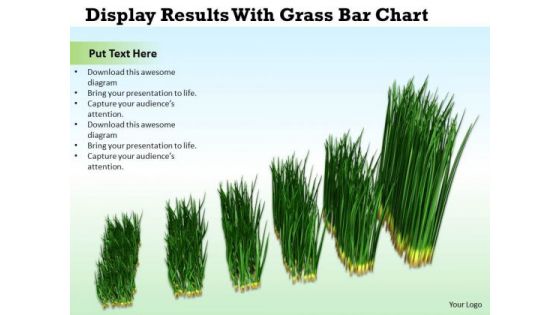
Business And Strategy Display Results With Grass Bar Chart Images
Analyze Ailments On Our business and strategy display results with grass bar chart images Powerpoint Templates. Bring Out The Thinking Doctor In You. Dock Your Thoughts With Our Agriculture Powerpoint Templates. They Will Launch Them Into Orbit.

Integrating Change Management And Project Results Ppt Design
This is a integrating change management and project results ppt design. This is a four stage process. The stages in this process are project name, purpose, particulars, people, what is the project, why we are changing, who will we changing.

Analysing Results Of Brainstorming With Affinity Diagrams Powerpoint Show
This is a analysing results of brainstorming with affinity diagrams powerpoint show. This is a three stage process. The stages in this process are theme, business, table, marketing, planning.
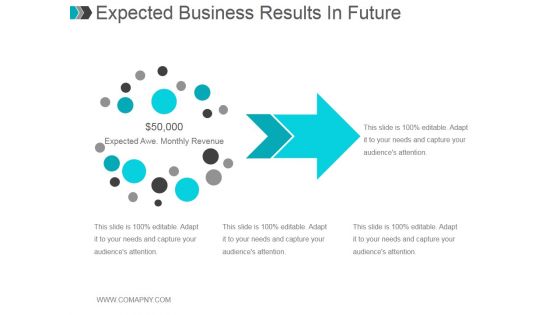
Expected Business Results In Future Ppt PowerPoint Presentation Visuals
This is a expected business results in future ppt powerpoint presentation visuals. This is a one stage process. The stages in this process are arrow, marketing, management, business, strategy.

Funnel For Media Segmentation Results Ppt PowerPoint Presentation Microsoft
This is a funnel for media segmentation results ppt powerpoint presentation microsoft. This is a five stage process. The stages in this process are funnel, process, business, marketing, sales.
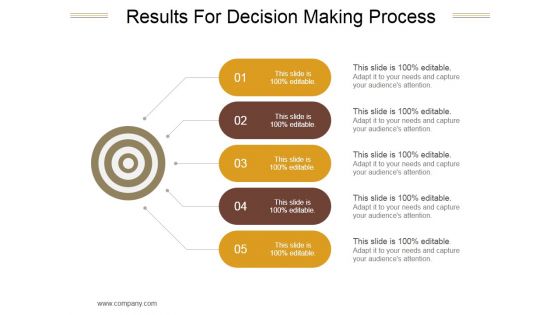
Results For Decision Making Process Ppt PowerPoint Presentation Outline
This is a results for decision making process ppt powerpoint presentation outline. This is a five stage process. The stages in this process are process, management, strategy, marketing, business.
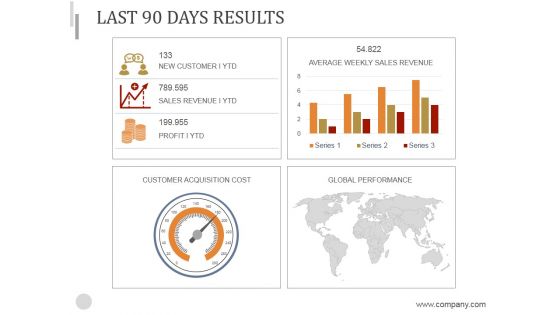
Last 90 Days Results Ppt PowerPoint Presentation Background Image
This is a last 90 days results ppt powerpoint presentation background image. This is a four stage process. The stages in this process are customer acquisition cost, global performance, average weekly sales revenue.
Last 90 Days Results Ppt PowerPoint Presentation Introduction
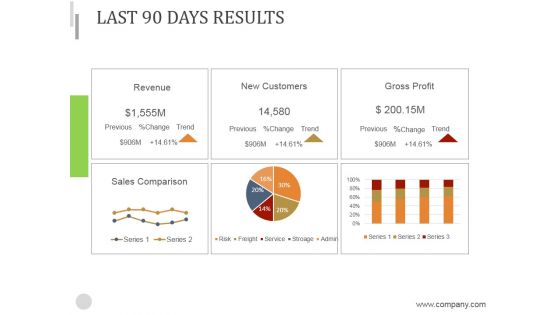
This is a last 90 days results ppt powerpoint presentation introduction. This is a six stage process. The stages in this process are revenue, new customers, gross profit, sales comparison.
Last 90 Days Results Ppt PowerPoint Presentation Design Templates
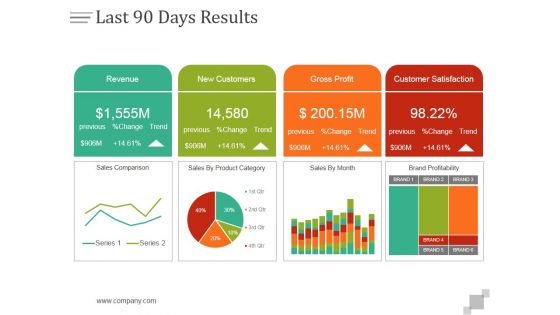
This is a last 90 days results ppt powerpoint presentation design templates. This is a four stage process. The stages in this process are revenue, new customers, gross profit, customer satisfaction.
Last 90 Days Results Ppt PowerPoint Presentation Layouts
This is a last 90 days results ppt powerpoint presentation layouts. This is a five stage process. The stages in this process are business, finance, marketing, strategy, analysis, success.

Last 90 Days Results Ppt PowerPoint Presentation Microsoft
This is a last 90 days results ppt powerpoint presentation microsoft. This is a four stage process. The stages in this process are revenue, new customers, gross profit, customer satisfaction.
Last 90 Days Results Ppt PowerPoint Presentation Graphics
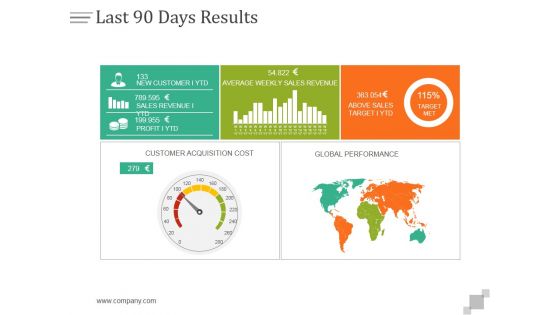
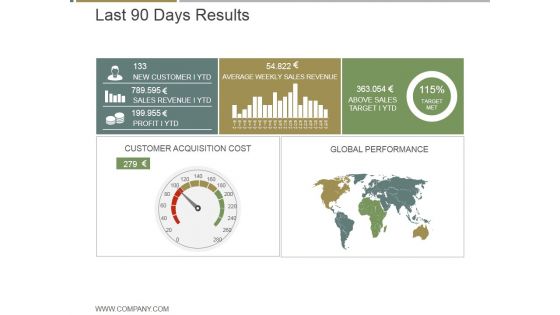
This is a last 90 days results ppt powerpoint presentation graphics. This is a five stage process. The stages in this process are new customer ytd, average weekly sales revenue, above sales target i ytd, customer acquisition cost, global performance.

Preliminary Discussion And Results Ppt PowerPoint Presentation Gallery Samples
This is a preliminary discussion and results ppt powerpoint presentation gallery samples. This is a four stage process. The stages in this process are business, marketing, strategy, growth, success.

Preliminary Discussion And Results Ppt PowerPoint Presentation Show Layout Ideas
This is a preliminary discussion and results ppt powerpoint presentation show layout ideas. This is a four stage process. The stages in this process are steps, business, marketing, success, management.
Preliminary Discussion And Results Ppt PowerPoint Presentation Icon Picture
This is a preliminary discussion and results ppt powerpoint presentation icon picture. This is a four stage process. The stages in this process are business, marketing, strategy, management, planning.
Preliminary Discussion And Results Ppt PowerPoint Presentation Portfolio Slides
This is a preliminary discussion and results ppt powerpoint presentation portfolio slides. This is a four stage process. The stages in this process are limitation, business, marketing, strategy, planning.

Last 30 Days Results Ppt PowerPoint Presentation Summary Brochure
This is a last 30 days results ppt powerpoint presentation summary brochure. This is a four stage process. The stages in this process are revenue, new customers, gross profit, customer satisfaction.
Last 30 Days Results Ppt PowerPoint Presentation Layouts Shapes
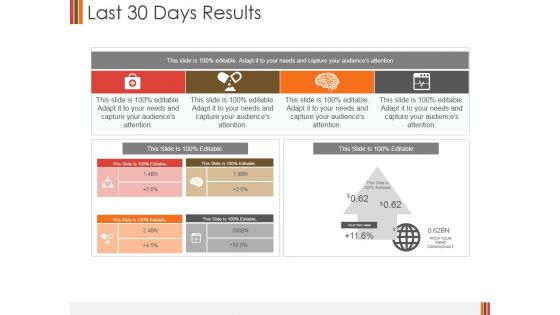
This is a last 30 days results ppt powerpoint presentation layouts shapes. This is a four stage process. The stages in this process are business, finance, management, analysis, strategy, success.

Workforce Gap Analysis Results Ppt PowerPoint Presentation Pictures Themes
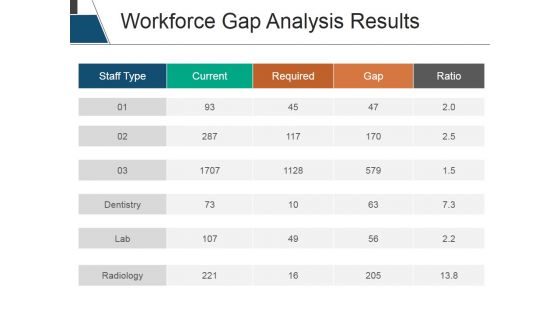
This is a workforce gap analysis results ppt powerpoint presentation pictures themes. This is a four stage process. The stages in this process are staff type, current, required, gap, ratio.
Workforce Gap Analysis Results Ppt PowerPoint Presentation Infographic Template Deck
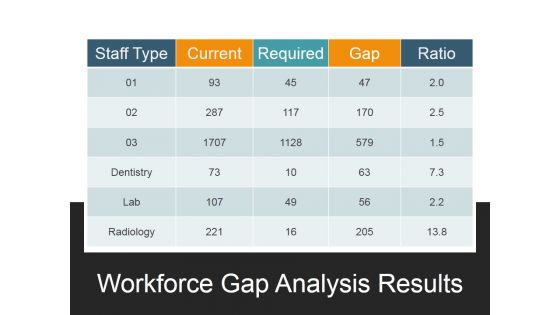
This is a workforce gap analysis results ppt powerpoint presentation infographic template deck. This is a four stage process. The stages in this process are staff type, current, required, gap, ratio.
Workforce Gap Analysis Results Ppt PowerPoint Presentation File Slides
This is a workforce gap analysis results ppt powerpoint presentation file slides. This is a five stage process. The stages in this process are staff type, current, required, gap, ratio.
Preliminary Discussion And Results Ppt PowerPoint Presentation Layouts Files
This is a preliminary discussion and results ppt powerpoint presentation layouts files. This is a four stage process. The stages in this process are business, marketing, management, success, presentation.

Workforce Gap Analysis Results Ppt PowerPoint Presentation Show Clipart
This is a workforce gap analysis results ppt powerpoint presentation show clipart. This is a five stage process. The stages in this process are staff type, current, required, gap, ratio.
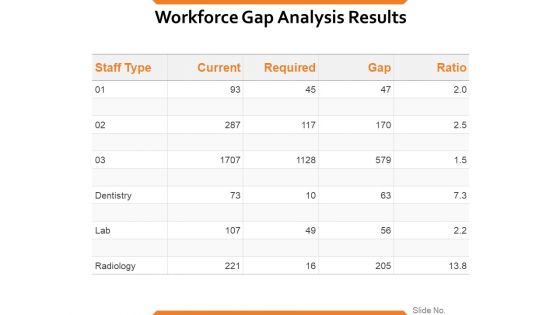
Workforce Gap Analysis Results Ppt PowerPoint Presentation Picture
This is a workforce gap analysis results ppt powerpoint presentation picture. This is a four stage process. The stages in this process are staff type, current, required, gap, ratio.
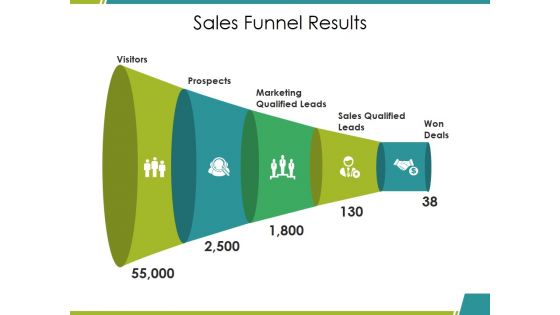
Sales Funnel Results Ppt PowerPoint Presentation Gallery Diagrams
This is a sales funnel results ppt powerpoint presentation gallery diagrams. This is a five stage process. The stages in this process are visitors, prospects, sales qualified leads, won, deals, marketing qualified leads.

Sales Funnel Results Ppt PowerPoint Presentation Summary Background Designs
This is a sales funnel results ppt powerpoint presentation summary background designs. This is a five stage process. The stages in this process are visitors, prospects, marketing qualified leads, sales qualified leads, won deals.
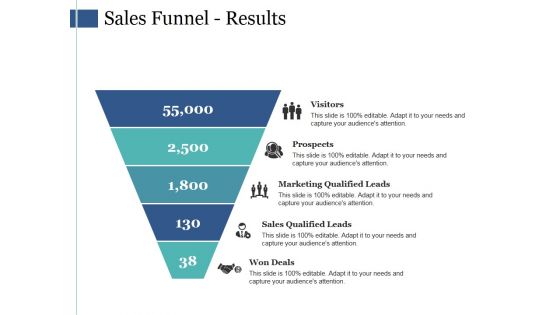
Sales Funnel Results Ppt PowerPoint Presentation Gallery Show
This is a sales funnel results ppt powerpoint presentation gallery show. This is a five stage process. The stages in this process are visitors, prospects, marketing qualified leads, sales qualified leads, won deals.
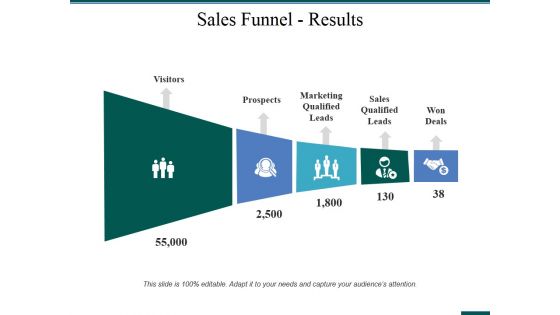
Sales Funnel Results Ppt PowerPoint Presentation Infographics Introduction
This is a sales funnel results ppt powerpoint presentation infographics introduction. This is a five stage process. The stages in this process are visitors, prospects, marketing qualified leads, sales qualified leads, won deals.

Sales Funnel Results Ppt PowerPoint Presentation Infographics Example Topics
This is a sales funnel results ppt powerpoint presentation infographics example topics. This is a five stage process. The stages in this process are visitors, prospects, sales qualified leads, won deals, marketing qualified leads.

Market Research Results Template Ppt PowerPoint Presentation Ideas Graphic Tips
This is a market research results template ppt powerpoint presentation ideas graphic tips. This is a four stage process. The stages in this process are option, icons, strategy, business, marketing.

Market Research Results Business Ppt PowerPoint Presentation Infographic Template Ideas
This is a market research results business ppt powerpoint presentation infographic template ideas. This is a four stage process. The stages in this process are business, planning, strategy, marketing, management.
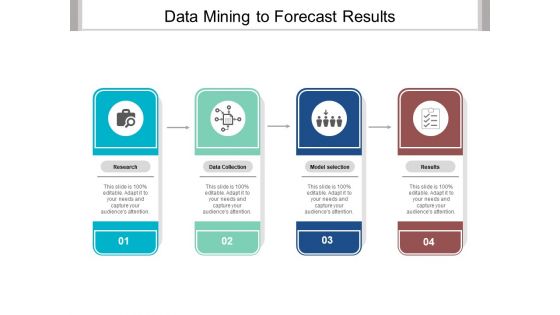
Data Mining To Forecast Results Ppt PowerPoint Presentation Ideas Inspiration
This is a data mining to forecast results ppt powerpoint presentation ideas inspiration. This is a four stage process. The stages in this process are predictive model, predictive framework, predictive structure.
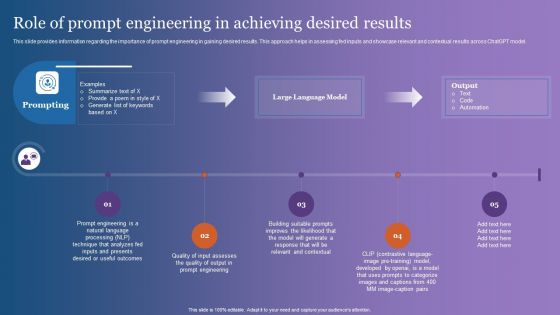
Role Of Prompt Engineering In Achieving Desired Results Themes PDF
This slide provides information regarding the importance of prompt engineering in gaining desired results. This approach helps in assessing fed inputs and showcase relevant and contextual results across ChatGPT model. If you are looking for a format to display your unique thoughts, then the professionally designed Role Of Prompt Engineering In Achieving Desired Results Themes PDF is the one for you. You can use it as a Google Slides template or a PowerPoint template. Incorporate impressive visuals, symbols, images, and other charts. Modify or reorganize the text boxes as you desire. Experiment with shade schemes and font pairings. Alter, share or cooperate with other people on your work. Download Role Of Prompt Engineering In Achieving Desired Results Themes PDF and find out how to give a successful presentation. Present a perfect display to your team and make your presentation unforgettable.

Clinical Trial Phases Results With Success Percentage Download PDF
This slide visually presents the success rate of multiple stages of the clinical trial procedure. Also, it provides information regarding the number of volunteers that successfully cleared each drug testing phase.Deliver an awe inspiring pitch with this creative Clinical Trial Phases Results With Success Percentage Download PDF bundle. Topics like Clinical Trial Phases Results With Success Percentage can be discussed with this completely editable template. It is available for immediate download depending on the needs and requirements of the user.
Product Results Icon With Expected Growth Ppt Pictures Show PDF
Persuade your audience using this Product Results Icon With Expected Growth Ppt Pictures Show PDF. This PPT design covers four stages, thus making it a great tool to use. It also caters to a variety of topics including Product Results Icon, Expected Growth. Download this PPT design now to present a convincing pitch that not only emphasizes the topic but also showcases your presentation skills.
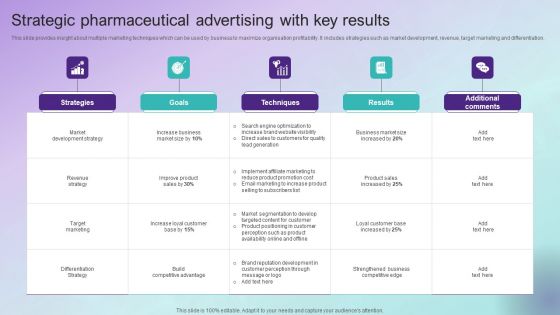
Strategic Pharmaceutical Advertising With Key Results Graphics PDF
This slide provides insight about multiple marketing techniques which can be used by business to maximize organisation profitability. It includes strategies such as market development, revenue, target marketing and differentiation. Showcasing this set of slides titled Strategic Pharmaceutical Advertising With Key Results Graphics PDF. The topics addressed in these templates are Strategies, Goals, Techniques, Results. All the content presented in this PPT design is completely editable. Download it and make adjustments in color, background, font etc. as per your unique business setting.

Results Based Marketing Ppt PowerPoint Presentation Outline Grid Cpb
Presenting this set of slides with name results based marketing ppt powerpoint presentation outline grid cpb. This is an editable Powerpoint five stages graphic that deals with topics like results based marketing to help convey your message better graphically. This product is a premium product available for immediate download and is 100 percent editable in Powerpoint. Download this now and use it in your presentations to impress your audience.
Objectives Key Results Ppt PowerPoint Presentation Introduction Cpb
Presenting this set of slides with name objectives key results ppt powerpoint presentation introduction cpb. This is an editable Powerpoint two stages graphic that deals with topics like objectives key results to help convey your message better graphically. This product is a premium product available for immediate download and is 100 percent editable in Powerpoint. Download this now and use it in your presentations to impress your audience.

Estimated Corporate Financial Results Report For Fy22 Ideas PDF
This slide illustrates expected financial forecast for a corporation in FY22. It includes monthly revenue data for different products of a single product line etc. Showcasing this set of slides titled Estimated Corporate Financial Results Report For Fy22 Ideas PDF. The topics addressed in these templates are Estimated Corporate, Financial, Results Report. All the content presented in this PPT design is completely editable. Download it and make adjustments in color, background, font etc. as per your unique business setting.

Determining The Customer Satisfaction Survey Results Mockup PDF
This slide displays survey results of customer satisfaction. Here the rating is done on survey questionnaire along with year wise statistics. Deliver and pitch your topic in the best possible manner with this determining the customer satisfaction survey results mockup pdf. Use them to share invaluable insights on requirements, survey questionnaire and impress your audience. This template can be altered and modified as per your expectations. So, grab it now.
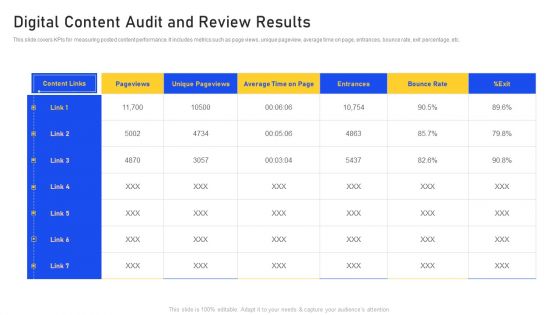
Digital Content Audit And Review Results Inspiration PDF
This slide covers KPIs for measuring posted content performance. It includes metrics such as page views, unique pageview, average time on page, entrances, bounce rate, exit percentage, etc. Deliver and pitch your topic in the best possible manner with this Digital Content Audit And Review Results Inspiration PDF. Use them to share invaluable insights on Digital Content, Audit And Review Results and impress your audience. This template can be altered and modified as per your expectations. So, grab it now.
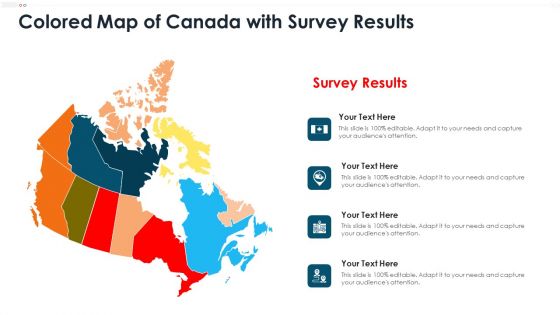
Colored Map Of Canada With Survey Results Demonstration PDF
Persuade your audience using this colored map of canada with survey results demonstration pdf. This PPT design covers four stages, thus making it a great tool to use. It also caters to a variety of topics including colored map of canada with survey results. Download this PPT design now to present a convincing pitch that not only emphasizes the topic but also showcases your presentation skills.
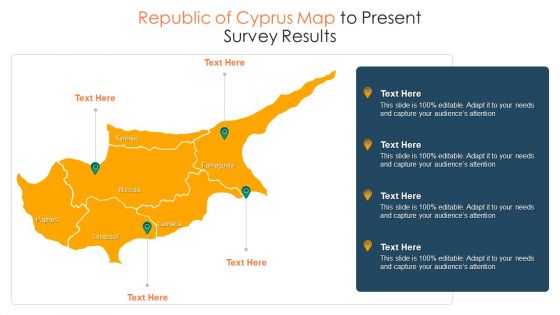
Republic Of Cyprus Map To Present Survey Results Summary PDF
Persuade your audience using this republic of cyprus map to present survey results summary pdf. This PPT design covers four stages, thus making it a great tool to use. It also caters to a variety of topics including republic of cyprus map to present survey results. Download this PPT design now to present a convincing pitch that not only emphasizes the topic but also showcases your presentation skills.
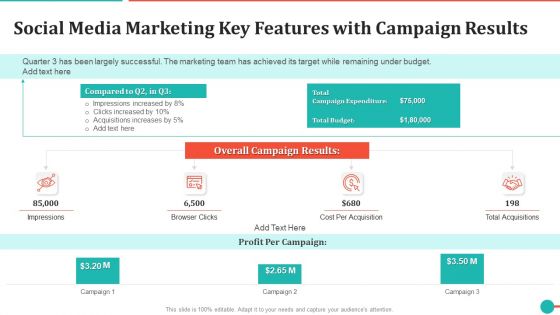
Social Media Marketing Key Features With Campaign Results Microsoft PDF
Persuade your audience using this social media marketing key features with campaign results microsoft pdf. This PPT design covers three stages, thus making it a great tool to use. It also caters to a variety of topics including social media marketing key features with campaign results. Download this PPT design now to present a convincing pitch that not only emphasizes the topic but also showcases your presentation skills.
End Stage Project Results Icon With Graph Information PDF
Persuade your audience using this end stage project results icon with graph information pdf. This PPT design covers three stages, thus making it a great tool to use. It also caters to a variety of topics including end stage project results icon with graph. Download this PPT design now to present a convincing pitch that not only emphasizes the topic but also showcases your presentation skills.
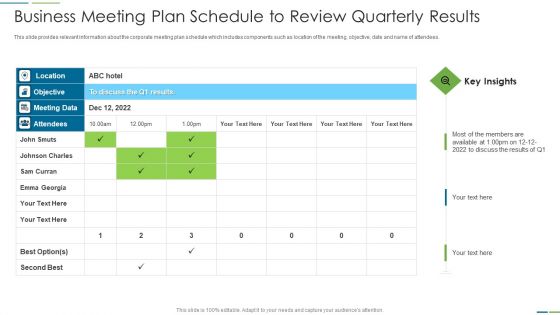
Business Meeting Plan Schedule To Review Quarterly Results Diagrams PDF
This slide provides relevant information about the corporate meeting plan schedule which includes components such as location of the meeting, objective, date and name of attendees.Showcasing this set of slides titled business meeting plan schedule to review quarterly results diagrams pdf The topics addressed in these templates are business meeting plan schedule to review quarterly results All the content presented in this PPT design is completely editable. Download it and make adjustments in color, background, font etc. as per your unique business setting.
Social Media Analytics Icon Highlighting Marketing Results Mockup PDF
Persuade your audience using this Social Media Analytics Icon Highlighting Marketing Results Mockup PDF. This PPT design covers four stages, thus making it a great tool to use. It also caters to a variety of topics including Social Media Analytics Icon Highlighting Marketing Results. Download this PPT design now to present a convincing pitch that not only emphasizes the topic but also showcases your presentation skills.
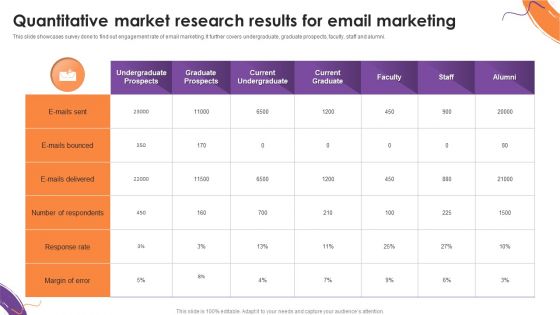
Quantitative Market Research Results For Email Marketing Formats PDF
This slide showcases survey done to find out engagement rate of email marketing. It further covers undergraduate, graduate prospects, faculty, staff and alumni. Pitch your topic with ease and precision using this Quantitative Market Research Results For Email Marketing Formats PDF. This layout presents information on Quantitative Market Research Results, Email Marketing. It is also available for immediate download and adjustment. So, changes can be made in the color, design, graphics or any other component to create a unique layout.

Quarterly Business Review With Performance Metrics And Results Ideas PDF
This slide shows budgeted v or s actual business projection results. It includes forecast based on growth in sales, target customers and average expenses incurred to attract target audience. Showcasing this set of slides titled Quarterly Business Review With Performance Metrics And Results Ideas PDF. The topics addressed in these templates are Sale, Customer, Average Spent. All the content presented in this PPT design is completely editable. Download it and make adjustments in color, background, font etc. as per your unique business setting.
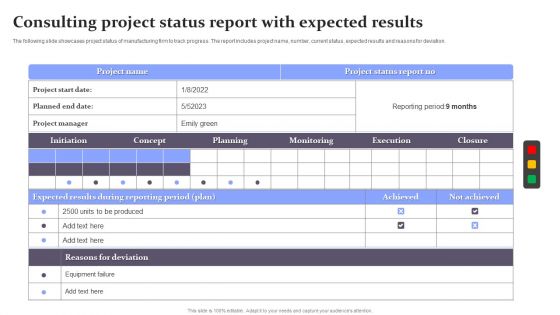
Consulting Project Status Report With Expected Results Portrait PDF
The following slide showcases project status of manufacturing firm to track progress. The report includes project name, number, current status, expected results and reasons for deviation. Pitch your topic with ease and precision using this Consulting Project Status Report With Expected Results Portrait PDF. This layout presents information on Execution, Equipment, Plan. It is also available for immediate download and adjustment. So, changes can be made in the color, design, graphics or any other component to create a unique layout.

Kpis To Measure B2B Promotional Communication Results Graphics PDF
This slide signifies the key performance indicator to evaluate business to business marketing communication results. It covers information about metrics, key description, forecast, actual, variance and strategies. Showcasing this set of slides titled Kpis To Measure B2B Promotional Communication Results Graphics PDF. The topics addressed in these templates are Key Description, Forecast, Actual, Variance. All the content presented in this PPT design is completely editable. Download it and make adjustments in color, background, font etc. as per your unique business setting.
Manager Icon Highlighting Sales And Marketing Project Results Sample PDF
Persuade your audience using this Manager Icon Highlighting Sales And Marketing Project Results Sample PDF. This PPT design covers three stages, thus making it a great tool to use. It also caters to a variety of topics including Manager Icon Highlighting Sales, Marketing Project Results. Download this PPT design now to present a convincing pitch that not only emphasizes the topic but also showcases your presentation skills.
Icon For Social Media Marketing Campaign Results Summary PDF
Persuade your audience using this Icon For Social Media Marketing Campaign Results Summary PDF. This PPT design covers Five stages, thus making it a great tool to use. It also caters to a variety of topics including Icon For Social Media, Marketing Campaign Results. Download this PPT design now to present a convincing pitch that not only emphasizes the topic but also showcases your presentation skills.
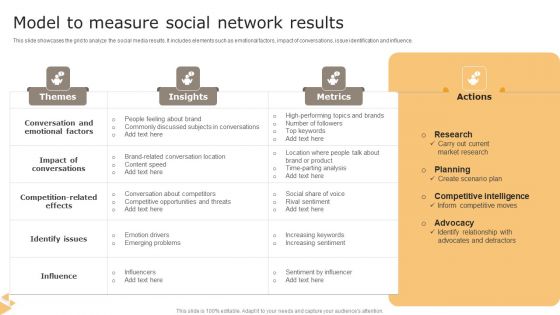
Model To Measure Social Network Results Portrait PDF
This slide showcases the grid to analyze the social media results. It includes elements such as emotional factors, impact of conversations, issue identification and influence. Showcasing this set of slides titled Model To Measure Social Network Results Portrait PDF. The topics addressed in these templates are Impact Of Conversations, Analysis, Social. All the content presented in this PPT design is completely editable. Download it and make adjustments in color, background, font etc. as per your unique business setting.
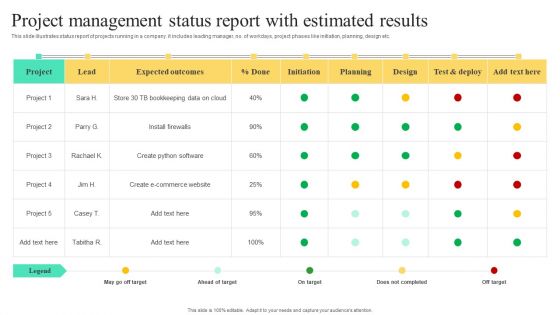
Project Management Status Report With Estimated Results Template PDF
This slide illustrates status report of projects running in a company. it includes leading manager, no. of workdays, project phases like initiation, planning, design etc. Showcasing this set of slides titled Project Management Status Report With Estimated Results Template PDF. The topics addressed in these templates are Project Management, Status Report, Estimated Results. All the content presented in this PPT design is completely editable. Download it and make adjustments in color, background, font etc. as per your unique business setting.

EBITDA Margin By Market Segment With Results One Pager Documents
Presenting you a fantastic EBITDA Margin By Market Segment With Results One Pager Documents. This piece is crafted on hours of research and professional design efforts to ensure you have the best resource. It is completely editable and its design allow you to rehash its elements to suit your needs. Get this EBITDA Margin By Market Segment With Results One Pager Documents A4 One-pager now.

Kpis To Measure Personalized Marketing Results Inspiration PDF
Get a simple yet stunning designed Kpis To Measure Personalized Marketing Results Inspiration PDF. It is the best one to establish the tone in your meetings. It is an excellent way to make your presentations highly effective. So, download this PPT today from Slidegeeks and see the positive impacts. Our easy-to-edit Kpis To Measure Personalized Marketing Results Inspiration PDF can be your go-to option for all upcoming conferences and meetings. So, what are you waiting for Grab this template today.
Pre And Post Results Of Process Changes Icon Template PDF

KPI Dashboard Highlighting Results Of Online Marketing Assessment Background PDF
Entire slide outlines KPI dashboard displaying the results of an analysis of digital marketing which assist in measuring the revenue through digital marketing. Showcasing this set of slides titled KPI Dashboard Highlighting Results Of Online Marketing Assessment Background PDF. The topics addressed in these templates are Cost Per Click, Total Transaction, Sessions. All the content presented in this PPT design is completely editable. Download it and make adjustments in color, background, font etc. as per your unique business setting.
Tracking Goals With Key Results Areas And Initiatives Graphics PDF
This slide covers the tracking sheet for recording key initiatives to achieve the desired objectives. It also includes the progress report, due date, and key result areas for the listed goals. Persuade your audience using this Tracking Goals With Key Results Areas And Initiatives Graphics PDF. This PPT design covers five stages, thus making it a great tool to use. It also caters to a variety of topics including Improve Customer Retention, Develop, Average. Download this PPT design now to present a convincing pitch that not only emphasizes the topic but also showcases your presentation skills.

 Home
Home