Quarterly Timeline
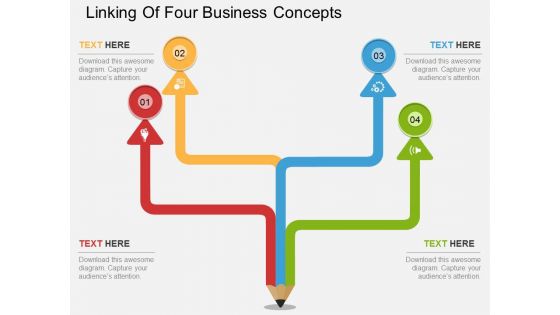
Linking Of Four Business Concepts Powerpoint Template
This PowerPoint template has been designed with four steps pencil diagram. This diagram is excellent visual tools to present link of steps. Download this PPT slide to explain complex data immediately and clearly.
Navigation Point Four Banners And Icons Powerpoint Template
This PowerPoint template has been designed with four banners icons. This diagram is excellent visual tools for business presentations. Download this PPT slide to explain complex data immediately and clearly.
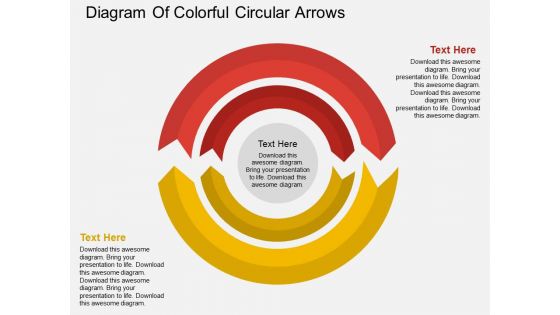
Diagram Of Colorful Circular Arrows Powerpoint Template
Our above PPT slide contains circular arrow design. This business diagram helps to exhibit process flow. Use this diagram to impart more clarity to data and to create more sound impact on viewers.
Four Arrows Design With Icons Powerpoint Template
The above PowerPoint slide displays four arrows design with icons. This PowerPoint diagram helps to summarize complex business data. Adjust the above diagram in your business presentations to visually support your content.

Four Arrows Tags Infographics Powerpoint Template
The above PowerPoint slide displays four arrows design with icons. This PowerPoint diagram helps to summarize complex business data. Adjust the above diagram in your business presentations to visually support your content.
Four Banners With Business Icons Powerpoint Template
The above PowerPoint slide displays four banners with icons. This PowerPoint diagram helps to summarize complex business data. Adjust the above diagram in your business presentations to visually support your content.
Four Banners With Finance Growth Icons Powerpoint Template
The above PowerPoint slide displays four banners with finance growth icons. This PowerPoint diagram helps to summarize complex business data. Adjust the above diagram in your business presentations to visually support your content.
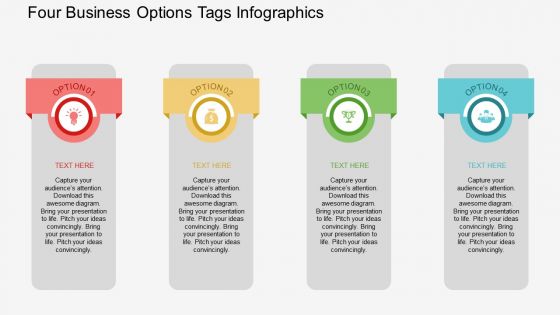
Four Business Options Tags Infographics Powerpoint Template
The above PowerPoint slide displays four options tags infographic. This PowerPoint diagram helps to summarize complex business data. Adjust the above diagram in your business presentations to visually support your content.
Four Circle Pencil Tags With Icons Diagram Powerpoint Template
The above PowerPoint slide displays four circle pencil tags with icons This PowerPoint diagram helps to summarize complex business data. Adjust the above diagram in your business presentations to visually support your content.
Four Colored Arrow Tags With Icons Powerpoint Template
The above PowerPoint slide displays four colored arrow tags with icons. This PowerPoint diagram helps to summarize complex business data. Adjust the above diagram in your business presentations to visually support your content.
Four Colorful Circle Tags With Icons Powerpoint Template
The above PowerPoint slide displays four colorful circle tags with icons. This PowerPoint diagram helps to summarize complex business data. Adjust the above diagram in your business presentations to visually support your content.
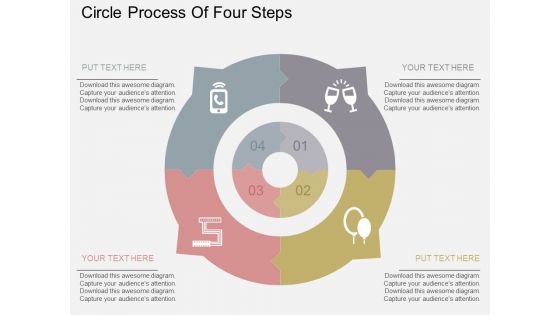
Circle Process Of Four Steps Powerpoint Templates
Our above slide contains graphics of bulb with success graph. It helps to exhibit planning for growth. Use this diagram to impart more clarity to data and to create more sound impact on viewers.

Money Exchange Electronic Transactions Powerpoint Templates
Our above slide contains illustration of money exchange. It helps to display electronic transactions. Use this diagram to impart more clarity to data and to create more sound impact on viewers.
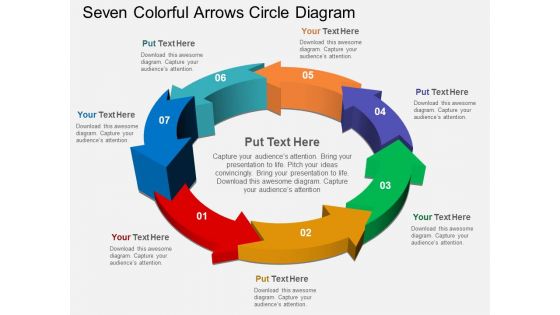
Seven Colorful Arrows Circle Diagram Powerpoint Templates
Our above PPT slide contains arrows infographic. It helps to display outline of business plan. Use this diagram to impart more clarity to data and to create more sound impact on viewers.

Arrows Infographic For Strategic Management Concept Powerpoint Template
Our above PPT slide contains four curved arrows infographic design. This business diagram helps to depict business information for strategic management. Use this diagram to impart more clarity to data and to create more sound impact on viewers.
Four Staged Pie Chart With Icons Powerpoint Templates
A good quality PowerPoint template is the foundation for every presentation. This PPT slide contains graphics of pie chart. Download this slide to outline business data. This slide is innovatively designed to highlight your worthy views.

Four Circles For Information Display Powerpoint Templates
This PowerPoint slide contains graphics of four circles. This professional slide may be used for visual explanation of data. Adjust the above diagram in your business presentations to give professional impact.
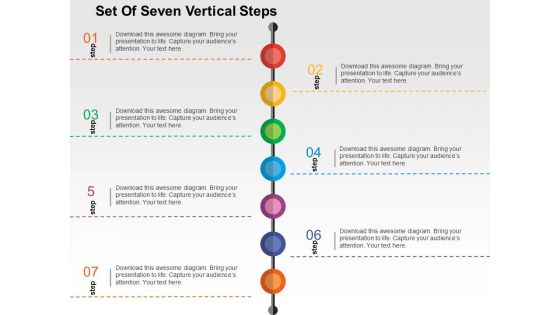
Set Of Seven Vertical Steps Powerpoint Templates
This PowerPoint slide contains graphics of seven vertical steps. This professional slide may be used for visual explanation of data. Adjust the above diagram in your business presentations to give professional impact.

Set Of Six Vertical Steps Powerpoint Templates
This PowerPoint slide contains graphics of six vertical steps. This professional slide may be used for visual explanation of data. Adjust the above diagram in your business presentations to give professional impact.
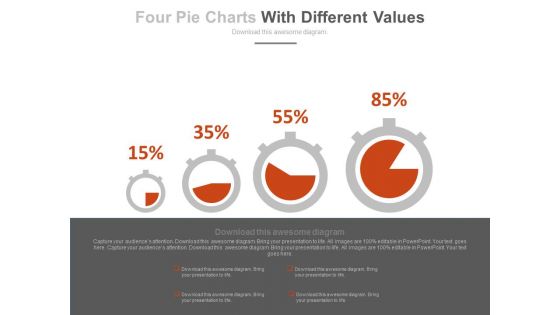
Dashboard With Increasing Values Powerpoint Slides
This innovative, stunningly beautiful dashboard has been designed for data visualization. It contains pie charts with increasing percentage values. This PowerPoint template helps to display your information in a useful, simple and uncluttered way.

Illustration Of Save Money Concept Powerpoint Templates
This business slide has been designed with infographic square. These text boxes can be used for data representation. Use this diagram for your business presentations. Build a quality presentation for your viewers with this unique diagram.

Four Circular Steps Process Infographics Powerpoint Template
This PowerPoint slide contains circular steps process infographic. This professional slide may be used for visual explanation of data. Adjust the above diagram in your business presentations to give professional impact.
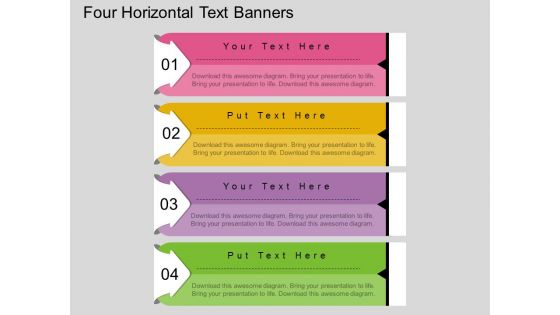
Four Horizontal Text Banners Powerpoint Template
This PowerPoint template has been designed with four horizontal text banners. This diagram is excellent visual tools for business presentations. Download this PPT slide to explain complex data immediately and clearly.
Four Sequential Boxes And Icons Diagram Powerpoint Template
This PowerPoint template has been designed with four sequential boxes and icons. This diagram is excellent visual tools for business presentations. Download this PPT slide to explain complex data immediately and clearly.
Four Sequential Text Banners With Icons Powerpoint Template
This PowerPoint template has been designed with four sequential text banners and icons. This diagram is excellent visual tools for business presentations. Download this PPT slide to explain complex data immediately and clearly.
Four Staged Numeric Banners With Icons Powerpoint Template
This PowerPoint template has been designed with four staged numeric banners icons. This diagram is excellent visual tools for business presentations. Download this PPT slide to explain complex data immediately and clearly.
Four Text Boxes With Icons Powerpoint Templates
This Business diagram can be used to display data, business information etc. You can easily customize this PowerPoint template as per your need. Capture the attention of your audience.

Donating Money To Charity Powerpoint Template
Our above slide contains ten staged colorful infographic. It helps to exhibit concepts of charity and donation. Use this diagram to impart more clarity to data and to create more sound impact on viewers.

Business Corporate Ecommerce Statistics Powerpoint Slides
This PowerPoint template contains three tags with numeric data. You may download this slide to display business, corporate and ecommerce statistics. You can easily customize this template to make it more unique as per your need.

Three Tags For Ecommerce Business And Corporate Concepts Powerpoint Slides
This PowerPoint template contains three tags with numeric data. You may download this slide to display business, corporate and ecommerce statistics. You can easily customize this template to make it more unique as per your need.
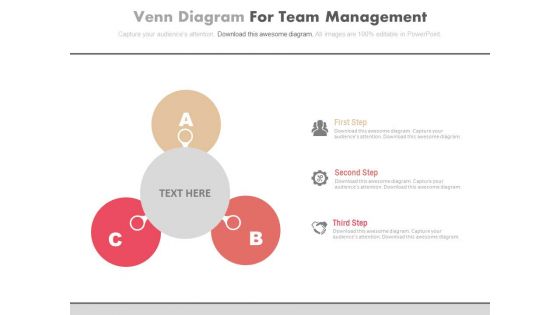
Abc Steps For Corporate Entrepreneurship Powerpoint Template
Our above PPT slide contains graphics of ABC steps chart. This business diagram helps to depict concept of corporate entrepreneurship. Use this diagram to impart more clarity to data and to create more sound impact on viewers.
Four Colored Text Boxes With Icons Powerpoint Slides
This PowerPoint template has been designed with graphics of four text boxes. Download this PPT slide to display percentage data display. Use this professional template to build an exclusive presentation.
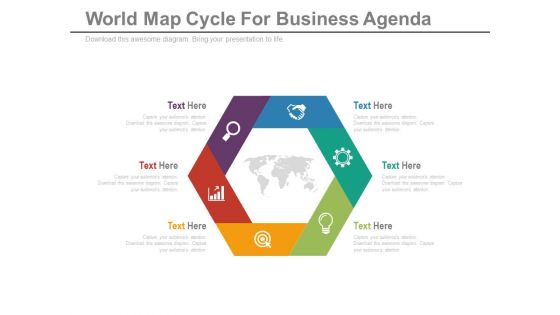
Diagram For Global Business Strategy Powerpoint Template
Our above slide contains hexagonal infographic diagram. This PowerPoint template helps to display global business strategy. Use this diagram to impart more clarity to data and to create more sound impact on viewers.
Hexagonal Chart With Finance And Communication Icons Powerpoint Template
Our above slide contains hexagonal chart with finance and communication icons. This PowerPoint template helps to display communication steps. Use this diagram to impart more clarity to data and to create more sound impact on viewers.
Suitcase Infographic With Business Strategy Icons Powerpoint Template
This PowerPoint slide contains suitcase infographic with business strategy icons. It helps to exhibit concepts of business travel and meetings. Use this diagram to impart more clarity to data and to create more sound impact on viewers.
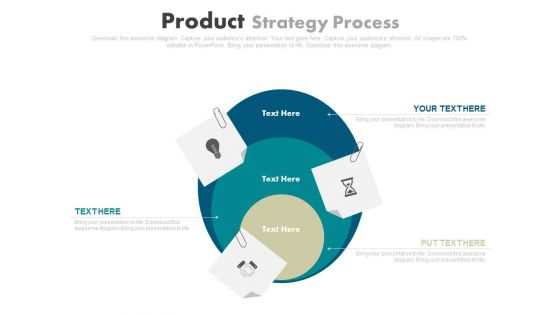
Three Steps Business Strategy Chart Powerpoint Template
This PowerPoint slide contains three steps infographic hart. It helps to exhibit business strategy steps. Use this diagram to impart more clarity to data and to create more sound impact on viewers.

Five Steps Infographic Design Powerpoint Templates
Our above slide contains graphics of six hands around bulb. It helps to display steps of idea planning. Use this diagram to impart more clarity to data and to create more sound impact on viewers.

Five Tags For Strategic Management Powerpoint Templates
Our above slide contains diagram of circular infographic. It helps to exhibit six steps of goal planning. Use this diagram to impart more clarity to data and to create more sound impact on viewers.
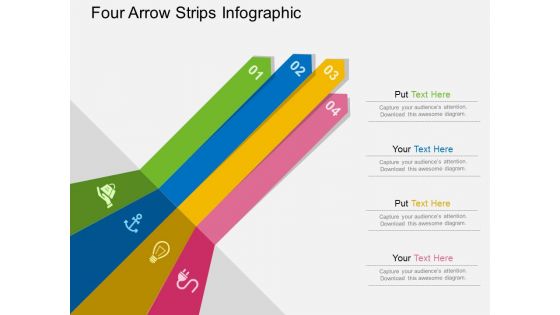
Four Arrow Strips Infographic Powerpoint Templates
Our above slide contains graphics of bulb with success graph. It helps to exhibit planning for growth. Use this diagram to impart more clarity to data and to create more sound impact on viewers.

Global Shipping And Finance Services Powerpoint Templates
Our above PPT slide contains triangles infographic. It helps to display outline of business plan. Use this diagram to impart more clarity to data and to create more sound impact on viewers.

Team Pictures With Names And Profile Powerpoint Slides
This PowerPoint template has been designed with team pictures and profile information. This diagram is excellent visual tools to present team profile. Download this PPT slide to explain complex data immediately and clearly.

Team Profiles For About Us Slide Powerpoint Slides
This PowerPoint template has been designed with team pictures and profile information. This diagram is excellent visual tools to present team profile. Download this PPT slide to explain complex data immediately and clearly.
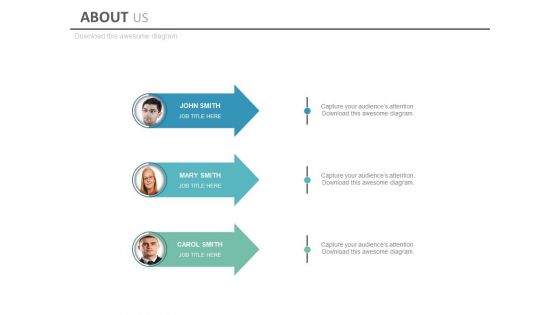
Three Arrow For Team Members Profile Powerpoint Slides
This PowerPoint template has been designed with three arrows and team pictures. This diagram is excellent visual tools for business presentations. Download this PPT slide to explain complex data immediately and clearly.
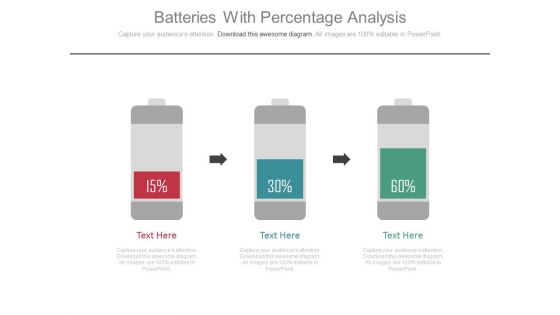
Three Batteries As Growth Steps Powerpoint Slides
This PowerPoint template has been designed with graphics of three batteries. Download this PPT slide for data comparisons or it may be used to display growth steps. Add this slide to your presentation and impress your superiors.

Business People Profile For Social Media Powerpoint Slides
This PowerPoint template has been designed with business people profile information. This diagram is excellent visual tools to present team profile with social media. Download this PPT slide to explain complex data immediately and clearly.

Business Team About Us Page Powerpoint Slides
This PowerPoint template has been designed with team pictures and business icons. This diagram is excellent visual tools to present teams strategic planning. Download this PPT slide to explain complex data immediately and clearly.
Three Options Puzzle Diagram With Icons Powerpoint Slides
Our above slide contains graphics of three options puzzle diagram with icons. It helps to display concepts in visual manner. Use this diagram to impart more clarity to data and to create more sound impact on viewers.

Three Puzzle Steps For Business Solutions Powerpoint Slides
Our above slide contains graphics of three puzzle steps. This slide is suitable to present business management and strategy. Use this diagram to impart more clarity to data and to create more sound impact on viewers.
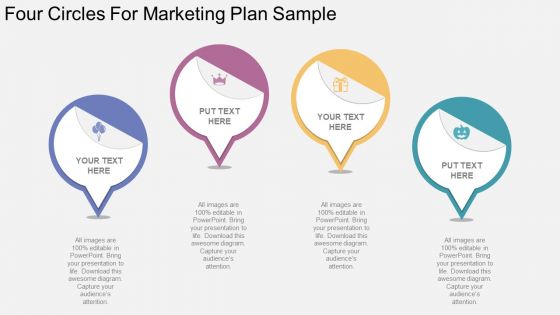
Four Circles For Marketing Plan Sample Powerpoint Template
Our above slide contains infographic diagram of four circles. This PPT slide helps to exhibit sample of marketing plan. Use this PowerPoint template to impart more clarity to data and to create more sound impact on viewers.
Ladder With Icons For Financial Growth And Success Powerpoint Template
Our above slide contains graphics of ladder with icons. This PowerPoint template helps to display financial growth and success. Use this diagram to impart more clarity to data and to create more sound impact on viewers.

Six Staged Concentric Circles For Business Marketing Strategy Powerpoint Template
Our above PPT slide contains graphics of concentric circles. This PowerPoint template may be used to depict business marketing strategy. Use this diagram to impart more clarity to data and to create more sound impact on viewers.
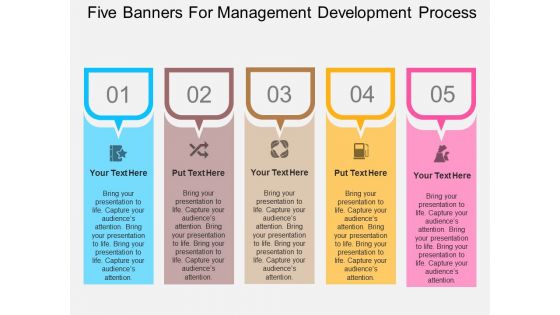
Five Banners For Management Development Process Powerpoint Template
This PowerPoint template has been designed with graphics of five text banners and icons. This diagram may be sued to display management development process. Download this PPT slide to explain complex data immediately and clearly.

Five Banners For Nature And Finance Process Flow Powerpoint Template
This PowerPoint template has been designed with five banners nature, finance icons. This diagram is excellent visual tools for business presentations. Download this PPT slide to explain complex data immediately and clearly.

Four Arrows For Different Process Representation Powerpoint Template
This PowerPoint template has been designed with graphics of four arrows This diagram is excellent visual tools for business presentations. Download this PPT slide to explain complex data immediately and clearly.
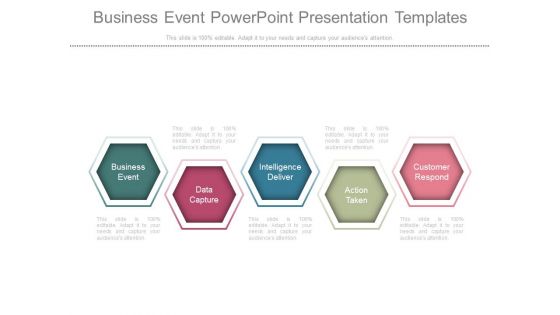
Business Event Powerpoint Presentation Templates
This is a business event powerpoint presentation templates. This is a five stage process. The stages in this process are business event, data capture, intelligence deliver, action taken, customer respond.

Develop Financial Goals Presentation Slides
This is a develop financial goals presentation slides. This is a five stage process. The stages in this process are establish relationship, gather data, develop financial goals, analyze financial status, review proposed plan.\n\n
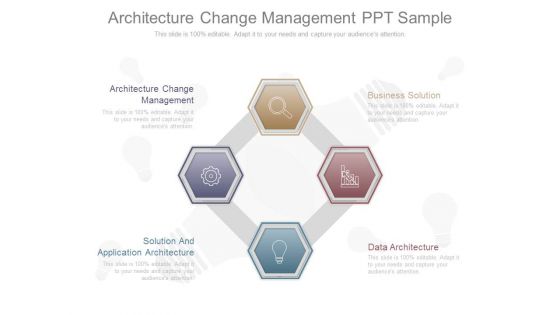
Architecture Change Management Ppt Sample
This is a architecture change management ppt sample. This is a four stage process. The stages in this process are architecture change management, business solution, solution and application architecture, data architecture.
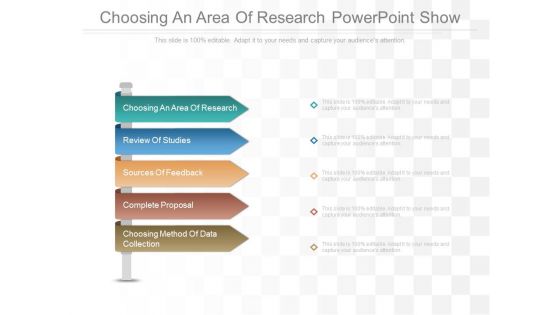
Choosing An Area Of Research Powerpoint Show
This is a choosing an area of research powerpoint show. This is a five stage process. The stages in this process are choosing an area of research, review of studies, sources of feedback, complete proposal, choosing method of data collection.
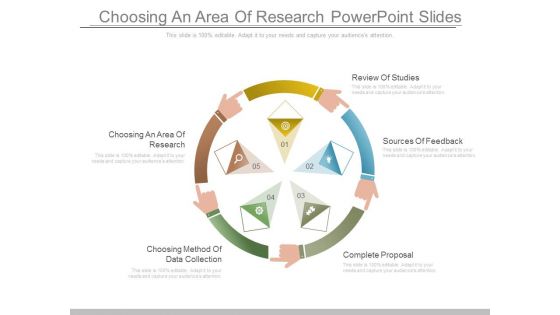
Choosing An Area Of Research Powerpoint Slides
This is a choosing an area of research powerpoint slides. This is a five stage process. The stages in this process are choosing an area of research, choosing method of data collection, review of studies, sources of feedback, complete proposal.

Business Benchmarking Diagram Example Of Ppt Presentation
This is a business benchmarking diagram example of ppt presentation. This is a seven stage process. The stages in this process are refine and reiterate, review results, take action, plan, analyze, gather data, benchmarking.

 Home
Home