Quality Report
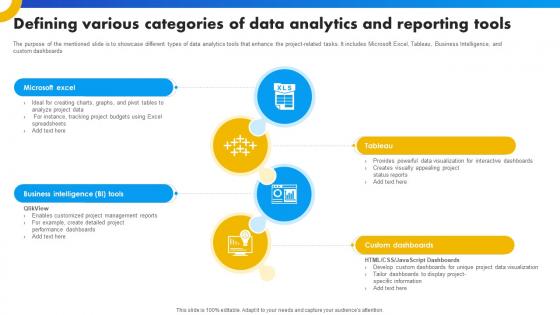
Defining Various Categories Of Data Analytics And Reporting Tools Strategies For Success In Digital
The purpose of the mentioned slide is to showcase different types of data analytics tools that enhance the project-related tasks. It includes Microsoft Excel, Tableau, Business Intelligence, and custom dashboards. Slidegeeks is here to make your presentations a breeze with Defining Various Categories Of Data Analytics And Reporting Tools Strategies For Success In Digital With our easy-to-use and customizable templates, you can focus on delivering your ideas rather than worrying about formatting. With a variety of designs to choose from, you are sure to find one that suits your needs. And with animations and unique photos, illustrations, and fonts, you can make your presentation pop. So whether you are giving a sales pitch or presenting to the board, make sure to check out Slidegeeks first
Data Lake Implementation Centralized Repository Data Lake Reporting Dashboard Icons PDF
This slide represents the data lake reporting dashboard by covering the total number of users, total lake size, trusted zone size, conversion rate, and retention. Get a simple yet stunning designed Data Lake Implementation Centralized Repository Data Lake Reporting Dashboard Icons PDF. It is the best one to establish the tone in your meetings. It is an excellent way to make your presentations highly effective. So, download this PPT today from Slidegeeks and see the positive impacts. Our easy-to-edit Data Lake Implementation Centralized Repository Data Lake Reporting Dashboard Icons PDF can be your go-to option for all upcoming conferences and meetings. So, what are you waiting for Grab this template today.

Testing Process Flow With Plans And Reporting Ppt PowerPoint Presentation Slides Diagrams PDF
Showcasing this set of slides titled testing process flow with plans and reporting ppt powerpoint presentation slides diagrams pdf. The topics addressed in these templates are develop test plans, testing plan completion, analyze constraints, management acceptance. All the content presented in this PPT design is completely editable. Download it and make adjustments in color, background, font etc. as per your unique business setting.

Tools For HR Business Analytics Comparison Between Reporting Type Flow Inspiration PDF
This slide represents the difference between the types of data reporting flow. It includes comparison between traditional BI and self-service BI on the basis of IT setup, agility, data governance, kind of reporting and data. If you are looking for a format to display your unique thoughts, then the professionally designed Tools For HR Business Analytics Comparison Between Reporting Type Flow Inspiration PDF is the one for you. You can use it as a Google Slides template or a PowerPoint template. Incorporate impressive visuals, symbols, images, and other charts. Modify or reorganize the text boxes as you desire. Experiment with shade schemes and font pairings. Alter, share or cooperate with other people on your work. Download Tools For HR Business Analytics Comparison Between Reporting Type Flow Inspiration PDF and find out how to give a successful presentation. Present a perfect display to your team and make your presentation unforgettable.

BI Implementation To Enhance Hiring Process Comparison Between Reporting Type Flow Infographics PDF
This slide represents the difference between the types of data reporting flow. It includes comparison between traditional BI and self-service BI on the basis of IT setup, agility, data governance, kind of reporting and data.Are you in need of a template that can accommodate all of your creative concepts This one is crafted professionally and can be altered to fit any style. Use it with Google Slides or PowerPoint. Include striking photographs, symbols, depictions, and other visuals. Fill, move around, or remove text boxes as desired. Test out color palettes and font mixtures. Edit and save your work, or work with colleagues. Download BI Implementation To Enhance Hiring Process Comparison Between Reporting Type Flow Infographics PDF and observe how to make your presentation outstanding. Give an impeccable presentation to your group and make your presentation unforgettable.

Development And Operations Tools Introduction With Reports And Test Plan Formats PDF
Persuade your audience using this development and operations tools introduction with reports and test plan formats pdf. This PPT design covers five stages, thus making it a great tool to use. It also caters to a variety of topics including management, secure, plan. Download this PPT design now to present a convincing pitch that not only emphasizes the topic but also showcases your presentation skills.
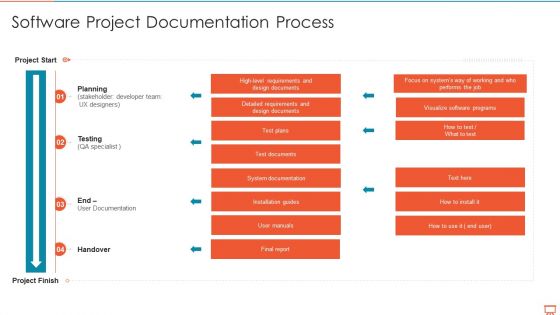
Project Management Experts Required Reports Software Project Documentation Process Themes PDF
Deliver and pitch your topic in the best possible manner with this project management experts required reports software project documentation process themes pdf. Use them to share invaluable insights on planning, testing, end, handover and impress your audience. This template can be altered and modified as per your expectations. So, grab it now.
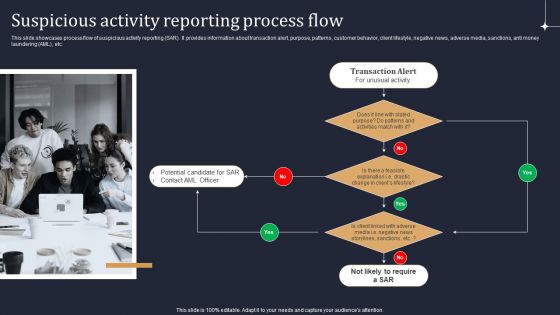
KYC Transaction Monitoring System Business Security Suspicious Activity Reporting Process Flow Summary PDF
This slide showcases process flow of suspicious activity reporting SAR. It provides information about transaction alert, purpose, patterns, customer behavior, client lifestyle, negative news, adverse media, sanctions, anti money laundering AML, etc. Get a simple yet stunning designed KYC Transaction Monitoring System Business Security Suspicious Activity Reporting Process Flow Summary PDF. It is the best one to establish the tone in your meetings. It is an excellent way to make your presentations highly effective. So, download this PPT today from Slidegeeks and see the positive impacts. Our easy to edit KYC Transaction Monitoring System Business Security Suspicious Activity Reporting Process Flow Summary PDF can be your go to option for all upcoming conferences and meetings. So, what are you waiting for Grab this template today.
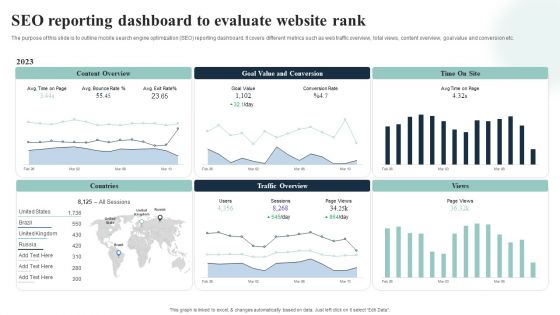
Introduction To Mobile SEM SEO Reporting Dashboard To Evaluate Website Rank Portrait PDF
The purpose of this slide is to outline mobile search engine optimization SEO reporting dashboard. It covers different metrics such as web traffic overview, total views, content overview, goal value and conversion etc. Get a simple yet stunning designed Introduction To Mobile SEM SEO Reporting Dashboard To Evaluate Website Rank Portrait PDF. It is the best one to establish the tone in your meetings. It is an excellent way to make your presentations highly effective. So, download this PPT today from Slidegeeks and see the positive impacts. Our easy to edit Introduction To Mobile SEM SEO Reporting Dashboard To Evaluate Website Rank Portrait PDF can be your go to option for all upcoming conferences and meetings. So, what are you waiting for Grab this template today.
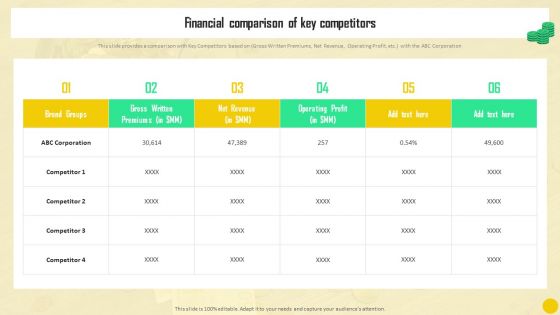
Financial Reporting To Analyze Financial Comparison Of Key Competitors Designs PDF
This slide provides a comparison with Key Competitors based on Gross Written Premiums, Net Revenue, Operating Profit, etc. with the ABC Corporation Get a simple yet stunning designed Financial Reporting To Analyze Financial Comparison Of Key Competitors Designs PDF. It is the best one to establish the tone in your meetings. It is an excellent way to make your presentations highly effective. So, download this PPT today from Slidegeeks and see the positive impacts. Our easy-to-edit Financial Reporting To Analyze Financial Comparison Of Key Competitors Designs PDF can be your go-to option for all upcoming conferences and meetings. So, what are you waiting for Grab this template today.

IT System Risk Management Guide Top IT Risks Reported At The Workplace Infographics PDF
This slide highlights the top IT risks reported at workplace which includes cyber threats, data loss, social engineering attacks, regulatory incidents, domain based threats and denial of service. Do you have to make sure that everyone on your team knows about any specific topic I yes, then you should give IT System Risk Management Guide Top IT Risks Reported At The Workplace Infographics PDF a try. Our experts have put a lot of knowledge and effort into creating this impeccable IT System Risk Management Guide Top IT Risks Reported At The Workplace Infographics PDF. You can use this template for your upcoming presentations, as the slides are perfect to represent even the tiniest detail. You can download these templates from the Slidegeeks website and these are easy to edit. So grab these today.
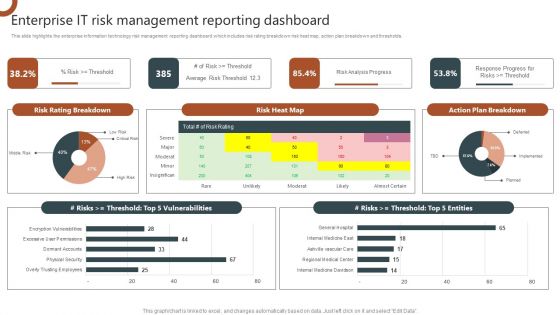
Organizations Risk Management And IT Security Enterprise IT Risk Management Reporting Dashboard Diagrams PDF
This slide highlights the enterprise information technology risk management reporting dashboard which includes risk rating breakdown risk heat map, action plan breakdown and thresholds. This Organizations Risk Management And IT Security Enterprise IT Risk Management Reporting Dashboard Diagrams PDF is perfect for any presentation, be it in front of clients or colleagues. It is a versatile and stylish solution for organizing your meetings. The Organizations Risk Management And IT Security Enterprise IT Risk Management Reporting Dashboard Diagrams PDF features a modern design for your presentation meetings. The adjustable and customizable slides provide unlimited possibilities for acing up your presentation. Slidegeeks has done all the homework before launching the product for you. So, do not wait, grab the presentation templates today.
Business To Business Digital Implement Tracking And Reporting To Measure Summary PDF
This template covers dashboard to measure and analyze campaign performance. It also helps in tracking and reporting account based marketing channel and tactics. If you are looking for a format to display your unique thoughts, then the professionally designed Business To Business Digital Implement Tracking And Reporting To Measure Summary PDF is the one for you. You can use it as a Google Slides template or a PowerPoint template. Incorporate impressive visuals, symbols, images, and other charts. Modify or reorganize the text boxes as you desire. Experiment with shade schemes and font pairings. Alter, share or cooperate with other people on your work. Download Business To Business Digital Implement Tracking And Reporting To Measure Summary PDF and find out how to give a successful presentation. Present a perfect display to your team and make your presentation unforgettable.

Seo Reporting Dashboard To Evaluate Website Rank Search Engine Optimization Services To Minimize Template PDF
The purpose of this slide is to outline mobile search engine optimization SEO reporting dashboard. It covers different metrics such as web traffic overview, total views, content overview, goal value and conversion etc. This Seo Reporting Dashboard To Evaluate Website Rank Search Engine Optimization Services To Minimize Template PDF is perfect for any presentation, be it in front of clients or colleagues. It is a versatile and stylish solution for organizing your meetings. The Seo Reporting Dashboard To Evaluate Website Rank Search Engine Optimization Services To Minimize Template PDF features a modern design for your presentation meetings. The adjustable and customizable slides provide unlimited possibilities for acing up your presentation. Slidegeeks has done all the homework before launching the product for you. So, do not wait, grab the presentation templates today.
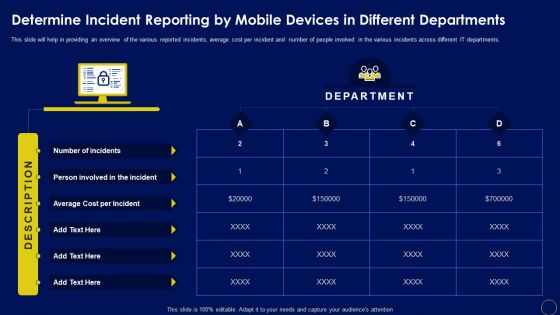
Determine Incident Reporting By Mobile Devices In Business Mobile Device Security Management Designs PDF
This slide will help in providing an overview of the various reported incidents, average cost per incident and number of people involved in the various incidents across different IT departments. Are you searching for a Determine Incident Reporting By Mobile Devices In Business Mobile Device Security Management Designs PDF that is uncluttered, straightforward, and original Its easy to edit, and you can change the colors to suit your personal or business branding. For a presentation that expresses how much effort you ve put in, this template is ideal With all of its features, including tables, diagrams, statistics, and lists, its perfect for a business plan presentation. Make your ideas more appealing with these professional slides. Download Determine Incident Reporting By Mobile Devices In Business Mobile Device Security Management Designs PDF from Slidegeeks today.
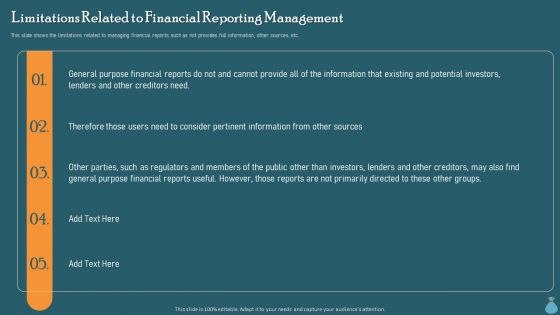
Financial Data Revelation To Varied Stakeholders Limitations Related To Financial Reporting Management Information PDF
This slide shows the limitations related to managing financial reports such as not provides full information, other sources, etc. This Financial Data Revelation To Varied Stakeholders Limitations Related To Financial Reporting Management Information PDF is perfect for any presentation, be it in front of clients or colleagues. It is a versatile and stylish solution for organizing your meetings. The Financial Data Revelation To Varied Stakeholders Limitations Related To Financial Reporting Management Information PDF features a modern design for your presentation meetings. The adjustable and customizable slides provide unlimited possibilities for acing up your presentation. Slidegeeks has done all the homework before launching the product for you. So, do not wait, grab the presentation templates today.

Top SEO Techniques Seo Reporting Dashboard To Evaluate Website Rank Ideas PDF
The purpose of this slide is to outline mobile search engine optimization SEO reporting dashboard. It covers different metrics such as web traffic overview, total views, content overview, goal value and conversion etc. If you are looking for a format to display your unique thoughts, then the professionally designed Top SEO Techniques Seo Reporting Dashboard To Evaluate Website Rank Ideas PDF is the one for you. You can use it as a Google Slides template or a PowerPoint template. Incorporate impressive visuals, symbols, images, and other charts. Modify or reorganize the text boxes as you desire. Experiment with shade schemes and font pairings. Alter, share or cooperate with other people on your work. Download Top SEO Techniques Seo Reporting Dashboard To Evaluate Website Rank Ideas PDF and find out how to give a successful presentation. Present a perfect display to your team and make your presentation unforgettable.
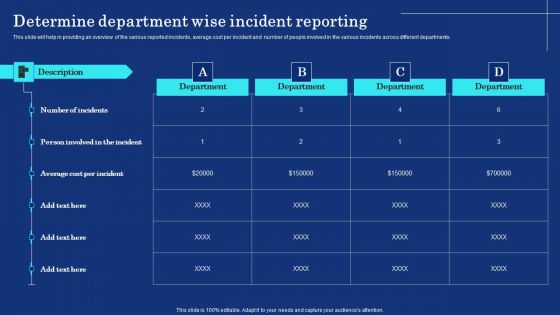
Organizational Assets Security Management Strategy Determine Department Wise Incident Reporting Guidelines PDF
This slide will help in providing an overview of the various reported incidents, average cost per incident and number of people involved in the various incidents across different departments. Do you have to make sure that everyone on your team knows about any specific topic I yes, then you should give Organizational Assets Security Management Strategy Determine Department Wise Incident Reporting Guidelines PDF a try. Our experts have put a lot of knowledge and effort into creating this impeccable Organizational Assets Security Management Strategy Determine Department Wise Incident Reporting Guidelines PDF. You can use this template for your upcoming presentations, as the slides are perfect to represent even the tiniest detail. You can download these templates from the Slidegeeks website and these are easy to edit. So grab these today.

IT System Risk Management Guide Enterprise IT Risk Management Reporting Dashboard Formats PDF
This slide highlights the enterprise information technology risk management reporting dashboard which includes risk rating breakdown risk heat map, action plan breakdown and thresholds. From laying roadmaps to briefing everything in detail, our templates are perfect for you. You can set the stage with your presentation slides. All you have to do is download these easy to edit and customizable templates. IT System Risk Management Guide Enterprise IT Risk Management Reporting Dashboard Formats PDF will help you deliver an outstanding performance that everyone would remember and praise you for. Do download this presentation today.
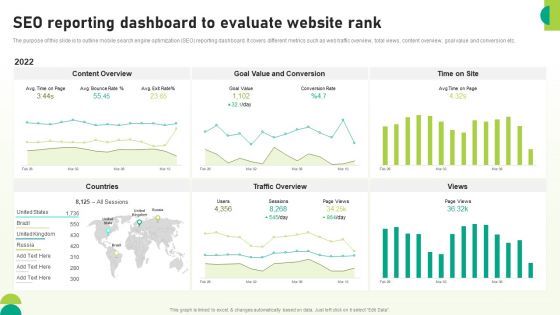
Utilizing SEO To Boost Customer SEO Reporting Dashboard To Evaluate Website Rank Background PDF
The purpose of this slide is to outline mobile search engine optimization SEO reporting dashboard. It covers different metrics such as web traffic overview, total views, content overview, goal value and conversion etc. Take your projects to the next level with our ultimate collection of Utilizing SEO To Boost Customer SEO Reporting Dashboard To Evaluate Website Rank Background PDF. Slidegeeks has designed a range of layouts that are perfect for representing task or activity duration, keeping track of all your deadlines at a glance. Tailor these designs to your exact needs and give them a truly corporate look with your own brand colors theyll make your projects stand out from the rest.

Table Of Contents For Financial Reporting To Analyze Enterprises Monetary Performance Rules PDF
This Table Of Contents For Financial Reporting To Analyze Enterprises Monetary Performance Rules PDF is perfect for any presentation, be it in front of clients or colleagues. It is a versatile and stylish solution for organizing your meetings. The Table Of Contents For Financial Reporting To Analyze Enterprises Monetary Performance Rules PDF features a modern design for your presentation meetings. The adjustable and customizable slides provide unlimited possibilities for acing up your presentation. Slidegeeks has done all the homework before launching the product for you. So, dont wait, grab the presentation templates today.
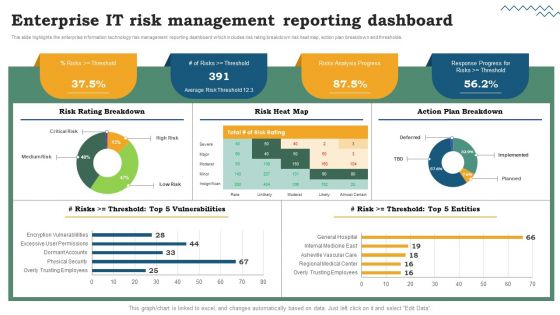
Risk Evaluation Of Information Technology Systems Enterprise IT Risk Management Reporting Dashboard Formats PDF
This slide highlights the enterprise information technology risk management reporting dashboard which includes risk rating breakdown risk heat map, action plan breakdown and thresholds. From laying roadmaps to briefing everything in detail, our templates are perfect for you. You can set the stage with your presentation slides. All you have to do is download these easy-to-edit and customizable templates. Risk Evaluation Of Information Technology Systems Enterprise IT Risk Management Reporting Dashboard Formats PDF will help you deliver an outstanding performance that everyone would remember and praise you for. Do download this presentation today.
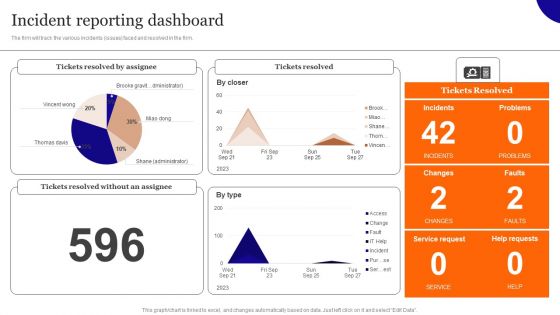
Overview On Mitigating Workplace IT Threats Incident Reporting Dashboard Professional PDF
The firm will track the various incidents issues faced and resolved in the firm. Do you have to make sure that everyone on your team knows about any specific topic I yes, then you should give Overview On Mitigating Workplace IT Threats Incident Reporting Dashboard Professional PDF a try. Our experts have put a lot of knowledge and effort into creating this impeccable Overview On Mitigating Workplace IT Threats Incident Reporting Dashboard Professional PDF. You can use this template for your upcoming presentations, as the slides are perfect to represent even the tiniest detail. You can download these templates from the Slidegeeks website and these are easy to edit. So grab these today

Lean Operational Excellence Strategy Accounting And Reporting For Manufacturing Unit Demonstration PDF
This slide showcases the accounting measures to track improvement in operational, capacity and financial of manufacturing plant with lean and kaizen model. Key accounting heads included here are output per employee, on-time delivery, productivity level, sales revenue etc. Pitch your topic with ease and precision using this Lean Operational Excellence Strategy Accounting And Reporting For Manufacturing Unit Demonstration PDF. This layout presents information on Operational Level, Efficiency Level, Financial Level. It is also available for immediate download and adjustment. So, changes can be made in the color, design, graphics or any other component to create a unique layout.

Organizations Risk Management And IT Security Top IT Risks Reported At The Workplace Brochure PDF
This slide highlights the top IT risks reported at workplace which includes cyber threats, data loss, social engineering attacks, regulatory incidents, domain based threats and denial of service. Slidegeeks has constructed Organizations Risk Management And IT Security Top IT Risks Reported At The Workplace Brochure PDF after conducting extensive research and examination. These presentation templates are constantly being generated and modified based on user preferences and critiques from editors. Here, you will find the most attractive templates for a range of purposes while taking into account ratings and remarks from users regarding the content. This is an excellent jumping off point to explore our content and will give new users an insight into our top notch PowerPoint Templates.

Medical Reports With Injection For Clinical Trial Phases New Clinical Drug Trial Process Slides PDF
If you are looking for a format to display your unique thoughts, then the professionally designed Medical Reports With Injection For Clinical Trial Phases New Clinical Drug Trial Process Slides PDF is the one for you. You can use it as a Google Slides template or a PowerPoint template. Incorporate impressive visuals, symbols, images, and other charts. Modify or reorganize the text boxes as you desire. Experiment with shade schemes and font pairings. Alter, share or cooperate with other people on your work. Download Medical Reports With Injection For Clinical Trial Phases New Clinical Drug Trial Process Slides PDF and find out how to give a successful presentation. Present a perfect display to your team and make your presentation unforgettable.

Customer Credit Reporting Company Outline Revenue And Dividend Per Share Pictures PDF
This slide highlights the Experian revenue and dividend per share which includes revenue, benchmark EBIT and EBIT margin, Benchmark earning per share and divided per share. This Customer Credit Reporting Company Outline Revenue And Dividend Per Share Pictures PDF is perfect for any presentation, be it in front of clients or colleagues. It is a versatile and stylish solution for organizing your meetings. The Customer Credit Reporting Company Outline Revenue And Dividend Per Share Pictures PDF features a modern design for your presentation meetings. The adjustable and customizable slides provide unlimited possibilities for acing up your presentation. Slidegeeks has done all the homework before launching the product for you. So, do not wait, grab the presentation templates today
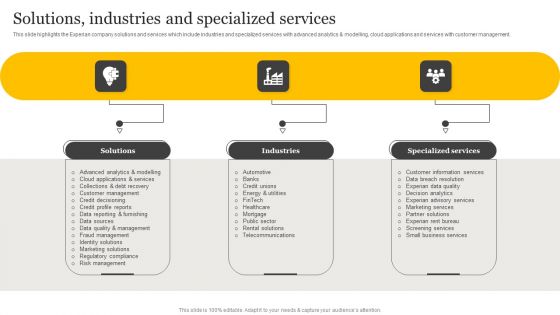
Customer Credit Reporting Company Outline Solutions Industries And Specialized Services Demonstration PDF
This slide highlights the Experian company solutions and services which include industries and specialized services with advanced analytics and modelling, cloud applications and services with customer management. Are you searching for a Customer Credit Reporting Company Outline Solutions Industries And Specialized Services Demonstration PDF that is uncluttered, straightforward, and original Its easy to edit, and you can change the colors to suit your personal or business branding. For a presentation that expresses how much effort you have put in, this template is ideal. With all of its features, including tables, diagrams, statistics, and lists, its perfect for a business plan presentation. Make your ideas more appealing with these professional slides. Download Customer Credit Reporting Company Outline Solutions Industries And Specialized Services Demonstration PDF from Slidegeeks today.

The Digital Project Managers Defining Various Categories Of Data Analytics And Reporting Tools
The purpose of the mentioned slide is to showcase different types of data analytics tools that enhance the project-related tasks. It includes Microsoft Excel, Tableau, Business Intelligence, and custom dashboards. If your project calls for a presentation, then Slidegeeks is your go-to partner because we have professionally designed, easy-to-edit templates that are perfect for any presentation. After downloading, you can easily edit The Digital Project Managers Defining Various Categories Of Data Analytics And Reporting Tools and make the changes accordingly. You can rearrange slides or fill them with different images. Check out all the handy templates
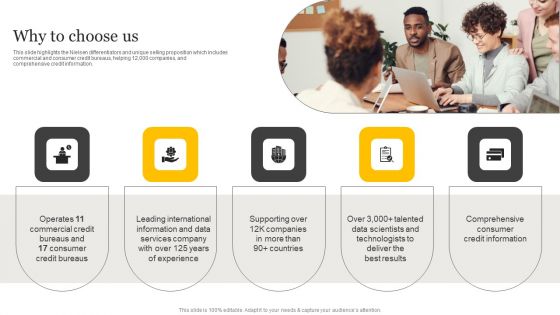
Customer Credit Reporting Company Outline Why To Choose Us Diagrams PDF
This slide highlights the Nielsen differentiators and unique selling proposition which includes commercial and consumer credit bureaus, helping 12,000 companies, and comprehensive credit information. Slidegeeks has constructed Customer Credit Reporting Company Outline Why To Choose Us Diagrams PDF after conducting extensive research and examination. These presentation templates are constantly being generated and modified based on user preferences and critiques from editors. Here, you will find the most attractive templates for a range of purposes while taking into account ratings and remarks from users regarding the content. This is an excellent jumping off point to explore our content and will give new users an insight into our top notch PowerPoint Templates.

Financial Reporting To Analyze Gross Margin And Cost Of Sales By Product Brochure PDF
This slides shows the gross margin and cost of goods sold which includes total products with actual and forecasted gross margin and cost of sales, etc. From laying roadmaps to briefing everything in detail, our templates are perfect for you. You can set the stage with your presentation slides. All you have to do is download these easy-to-edit and customizable templates. Financial Reporting To Analyze Gross Margin And Cost Of Sales By Product Brochure PDF will help you deliver an outstanding performance that everyone would remember and praise you for. Do download this presentation today.
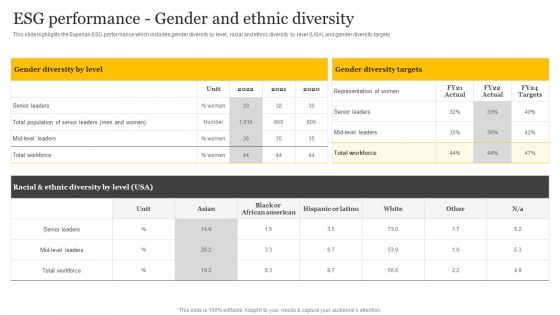
Customer Credit Reporting Company Outline ESG Performance Gender And Ethnic Diversity Structure PDF
This slide highlights the Experian ESG performance which includes gender diversity by level, racial and ethnic diversity by level USA and gender diversity targets. If your project calls for a presentation, then Slidegeeks is your go to partner because we have professionally designed, easy to edit templates that are perfect for any presentation. After downloading, you can easily edit Customer Credit Reporting Company Outline ESG Performance Gender And Ethnic Diversity Structure PDF and make the changes accordingly. You can rearrange slides or fill them with different images. Check out all the handy templates
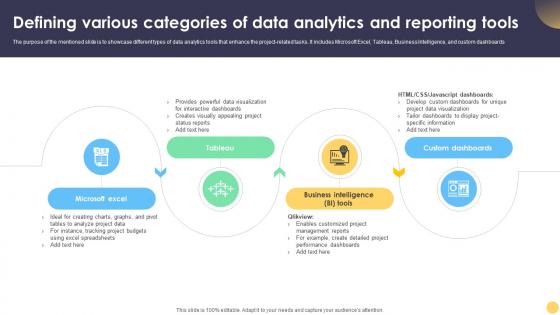
Digital Project Management Strategies Defining Various Categories Of Data Analytics And Reporting
The purpose of the mentioned slide is to showcase different types of data analytics tools that enhance the project-related tasks. It includes Microsoft Excel, Tableau, Business Intelligence, and custom dashboards. Slidegeeks is here to make your presentations a breeze with Digital Project Management Strategies Defining Various Categories Of Data Analytics And Reporting With our easy-to-use and customizable templates, you can focus on delivering your ideas rather than worrying about formatting. With a variety of designs to choose from, you are sure to find one that suits your needs. And with animations and unique photos, illustrations, and fonts, you can make your presentation pop. So whether you are giving a sales pitch or presenting to the board, make sure to check out Slidegeeks first

Current State Gap Analysis Strategy For Process Optimization Diagrams PDF
This slide illustrates gap between current state and desired state of an organization with required action plan. It includes focus areas like data quality, reporting, analysis, process etc. Presenting Current State Gap Analysis Strategy For Process Optimization Diagrams PDF to dispense important information. This template comprises five stages. It also presents valuable insights into the topics including Data Quality, Reporting, Analysis. This is a completely customizable PowerPoint theme that can be put to use immediately. So, download it and address the topic impactfully.

Erp For Deriving Real Time Analytics And Reporting Erp And Digital Transformation For Maximizing DT SS V
This slide showcases the key features of ERP and how it helps in effective business decision-making through real-time analytics and reporting. It includes data integration, live data connectivity, and interactive reports.Retrieve professionally designed Erp For Deriving Real Time Analytics And Reporting Erp And Digital Transformation For Maximizing DT SS V to effectively convey your message and captivate your listeners. Save time by selecting pre-made slideshows that are appropriate for various topics, from business to educational purposes. These themes come in many different styles, from creative to corporate, and all of them are easily adjustable and can be edited quickly. Access them as PowerPoint templates or as Google Slides themes. You do not have to go on a hunt for the perfect presentation because Slidegeeks got you covered from everywhere.

Best Practices For Reporting Data Mining Results Using Data Mining Tools To Optimize Processes AI SS V
This slide showcases general overview on reporting data mining results to key stakeholders of business. It provides details about know your audience, tell a story, choose right medium and solicit feedback. From laying roadmaps to briefing everything in detail, our templates are perfect for you. You can set the stage with your presentation slides. All you have to do is download these easy-to-edit and customizable templates. Best Practices For Reporting Data Mining Results Using Data Mining Tools To Optimize Processes AI SS V will help you deliver an outstanding performance that everyone would remember and praise you for. Do download this presentation today.

Workplace Portable Device Monitoring And Administration Determine Incident Reporting By Mobile Devices In Different Departments Diagrams PDF
This slide will help in providing an overview of the various reported incidents, average cost per incident and number of people involved in the various incidents across different IT departments. Do you have to make sure that everyone on your team knows about any specific topic I yes, then you should give Workplace Portable Device Monitoring And Administration Determine Incident Reporting By Mobile Devices In Different Departments Diagrams PDF a try. Our experts have put a lot of knowledge and effort into creating this impeccable Workplace Portable Device Monitoring And Administration Determine Incident Reporting By Mobile Devices In Different Departments Diagrams PDF. You can use this template for your upcoming presentations, as the slides are perfect to represent even the tiniest detail. You can download these templates from the Slidegeeks website and these are easy to edit. So grab these today.
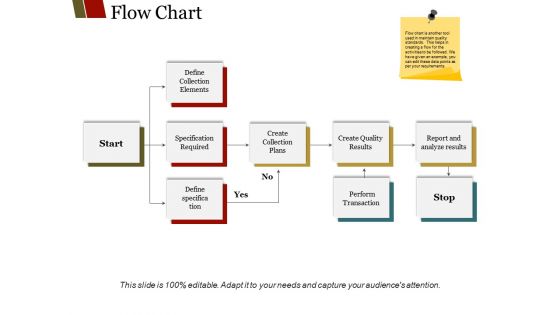
Flow Chart Ppt PowerPoint Presentation Infographic Template
This is a flow chart ppt powerpoint presentation infographic template. This is a four stage process. The stages in this process are define collection elements, specification required, create collection plans, create quality results, report and analyze results.

Contract Lifecycle Example Diagram Presentation Deck
This is a contract lifecycle example diagram presentation deck. This is a eight stage process. The stages in this process are create, risk management, execute, reporting, quality, approve, incident reporting and analysis, exit.
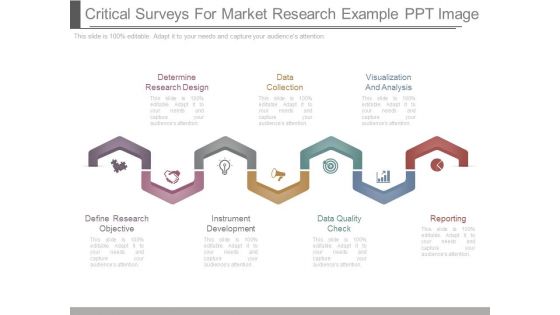
Critical Surveys For Market Research Example Ppt Image
This is a critical surveys for market research example ppt image. This is a seven stage process. The stages in this process are determine research design, data collection, visualization and analysis, define research objective, instrument development, data quality check, reporting.

Business Intelligence Solution Success Criteria BI Transformation Toolset Summary PDF
The following slide indicates the factors that ensure the worth of the BI suite in order to achieve business objectives. The key parameters are report relevance, data quality and speed of report delivery. Presenting Business Intelligence Solution Success Criteria BI Transformation Toolset Summary PDF to provide visual cues and insights. Share and navigate important information on five stages that need your due attention. This template can be used to pitch topics like Data Quality, Interactivity, Report Relevance, Speed Of Report Delivery, Security. In addtion, this PPT design contains high resolution images, graphics, etc, that are easily editable and available for immediate download.
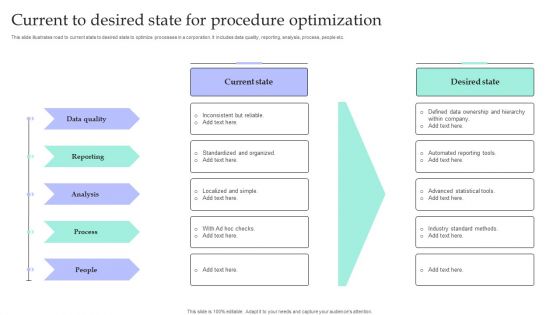
Current To Desired State For Procedure Optimization Information PDF
This slide illustrates road to current state to desired state to optimize processes in a corporation. It includes data quality, reporting, analysis, process, people etc.Pitch your topic with ease and precision using this Current To Desired State For Procedure Optimization Information PDF. This layout presents information on Standardized Organized, Localized Simple, Industry Standard Methods. It is also available for immediate download and adjustment. So, changes can be made in the color, design, graphics or any other component to create a unique layout.

Present Vs Future State With Process And People Ppt PowerPoint Presentation Model Show PDF
Presenting present vs future state with process and people ppt powerpoint presentation model show pdf to dispense important information. This template comprises two stages. It also presents valuable insights into the topics including present state, future state, data quality, reporting, analysis, process, people. This is a completely customizable PowerPoint theme that can be put to use immediately. So, download it and address the topic impactfully.

Fabricating Strategies Ppt Layout Sample Of Ppt Presentation
This is a Fabricating Strategies Ppt Layout Sample Of Ppt Presentation. This is a six stage process. The stages in this process are material and resource planning, production, order reporting, quality assurance, logistics, receipts and return.

Comparing Lean Operational Excellence Strategy Manufacturing Kpis With Competitors Mockup PDF
This slide showcases manufacturing KPIs comparison of company with competitors from the industry. Key KPIs included here are total cycle time, time for changeovers, capacity utilization, suppliers quality, reportable incidents, equipment efficiency etc. Pitch your topic with ease and precision using this Comparing Lean Operational Excellence Strategy Manufacturing Kpis With Competitors Mockup PDF. This layout presents information on Parameters, Rejection Rate, Quality. It is also available for immediate download and adjustment. So, changes can be made in the color, design, graphics or any other component to create a unique layout.
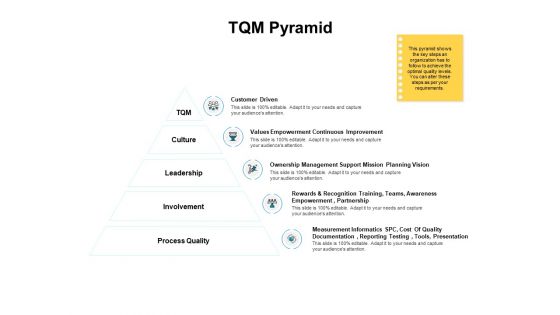
TQM Pyramid Ppt PowerPoint Presentation Layouts Backgrounds
Presenting this set of slides with name tqm pyramid ppt powerpoint presentation layouts backgrounds. This is a five stage process. The stages in this process are tqm, culture, leadership, involvement, process quality, customer driven, values empowerment continuous improvement, ownership management support mission planning vision, rewards recognition training, teams, awareness empowerment, partnership, measurement informatics spc, cost quality documentation, reporting testing, tools, presentation. This is a completely editable PowerPoint presentation and is available for immediate download. Download now and impress your audience.
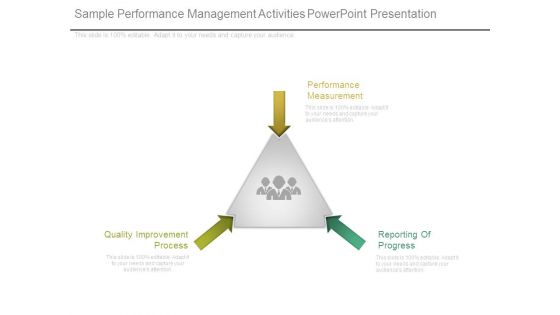
Sample Performance Management Activities Powerpoint Presentation
This is a sample performance management activities powerpoint presentation. This is a four stage process. The stages in this process are quality improvement process, performance measurement, reporting of progress.
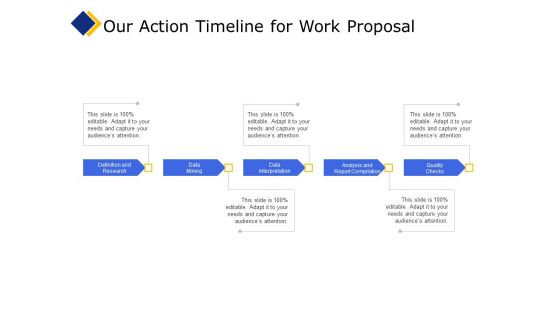
Business Our Action Timeline For Work Proposal Ppt Infographic Template Design Ideas PDF
Presenting this set of slides with name business our action timeline for work proposal ppt infographic template design ideas pdf. This is a five stage process. The stages in this process are definition and research, data mining, data interpretation, analysis and report compilation, quality checks. This is a completely editable PowerPoint presentation and is available for immediate download. Download now and impress your audience.

Business Your Investment For Work Proposal Ppt Summary Styles PDF
Presenting this set of slides with name business your investment for work proposal ppt summary styles pdf. The topics discussed in these slides are definition and research, data mining, data interpretation, analysis and report compilation, quality checks. This is a completely editable PowerPoint presentation and is available for immediate download. Download now and impress your audience.

Mind Mapping For Project QA Plan Ppt PowerPoint Presentation Gallery Shapes PDF
This slide covers the mind map that helps in developing project quality management plan which includes inputs, tools and outputs such as project charter, data collection, quality metrics, reports, testing, inspection, verifying deliverables, conducting meetings, etc. Persuade your audience using this mind mapping for project qa plan ppt powerpoint presentation gallery shapes pdf. This PPT design covers three stages, thus making it a great tool to use. It also caters to a variety of topics including plan quality management, manage quality, control quality. Download this PPT design now to present a convincing pitch that not only emphasizes the topic but also showcases your presentation skills.

Web Business Market Research Example Powerpoint Slides
This is a web business market research example powerpoint slides. This is a four stage process. The stages in this process are company profile and rating, portfolio reviews and screening, comparative performance reports, alert service, public intuitions, sector studies, company data, media report dollar ngo data, quality and peer reviews, company feedback, analysis, research.
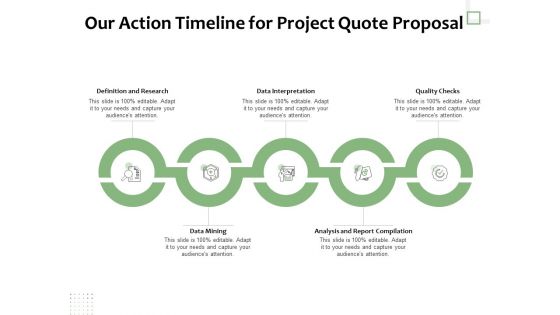
Project Estimate Our Action Timeline For Project Quote Proposal Ppt Inspiration Design Templates PDF
Presenting this set of slides with name project estimate our action timeline for project quote proposal ppt inspiration design templates pdf. This is a five stage process. The stages in this process are data interpretation, quality checks, data mining, analysis, report compilation. This is a completely editable PowerPoint presentation and is available for immediate download. Download now and impress your audience.
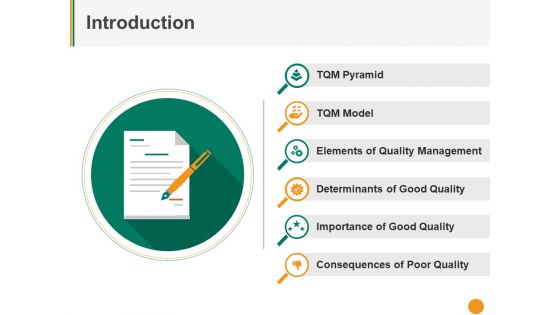
Introduction Ppt PowerPoint Presentation Pictures Template
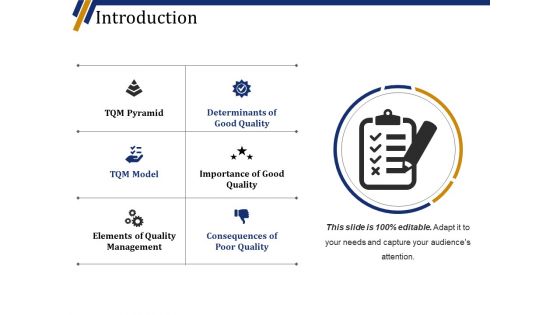
This is a introduction ppt powerpoint presentation pictures template. This is a six stage process. The stages in this process are elements of quality management, determinants of good quality, importance of good quality, consequences of poor quality, tqm model.
Introduction Ppt PowerPoint Presentation Inspiration Graphic Tips
This is a introduction ppt powerpoint presentation inspiration graphic tips. This is a six stage process. The stages in this process are determinants of good quality, importance of good quality, consequences of poor quality, elements of quality management, tqm model.

Cost Management System Diagram Ppt Slide Show
This is a cost management system diagram ppt slide show. This is a seven stage process. The stages in this process are research and development, quality control, marketing, financial accounting, production reporting, inventory management, production planning and scheduling, cost accounting.

It Benchmarking Solutions Diagram Powerpoint Slide Background
This is a it benchmarking solutions diagram powerpoint slide background. This is a six stage process. The stages in this process are initiation, data gathering, meeting quality standards, meeting customers expectations, benchmark report, action plan.

Data Management Process Automation To Reduce Organizational Operating Cost Pictures PDF
Following slide provide insight about automation of data management process for reducing reporting errors. It includes components such as data quality, automated data integration, automated reporting and master data management.Showcasing this set of slides titled Data Management Process Automation To Reduce Organizational Operating Cost Pictures PDF. The topics addressed in these templates are Data Quality, Data Integration, Automated Reporting, Master Data Management. All the content presented in this PPT design is completely editable. Download it and make adjustments in color, background, font etc. as per your unique business setting.
Time Management Techniques For Successful Project Identify Task Dependencies In Project Management Themes PDF
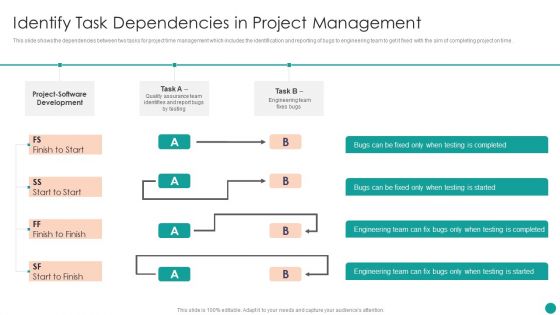
This slide shows the dependencies between two tasks for project time management which includes the identification and reporting of bugs to engineering team to get it fixed with the aim of completing project on time.Deliver an awe inspiring pitch with this creative TTime Management Techniques For Successful Project Identify Task Dependencies In Project Management Themes PDF bundle. Topics like Software Development, Quality Assurance, Identifies Report can be discussed with this completely editable template. It is available for immediate download depending on the needs and requirements of the user.
How Data Stewardship Related To Data Governance Data Custodianship Portrait Pdf
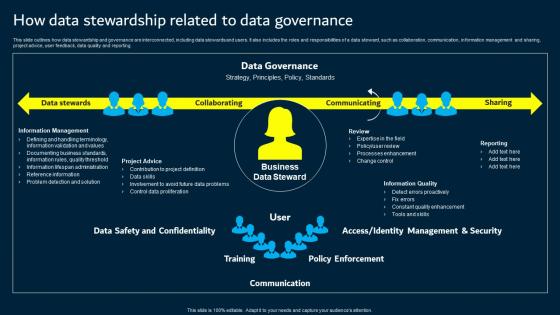
This slide outlines how data stewardship and governance are interconnected, including data stewards and users. It also includes the roles and responsibilities of a data steward, such as collaboration, communication, information management and sharing, project advice, user feedback, data quality and reporting. If your project calls for a presentation, then Slidegeeks is your go to partner because we have professionally designed, easy to edit templates that are perfect for any presentation. After downloading, you can easily edit How Data Stewardship Related To Data Governance Data Custodianship Portrait Pdf and make the changes accordingly. You can rearrange slides or fill them with different images. Check out all the handy templates

Building Engineering Services Proposal Proposal Sign Off For Architecture And Construction Services Proposal Rules PDF
Presenting this set of slides with name building engineering services proposal proposal sign off for architecture and construction services proposal rules pdf. The topics discussed in these slides are project management, design, reporting, supervision, quality assurance. This is a completely editable PowerPoint presentation and is available for immediate download. Download now and impress your audience.

 Home
Home