Project Management Dashboard

And Diverging 8 Step Circular Process Relative Cycle Arrow PowerPoint Templates
We present our and diverging 8 step circular process Relative Cycle Arrow PowerPoint templates.Download and present our Process and flows PowerPoint Templates because you require care and diligence to function well. Download and present our Flow charts PowerPoint Templates because it helps to prove the viability of your ideas to help your organisation to achieve the quality and success required. Present our Arrows PowerPoint Templates because you will be able to Highlight the various ways in which we can maintain its efficiency. Download and present our Circle charts PowerPoint Templates because you are aware of some pitfalls ahead where you need to be cautious not to overrun and avoid a stall. Download our Ring charts PowerPoint Templates because you can Show them the way, be Captain of the ship and lead them to new shores.Use these PowerPoint slides for presentations relating to Business, chart, circle, colors, concept, corporate, cycle, data, design, detail, development, diagram, engineering, graphic, ideas, illustration, image, implement, implementation, life, lifecycle, management, model, objects, organization, plan, process, product, professional, project, quality, schema, shape, stack, stage, steps, strategy, structure, success, symbol. The prominent colors used in the PowerPoint template are Gray, Black, White. You can be sure our and diverging 8 step circular process Relative Cycle Arrow PowerPoint templates are Pleasant. Presenters tell us our concept PowerPoint templates and PPT Slides provide you with a vast range of viable options. Select the appropriate ones and just fill in your text. We assure you our and diverging 8 step circular process Relative Cycle Arrow PowerPoint templates are Nice. Customers tell us our design PowerPoint templates and PPT Slides are Clever. Presenters tell us our and diverging 8 step circular process Relative Cycle Arrow PowerPoint templates are Versatile. You can be sure our data PowerPoint templates and PPT Slides are Whimsical.

For A Free Business PowerPoint Templates Flow Chart Circular Process Slides
We present our for a free business powerpoint templates flow chart Circular Process Slides.Download our Ring Charts PowerPoint Templates because it is inspired by the indelible Olympic logo this graphic exemplifies the benefits of teamwork. Use our Shapes PowerPoint Templates because this slide demonstrates how they contribute to the larger melting pot. Download and present our Circle Charts PowerPoint Templates because it unravels the process layer by layer and exposes their relevance to the core issue. Download our Business PowerPoint Templates because you are sure you have the right people for your plans. Download our Process and Flows PowerPoint Templates because it unravels the process layer by layer and exposes their relevance to the core issue.Use these PowerPoint slides for presentations relating to Business,chart, circle, colors, concept,contemporary, corporate, cycle, data,design, detail, development, diagram, engineering, graphic, ideas,illustration, implement, implementation,management, model, modern,organization, phase, plan, process,product, professional, project, quality,schema, set, software, stack, stage, steps, strategy, success, system, tag, team. The prominent colors used in the PowerPoint template are Purple, Gray, Black. Customers tell us our for a free business powerpoint templates flow chart Circular Process Slides are Excellent. Customers tell us our data PowerPoint templates and PPT Slides are the best it can get when it comes to presenting. Customers tell us our for a free business powerpoint templates flow chart Circular Process Slides are Fashionable. People tell us our data PowerPoint templates and PPT Slides are Radiant. Customers tell us our for a free business powerpoint templates flow chart Circular Process Slides are Youthful. Customers tell us our colors PowerPoint templates and PPT Slides will save the presenter time.
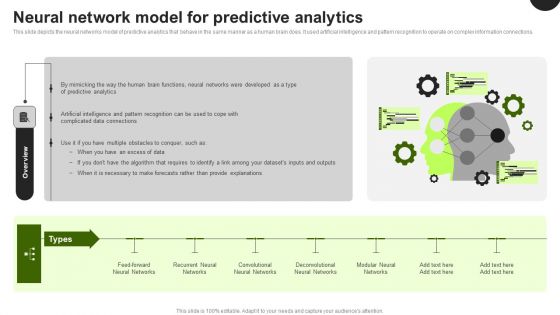
Predictive Analytics In The Age Of Big Data Neural Network Model For Predictive Analytics Demonstration PDF
This slide depicts the neural networks model of predictive analytics that behave in the same manner as a human brain does. It used artificial intelligence and pattern recognition to operate on complex information connections. Do you have an important presentation coming up Are you looking for something that will make your presentation stand out from the rest Look no further than Predictive Analytics In The Age Of Big Data Neural Network Model For Predictive Analytics Demonstration PDF. With our professional designs, you can trust that your presentation will pop and make delivering it a smooth process. And with Slidegeeks, you can trust that your presentation will be unique and memorable. So why wait Grab Predictive Analytics In The Age Of Big Data Neural Network Model For Predictive Analytics Demonstration PDF today and make your presentation stand out from the rest.
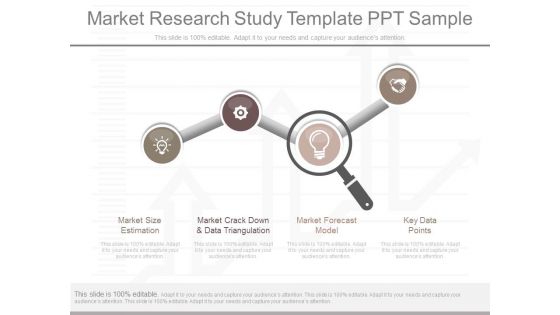
Market Research Study Template Ppt Sample
This is a market research study template ppt sample. This is a four stage process. The stages in this process are market size estimation, market crack down and data triangulation, market forecast model, key data points.

For A Free Business PowerPoint Templates Flow Chart Ppt Circular Process Slides
We present our for a free business powerpoint templates flow chart ppt Circular Process Slides.Present our Circle Charts PowerPoint Templates because Our PowerPoint Templates and Slides will let you meet your Deadlines. Use our Ring Charts PowerPoint Templates because this PPt slide highlights any anticipated problems, shortfalls or weak areas. Present our Process and Flows PowerPoint Templates because this helps in epitomised the values of teamwork. Use our Shapes PowerPoint Templates because it Creates a winner with your passion and dream. Download our Business PowerPoint Templates because infrastructure growth is an obvious requirement of today.inform your group on how exactly this potential is tailor made for you.Use these PowerPoint slides for presentations relating to Business,chart, circle, colors, concept,contemporary, corporate, cycle, data,design, detail, development, diagram, engineering, graphic, ideas,illustration, implement, implementation,management, model, modern,organization, phase, plan, process,product, professional, project, quality,schema, set, software, stack, stage, steps, strategy, success, system, tag, team. The prominent colors used in the PowerPoint template are Purple, White, Gray. Customers tell us our for a free business powerpoint templates flow chart ppt Circular Process Slides are Functional. Customers tell us our cycle PowerPoint templates and PPT Slides are Multicolored. Customers tell us our for a free business powerpoint templates flow chart ppt Circular Process Slides are Bold. People tell us our concept PowerPoint templates and PPT Slides will make the presenter look like a pro even if they are not computer savvy. Customers tell us our for a free business powerpoint templates flow chart ppt Circular Process Slides are Awesome. Customers tell us our contemporary PowerPoint templates and PPT Slides are second to none.
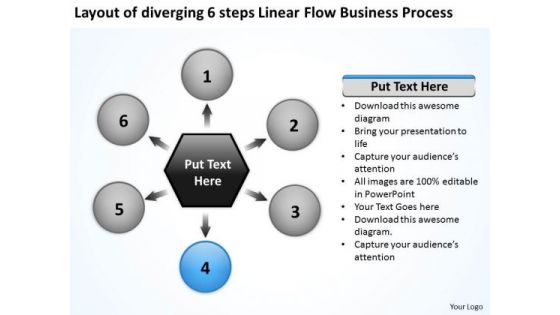
Linear Flow World Business PowerPoint Templates Process Gear
We present our linear flow world business powerpoint templates process Gear.Use our Ring Charts PowerPoint Templates because the chart is designed to give you the flavour of the kind of tools you may need and the work that is performed in the lifecycle. Download our Flow charts PowerPoint Templates because Our PowerPoint Templates and Slides will generate and maintain the level of interest you desire. They will create the impression you want to imprint on your audience. Use our Circle charts PowerPoint Templates because you can put down your ideas and present them using our innovative templates. Present our Process and Flows PowerPoint Templates because this diagram helps you to discuss each step slowly but surely move up the pyramid narrowing down to the best and most success oriented project. Download our Arrows PowerPoint Templates because visual appeal is a priority for us.Use these PowerPoint slides for presentations relating to Communication,competition, development, diagram,direction, element, finance, financial,forward, graphic, growth, guide,increase, investment, leader, leadership,management, marketing, motion,moving, organization, path, plan,presentation, price, profit, progress,report, representation, shape, sign,stakeholder, success, symbol, target,team, teamwork. The prominent colors used in the PowerPoint template are Blue, Black, Gray. People tell us our linear flow world business powerpoint templates process Gear are Bright. Customers tell us our finance PowerPoint templates and PPT Slides are Nostalgic. Professionals tell us our linear flow world business powerpoint templates process Gear are Ritzy. Presenters tell us our forward PowerPoint templates and PPT Slides will help them to explain complicated concepts. Use our linear flow world business powerpoint templates process Gear help you meet deadlines which are an element of today's workplace. Just browse and pick the slides that appeal to your intuitive senses. Presenters tell us our financial PowerPoint templates and PPT Slides are Elevated.

10 Stages Converging Business PowerPoint Theme Process Radial Chart Slides
We present our 10 stages converging business powerpoint theme process Radial Chart Slides.Use our Arrows PowerPoint Templates because they help to lay the base of your trend of thought. Use our Flow charts PowerPoint Templates because this template with an image of helps you chart the course of your presentation. Download and present our Business PowerPoint Templates because the majestic tiger lord of all it surveys.It exudes power even when it is in repose. Present our Process and Flows PowerPoint Templates because you can Take your team along by explaining your plans. Present our Circle charts PowerPoint Templates because it is the time to bond with family, friends, colleagues and any other group of your choice.Use these PowerPoint slides for presentations relating to Business, chart, circle, colors, concept, corporate, cycle, data, design, detail, development, diagram, engineering, graphic, ideas, illustration, image, implement, implementation, life, lifecycle, management, model, objects, organization, plan, process, product, professional, project, quality, schema, shape, stack, stage, steps, strategy, structure, success, symbol. The prominent colors used in the PowerPoint template are Yellow, Black, Gray. You can be sure our 10 stages converging business powerpoint theme process Radial Chart Slides are Luxuriant. Presenters tell us our corporate PowerPoint templates and PPT Slides are effectively colour coded to prioritise your plans They automatically highlight the sequence of events you desire. We assure you our 10 stages converging business powerpoint theme process Radial Chart Slides are Efficient. Customers tell us our data PowerPoint templates and PPT Slides are One-of-a-kind. Presenters tell us our 10 stages converging business powerpoint theme process Radial Chart Slides are Stunning. You can be sure our cycle PowerPoint templates and PPT Slides are Lush.

10 Stages Converging Business Process Circular Flow Diagram PowerPoint Slides
We present our 10 stages converging business process Circular Flow Diagram PowerPoint Slides.Download and present our Arrows PowerPoint Templates because they enhance the essence of your viable ideas. Download and present our Flow charts PowerPoint Templates because this slide can help to bullet point your views. Download our Business PowerPoint Templates because it will demonstrate the strength of character under severe stress. Shine the torch ahead and bring the light to shine on all. Present our Process and Flows PowerPoint Templates because you are aware of some pitfalls ahead where you need to be cautious not to overrun and avoid a stall. Download and present our Circle charts PowerPoint Templates because you have what it takes to grow.Use these PowerPoint slides for presentations relating to Business, chart, circle, colors, concept, corporate, cycle, data, design, detail, development, diagram, engineering, graphic, ideas, illustration, image, implement, implementation, life, lifecycle, management, model, objects, organization, plan, process, product, professional, project, quality, schema, shape, stack, stage, steps, strategy, structure, success, symbol. The prominent colors used in the PowerPoint template are Yellow, Black, White. You can be sure our 10 stages converging business process Circular Flow Diagram PowerPoint Slides have awesome images to get your point across. Presenters tell us our data PowerPoint templates and PPT Slides are Beautiful. We assure you our 10 stages converging business process Circular Flow Diagram PowerPoint Slides are Delightful. Customers tell us our corporate PowerPoint templates and PPT Slides will impress their bosses and teams. Presenters tell us our 10 stages converging business process Circular Flow Diagram PowerPoint Slides are Perfect. You can be sure our corporate PowerPoint templates and PPT Slides will impress their bosses and teams.

10 Stages Converging Business Process Cycle Chart PowerPoint Slides
We present our 10 stages converging business process Cycle Chart PowerPoint Slides.Use our Arrows PowerPoint Templates because there are various viable propositions available to further your commercial interests. Download our Flow charts PowerPoint Templates because you have developed a vision of where you want to be a few years from now. Download our Business PowerPoint Templates because you are ready to flap your wings and launch off. All poised are you to touch the sky with glory. Present our Process and Flows PowerPoint Templates because this is An innovative slide design depicting driving home the relevance of a steady rhythm. Present our Circle charts PowerPoint Templates because you watch them slowly start to savour the flavour you have served them.Use these PowerPoint slides for presentations relating to Business, chart, circle, colors, concept, corporate, cycle, data, design, detail, development, diagram, engineering, graphic, ideas, illustration, image, implement, implementation, life, lifecycle, management, model, objects, organization, plan, process, product, professional, project, quality, schema, shape, stack, stage, steps, strategy, structure, success, symbol. The prominent colors used in the PowerPoint template are Yellow, White, Gray. You can be sure our 10 stages converging business process Cycle Chart PowerPoint Slides are Swanky. Presenters tell us our corporate PowerPoint templates and PPT Slides are Classic. We assure you our 10 stages converging business process Cycle Chart PowerPoint Slides are One-of-a-kind. Customers tell us our data PowerPoint templates and PPT Slides are Bold. Presenters tell us our 10 stages converging business process Cycle Chart PowerPoint Slides are Handsome. You can be sure our circle PowerPoint templates and PPT Slides are Festive.
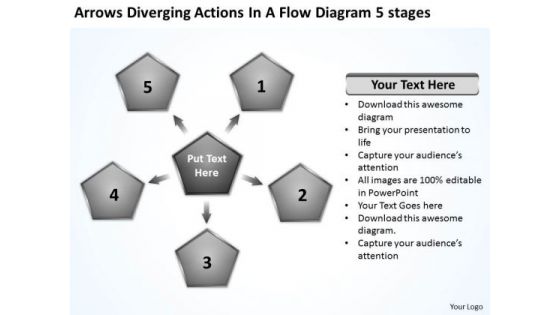
Actions In Flow Diagram 5 Stages Circular Layout Network PowerPoint Templates
We present our actions in flow diagram 5 stages Circular Layout Network PowerPoint templates.Use our Business PowerPoint Templates because spell out your advertising plans to increase market share. The feedback has been positive and productive. Download our Marketing PowerPoint Templates because networking is an imperative in todays world. You need to access the views of others. Similarly you need to give access to them of your abilities. Download our Future PowerPoint Templates because analyse your plans with equal sincerity. Download and present our Process and Flows PowerPoint Templates because it helps to churn the mixture to the right degree and pound home your views and expectations in a spectacularly grand and virtuoso fluid performance. Download our Marketing PowerPoint Templates because our PowerPoint templates designed for your ideas to sell.Use these PowerPoint slides for presentations relating to Action, adding, arrow, business, chart,circulation, communication, connection,conservation, cycle, data, design,direction, element, flow, flowchart, graph,graphic, group, icon, illustration, isolated,label, loop, management, network,orientation, planning, process, project,recycling, repeat, repetition, return,reuse, rotation, sign, sticker, strategy,symbol. The prominent colors used in the PowerPoint template are Gray, White, Black. You can be sure our actions in flow diagram 5 stages Circular Layout Network PowerPoint templates are Versatile. Professionals tell us our connection PowerPoint templates and PPT Slides are Ritzy. PowerPoint presentation experts tell us our actions in flow diagram 5 stages Circular Layout Network PowerPoint templates are the best it can get when it comes to presenting. You can be sure our business PowerPoint templates and PPT Slides are specially created by a professional team with vast experience. They diligently strive to come up with the right vehicle for your brilliant Ideas. You can be sure our actions in flow diagram 5 stages Circular Layout Network PowerPoint templates are Spiffy. The feedback we get is that our business PowerPoint templates and PPT Slides are Classic.

10 Diverging Stages Planning Process Diagram Circular Flow PowerPoint Templates
We present our 10 diverging stages planning process diagram Circular Flow PowerPoint templates.Download our Ring Charts PowerPoint Templates because they help to focus the thoughts of your listeners. Download and present our Flow charts PowerPoint Templates because you have a handle on all the targets, a master of the game, the experienced and consummate juggler. Download our Process and flows PowerPoint Templates because it Creates a winner with your passion and dream. Download our Business PowerPoint Templates because you have churned your mind and come upwith solutions. Download our Arrows PowerPoint Templates because with the help of our Slides you can Illustrate these thoughts with this slide.Use these PowerPoint slides for presentations relating to Business, chart, circle, colors, concept, corporate, cycle, data, design, detail, development, diagram, engineering, graphic, ideas, illustration, image, implement, implementation, life, lifecycle, management, model, objects, organization, process, product, professional, project, quality, schema, shape, steps, strategy, structure, success, symbol. The prominent colors used in the PowerPoint template are Blue light, Black, White. You can be sure our 10 diverging stages planning process diagram Circular Flow PowerPoint templates are Reminiscent. Presenters tell us our circle PowerPoint templates and PPT Slides have awesome images to get your point across. We assure you our 10 diverging stages planning process diagram Circular Flow PowerPoint templates are Versatile. Customers tell us our circle PowerPoint templates and PPT Slides will make the presenter successul in his career/life. Presenters tell us our 10 diverging stages planning process diagram Circular Flow PowerPoint templates are Dynamic. You can be sure our circle PowerPoint templates and PPT Slides are Tranquil.
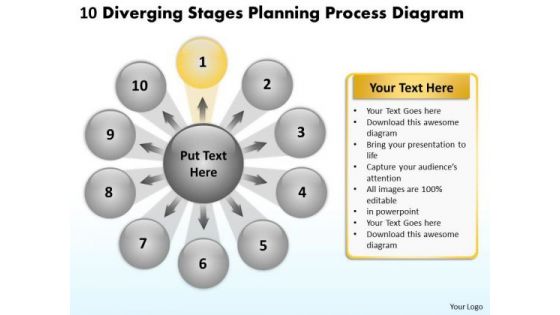
10 Diverging Stages Planning Process Diagram Radial Chart PowerPoint Templates
We present our 10 diverging stages planning process diagram Radial Chart PowerPoint templates.Present our Arrows PowerPoint Templates because you can Show them how to churn out fresh ideas. Present our Flow charts PowerPoint Templates because you can see In any endeavour people matter most. Download our Business PowerPoint Templates because this template helps you to grab the attention of your listeners. Use our Process and Flows PowerPoint Templates because you can enlighten your skills with the help of our topical templates. Download and present our Circle charts PowerPoint Templates because you have the plans ready for them to absorb and understand.Use these PowerPoint slides for presentations relating to Business, chart, circle, colors, concept, corporate, cycle, data, design, detail, development, diagram, engineering, graphic, ideas, illustration, image, implement, implementation, life, lifecycle, management, model, objects, organization, plan, process, product, professional, project, quality, schema, shape, stack, stage, steps, strategy, structure, success, symbol. The prominent colors used in the PowerPoint template are Purple, Black, Gray. You can be sure our 10 diverging stages planning process diagram Radial Chart PowerPoint templates are Efficacious. Presenters tell us our corporate PowerPoint templates and PPT Slides are Dazzling. We assure you our 10 diverging stages planning process diagram Radial Chart PowerPoint templates help you meet deadlines which are an element of today's workplace. Just browse and pick the slides that appeal to your intuitive senses. Customers tell us our circle PowerPoint templates and PPT Slides are Nifty. Presenters tell us our 10 diverging stages planning process diagram Radial Chart PowerPoint templates are Beautiful. You can be sure our corporate PowerPoint templates and PPT Slides are Attractive.

10 Stages Converging Business Process Cycle Layout Diagram PowerPoint Templates
We present our 10 stages converging business process Cycle Layout Diagram PowerPoint templates.Present our Arrows PowerPoint Templates because this is a good example of the strength of teamwork. Use our Flow charts PowerPoint Templates because it gives you really bright ideas. Download and present our Business PowerPoint Templates because maximising sales of your product is the intended destination. Present our Process and Flows PowerPoint Templates because it demonstrates the seeds of many of our successes. Download our Circle charts PowerPoint Templates because it expound on why you have discarded some plans as you went along to the apex and came out with the final selection which you know will make you and your team shine.Use these PowerPoint slides for presentations relating to Business, chart, circle, colors, concept, corporate, cycle, data, design, detail, development, diagram, engineering, graphic, ideas, illustration, image, implement, implementation, life, lifecycle, management, model, objects, organization, plan, process, product, professional, project, quality, schema, shape, stack, stage, steps, strategy, structure, success, symbol. The prominent colors used in the PowerPoint template are Blue, White, Black. You can be sure our 10 stages converging business process Cycle Layout Diagram PowerPoint templates are topically designed to provide an attractive backdrop to any subject. Presenters tell us our colors PowerPoint templates and PPT Slides are Energetic. We assure you our 10 stages converging business process Cycle Layout Diagram PowerPoint templates will save the presenter time. Customers tell us our corporate PowerPoint templates and PPT Slides are Splendid. Presenters tell us our 10 stages converging business process Cycle Layout Diagram PowerPoint templates are Handsome. You can be sure our circle PowerPoint templates and PPT Slides are Cheerful.

Data Evaluation And Processing Toolkit Data Analytics Program Checklist Inspiration PDF
This slide shows progress status of data analytics process which includes important key tasks that must be performed while initiating a project. If you are looking for a format to display your unique thoughts, then the professionally designed Data Evaluation And Processing Toolkit Data Analytics Program Checklist Inspiration PDF is the one for you. You can use it as a Google Slides template or a PowerPoint template. Incorporate impressive visuals, symbols, images, and other charts. Modify or reorganize the text boxes as you desire. Experiment with shade schemes and font pairings. Alter, share or cooperate with other people on your work. Download Data Evaluation And Processing Toolkit Data Analytics Program Checklist Inspiration PDF and find out how to give a successful presentation. Present a perfect display to your team and make your presentation unforgettable.
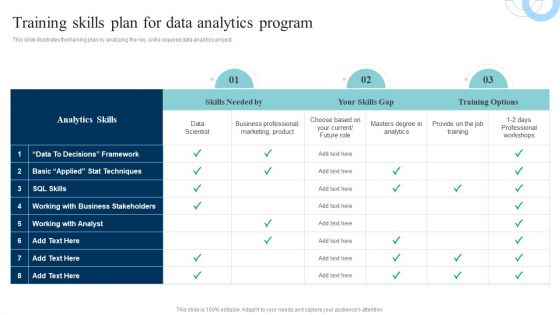
Data Evaluation And Processing Toolkit Training Skills Plan For Data Analytics Program Download PDF
This slide illustrates the training plan by analyzing the key skills required data analytics project. Formulating a presentation can take up a lot of effort and time, so the content and message should always be the primary focus. The visuals of the PowerPoint can enhance the presenters message, so our Data Evaluation And Processing Toolkit Training Skills Plan For Data Analytics Program Download PDF was created to help save time. Instead of worrying about the design, the presenter can concentrate on the message while our designers work on creating the ideal templates for whatever situation is needed. Slidegeeks has experts for everything from amazing designs to valuable content, we have put everything into Data Evaluation And Processing Toolkit Training Skills Plan For Data Analytics Program Download PDF.
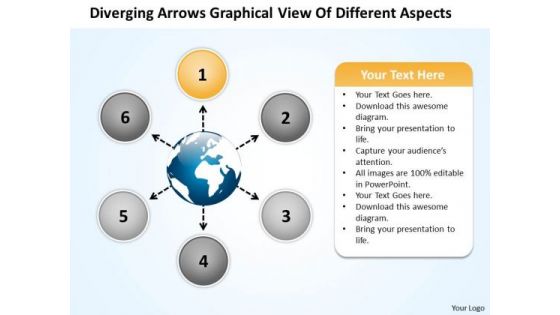
Arrows Graphical View Of Different Aspects Circular Circular Network PowerPoint Templates
We present our arrows graphical view of different aspects circular Circular Network PowerPoint templates.Download our Globe PowerPoint Templates because the colour coding of our templates are specifically designed to highlight you points. Use our Ring Charts PowerPoint Templates because you have it all down to a nicety, slice by slice, layer by layer. Download our Circle Charts PowerPoint Templates because you have the process in your head, our template design showing will illuminate your thoughts. Download our Business PowerPoint Templates because you can see clearly through to the bigger bowl ahead. Time your jump to perfection and hit the nail on the head. Download our Shapes PowerPoint Templates because it have all to represent to your viewers.Use these PowerPoint slides for presentations relating to Business, chart, circle,colors, concept, corporate, cycle, data,design, detail, development, diagram,engineering, graphic, ideas, illustration,image, implement, implementation, life,lifecycle, management, model, objects,organization, phase, plan, process,product, professional, project, quality,schema, shape. The prominent colors used in the PowerPoint template are Gray, Black, White. You can be sure our arrows graphical view of different aspects circular Circular Network PowerPoint templates will make the presenter successul in his career/life. PowerPoint presentation experts tell us our cycle PowerPoint templates and PPT Slides are Beautiful. Professionals tell us our arrows graphical view of different aspects circular Circular Network PowerPoint templates are Tranquil. Presenters tell us our circle PowerPoint templates and PPT Slides will save the presenter time. Professionals tell us our arrows graphical view of different aspects circular Circular Network PowerPoint templates are Appealing. Customers tell us our design PowerPoint templates and PPT Slides are Glamorous.
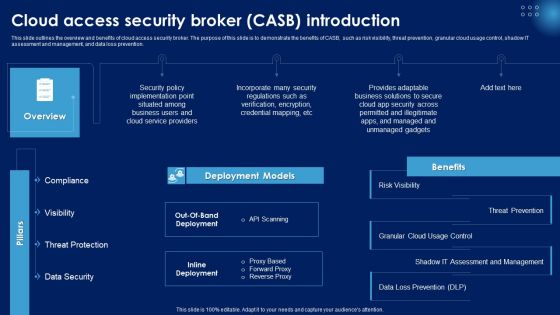
Cloud Access Security Broker CASB Introduction Ppt PowerPoint Presentation File Portfolio PDF
This slide outlines the overview and benefits of cloud access security broker. The purpose of this slide is to demonstrate the benefits of CASB, such as risk visibility, threat prevention, granular cloud usage control, shadow IT assessment and management, and data loss prevention. Here you can discover an assortment of the finest PowerPoint and Google Slides templates. With these templates, you can create presentations for a variety of purposes while simultaneously providing your audience with an eye catching visual experience. Download Cloud Access Security Broker CASB Introduction Ppt PowerPoint Presentation File Portfolio PDF to deliver an impeccable presentation. These templates will make your job of preparing presentations much quicker, yet still, maintain a high level of quality. Slidegeeks has experienced researchers who prepare these templates and write high quality content for you. Later on, you can personalize the content by editing the Cloud Access Security Broker CASB Introduction Ppt PowerPoint Presentation File Portfolio PDF.
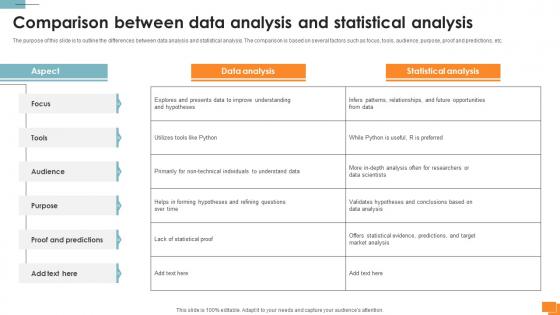
Statistical Tools For Evidence Comparison Between Data Analysis And Statistical Analysis
The purpose of this slide is to outline the differences between data analysis and statistical analysis. The comparison is based on several factors such as focus, tools, audience, purpose, proof and predictions, etc. Find highly impressive Statistical Tools For Evidence Comparison Between Data Analysis And Statistical Analysis on Slidegeeks to deliver a meaningful presentation. You can save an ample amount of time using these presentation templates. No need to worry to prepare everything from scratch because Slidegeeks experts have already done a huge research and work for you. You need to download Statistical Tools For Evidence Comparison Between Data Analysis And Statistical Analysis for your upcoming presentation. All the presentation templates are 100 percent editable and you can change the color and personalize the content accordingly. Download now
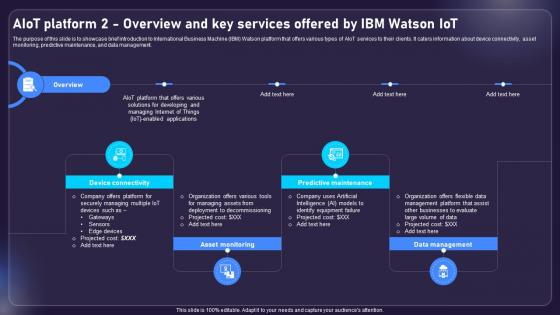
AIOT Applications For Various Industries AIOT Platform 2 Overview And Key Services Offered IoT SS V
The purpose of this slide is to showcase brief introduction to International Business Machine IBM Watson platform that offers various types of AIoT services to their clients. It caters information about device connectivity, asset monitoring, predictive maintenance, and data management. Boost your pitch with our creative AIOT Applications For Various Industries AIOT Platform 2 Overview And Key Services Offered IoT SS V. Deliver an awe-inspiring pitch that will mesmerize everyone. Using these presentation templates you will surely catch everyones attention. You can browse the ppts collection on our website. We have researchers who are experts at creating the right content for the templates. So you do not have to invest time in any additional work. Just grab the template now and use them.
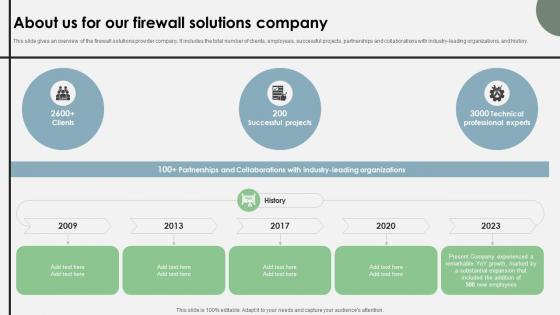
About Us For Our Firewall Solutions Company Cloud Security Firewall Proposal
This slide gives an overview of the firewall solutions provider company. It includes the total number of clients, employees, successful projects, partnerships and collaborations with industry-leading organizations, and history.Elevate your presentations with our intuitive About Us For Our Firewall Solutions Company Cloud Security Firewall Proposal template. Whether you are delivering a pitch, sharing data, or presenting ideas, our visually-stunning single-slide PPT template is the perfect tool to captivate your audience. With 100 percent editable features and a user-friendly interface, creating professional presentations has never been easier. Download now and leave a lasting impression.

Strategies For Reducing Cybersecurity Risks In ABS Healthcare Company Ppt Professional Mockup PDF
This slide shows strategies that can be adopted by the company in order to minimize the cybersecurity risks and increasing malware attacks. Some strategies are data encryption, proper employee training, protection of physical devices, use df latest and updated softwares etc. This is a strategies for reducing cybersecurity risks in ABS healthcare company ppt professional mockup pdf template with various stages. Focus and dispense information on five stages using this creative set, that comes with editable features. It contains large content boxes to add your information on topics like data management, operating system maintenance, financial, protect devices that can be physically accessed. You can also showcase facts, figures, and other relevant content using this PPT layout. Grab it now.

New Business PowerPoint Presentation Process Circular Flow Network Slides
We present our new business powerpoint presentation process Circular Flow Network Slides.Download and present our Circle Charts PowerPoint Templates because the colour coding of our templates are specifically designed to highlight you points. Download and present our Arrows PowerPoint Templates because you can Trigger audience minds with your interesting ideas. Present our Business PowerPoint Templates because a lot of dissimilar elements needing to gel to strike the deal. Use our Shapes PowerPoint Templates because this slide brings grey areas to the table and explain in detail you assessment of the need for care to ensure continued smooth progress. Present our Flow Charts PowerPoint Templates because you can Raise your Company stocks at the Opening Bell.Use these PowerPoint slides for presentations relating to achievement, adding, analyzing, arrow, art, background, blank, blue, business, chart, colorful, cycle, data, design, diagram, element, flow, graph, graphic, gray, green, icon, linear, management, market, numbers, orange, percent, process, project, red, round, stock, success, up, value, wheel, white. The prominent colors used in the PowerPoint template are Blue, Red, pink. Customers tell us our new business powerpoint presentation process Circular Flow Network Slides are Enchanting. PowerPoint presentation experts tell us our business PowerPoint templates and PPT Slides are Bright. People tell us our new business powerpoint presentation process Circular Flow Network Slides are topically designed to provide an attractive backdrop to any subject. People tell us our arrow PowerPoint templates and PPT Slides are Nostalgic. Customers tell us our new business powerpoint presentation process Circular Flow Network Slides are Efficacious. People tell us our blank PowerPoint templates and PPT Slides are Endearing.
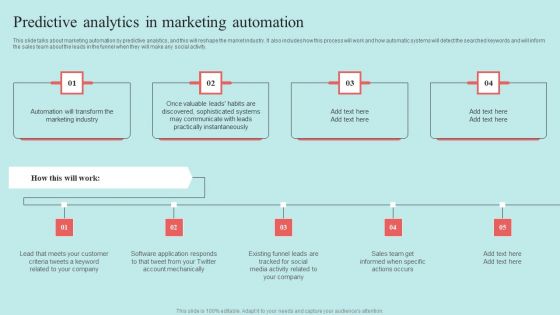
Predictive Data Model Predictive Analytics In Marketing Automation Demonstration PDF

Metrics That Communicate The Efficiency And Effectiveness Of Business Impacting Services Ppt Ideas Grid PDF
This template covers the set of KPIs that most effectively represent the efficiency and effectiveness business contribution of the documented business impacting services, apps, or projects. Presenting metrics that communicate the efficiency and effectiveness of business impacting services ppt ideas grid pdf to provide visual cues and insights. Share and navigate important information on four stages that need your due attention. This template can be used to pitch topics like service level, application, revenue, cost efficiency, risk. In addtion, this PPT design contains high resolution images, graphics, etc, that are easily editable and available for immediate download.
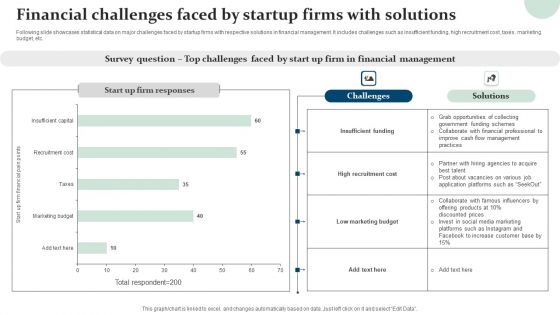
Financial Challenges Faced By Startup Firms With Solutions Slides PDF
Following slide showcases statistical data on major challenges faced by startup firms with respective solutions in financial management. It includes challenges such as insufficient funding, high recruitment cost, taxes, marketing budget, etc. Pitch your topic with ease and precision using this Financial Challenges Faced By Startup Firms With Solutions Slides PDF. This layout presents information on Insufficient Funding, High Recruitment Cost, Low Marketing Budget. It is also available for immediate download and adjustment. So, changes can be made in the color, design, graphics or any other component to create a unique layout.

AIOT Platform 2 Overview And Key Services Offered AIOT Applications For Various Industries IoT SS V
The purpose of this slide is to showcase brief introduction to International Business Machine IBM Watson platform that offers various types of AIoT services to their clients. It caters information about device connectivity, asset monitoring, predictive maintenance, and data management. Want to ace your presentation in front of a live audience Our AIOT Platform 2 Overview And Key Services Offered AIOT Applications For Various Industries IoT SS V can help you do that by engaging all the users towards you. Slidegeeks experts have put their efforts and expertise into creating these impeccable powerpoint presentations so that you can communicate your ideas clearly. Moreover, all the templates are customizable, and easy-to-edit and downloadable. Use these for both personal and commercial use.
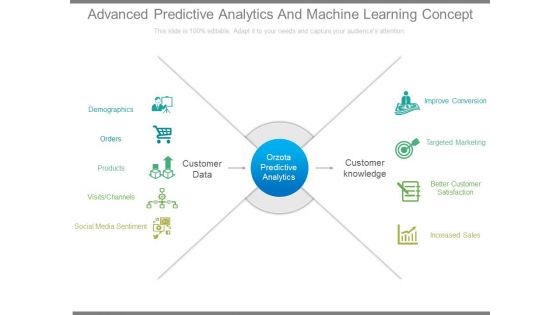
Advanced Predictive Analytics And Machine Learning Concept
This is a advanced predictive analytics and machine learning concept. This is a nine stage process. The stages in this process are demographics, orders, products, visits channels, social media sentiment, customer data, orzota predictive analytics, customer knowledge, improve conversion, targeted marketing, better customer satisfaction, increased sales.
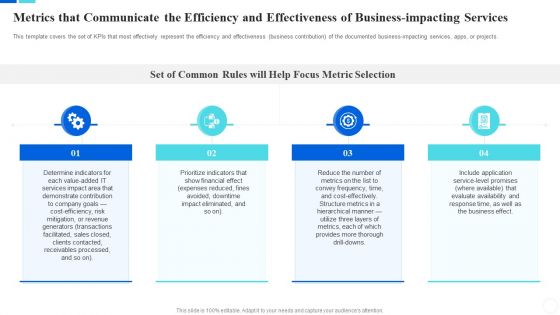
Communicate Company Value To Your Stakeholders Metrics That Communicate The Efficiency Download PDF
This template covers the set of KPIs that most effectively represent the efficiency and effectiveness business contribution of the documented business-impacting services, apps, or projects. This is a communicate company value to your stakeholders metrics that communicate the efficiency download pdf template with various stages. Focus and dispense information on four stages using this creative set, that comes with editable features. It contains large content boxes to add your information on topics like determine, services, financial, expenses, reduce. You can also showcase facts, figures, and other relevant content using this PPT layout. Grab it now.

Strategic Plan For Enterprise Key Benefits Of Software Implementation In Organization Introduction PDF
This slide represents the importance of software implementation in automating manual processes and increasing efficiency of work. It includes benefits of software implementation such as improves cost-efficiency, advanced data management, better analysis and forecasting etc. Are you in need of a template that can accommodate all of your creative concepts This one is crafted professionally and can be altered to fit any style. Use it with Google Slides or PowerPoint. Include striking photographs, symbols, depictions, and other visuals. Fill, move around, or remove text boxes as desired. Test out color palettes and font mixtures. Edit and save your work, or work with colleagues. Download Strategic Plan For Enterprise Key Benefits Of Software Implementation In Organization Introduction PDF and observe how to make your presentation outstanding. Give an impeccable presentation to your group and make your presentation unforgettable.

Transformation Toolkit Competitive Intelligence Information Analysis Key Features Of Predictive Data Analytics Software Elements PDF
This slide represents the characteristics of predictive data analytics software. It includes features like predictive modeling, predictive scoring and data mining functions that help companies to get better insights. This Transformation Toolkit Competitive Intelligence Information Analysis Key Features Of Predictive Data Analytics Software Elements PDF is perfect for any presentation, be it in front of clients or colleagues. It is a versatile and stylish solution for organizing your meetings. The Transformation Toolkit Competitive Intelligence Information Analysis Key Features Of Predictive Data Analytics Software Elements PDF features a modern design for your presentation meetings. The adjustable and customizable slides provide unlimited possibilities for acing up your presentation. Slidegeeks has done all the homework before launching the product for you. So, do not wait, grab the presentation templates today.
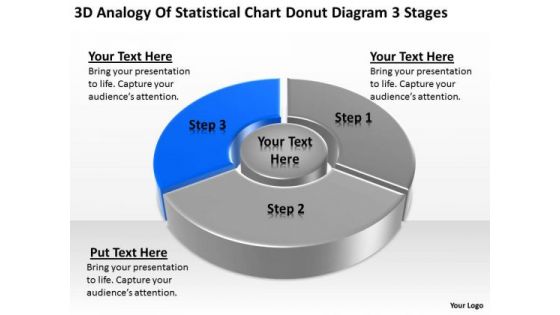
Statistical Chart Donut Diagram 3 Stages Ppt Samples Business Plan PowerPoint Slides
We present our statistical chart donut diagram 3 stages ppt samples business plan PowerPoint Slides.Download our Finance PowerPoint Templates because you should Experience excellence with our PowerPoint Templates and Slides. They will take your breath away. Present our Marketing PowerPoint Templates because our bewitching PowerPoint Templates and Slides will delight your audience with the magic of your words. Use our Sales PowerPoint Templates because You have gained great respect for your brilliant ideas. Use our PowerPoint Templates and Slides to strengthen and enhance your reputation. Download our Business PowerPoint Templates because You have a driving passion to excel in your field. Our PowerPoint Templates and Slides will prove ideal vehicles for your ideas. Download our Success PowerPoint Templates because You should Kick up a storm with our PowerPoint Templates and Slides. The heads of your listeners will swirl with your ideas.Use these PowerPoint slides for presentations relating to Chart, Business, Data, Donut, Market, Sales, Document, Economy, Display, Bar, Corporate, Income, Concept, Success, Presentation, Symbol, Diagram, Percentage, Graphic, Finance, Stock, Clean, Analysis, Report, Marketing, Accounting, Management, Graph, Colors, Forecast, Design, Growth, Competition, Progress, Profit, Information, Background, Trade, Investment, Statistic, Financial. The prominent colors used in the PowerPoint template are Blue, Gray, Black.
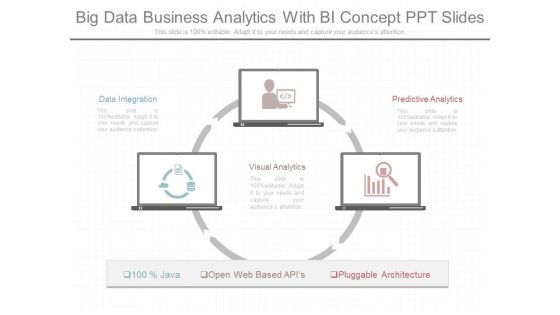
Big Data Business Analytics With Bi Concept Ppt Slides
This is a big data business analytics with bi concept ppt slides. This is a three stage process. The stages in this process are data integration, visual analytics, predictive analytics, open web based apis, pluggable architecture, java.

Comparative Assessment Of Predictive Developing Strategic Insights Using Big Data Analytics SS V
This slide showcases comparison of predictive analytics software used for data discovery and driving business outcomes. It provides information regarding software, features, price, free trial and user ratings. This Comparative Assessment Of Predictive Developing Strategic Insights Using Big Data Analytics SS V is perfect for any presentation, be it in front of clients or colleagues. It is a versatile and stylish solution for organizing your meetings. The Comparative Assessment Of Predictive Developing Strategic Insights Using Big Data Analytics SS V features a modern design for your presentation meetings. The adjustable and customizable slides provide unlimited possibilities for acing up your presentation. Slidegeeks has done all the homework before launching the product for you. So, do not wait, grab the presentation templates today

Strategic Planning And Budgeting Process Example Of Ppt
This is a strategic planning and budgeting process example of ppt. This is a five stage process. The stages in this process are budget development, strategic planning, evaluation, execution, control.

Predictive Analytics In The Age Of Big Data Uses Of Predictive Analytics Underwriting Sample PDF
This slide represents the application of predictive analytics in underwriting by insurance companies. Predictive analytics help them identify future claims by analyzing policyholders historical data patterns and existing risk collection. Do you have an important presentation coming up Are you looking for something that will make your presentation stand out from the rest Look no further than Predictive Analytics In The Age Of Big Data Uses Of Predictive Analytics Underwriting Sample PDF. With our professional designs, you can trust that your presentation will pop and make delivering it a smooth process. And with Slidegeeks, you can trust that your presentation will be unique and memorable. So why wait Grab Predictive Analytics In The Age Of Big Data Uses Of Predictive Analytics Underwriting Sample PDF today and make your presentation stand out from the rest.
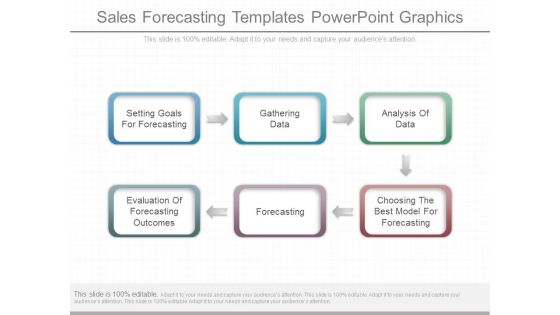
Sales Forecasting Templates Powerpoint Graphics
This is a sales forecasting templates powerpoint graphics. This is a six stage process. The stages in this process are setting goals for forecasting, gathering data, analysis of data, evaluation of forecasting outcomes, forecasting, choosing the best model for forecasting.
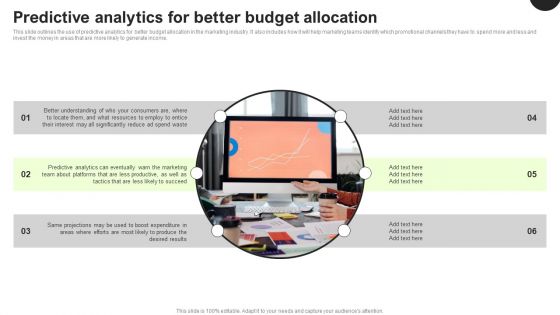
Predictive Analytics In The Age Of Big Data Predictive Analytics For Better Budget Allocation Inspiration PDF
This slide outlines the use of predictive analytics for better budget allocation in the marketing industry. It also includes how it will help marketing teams identify which promotional channels they have to spend more and less and invest the money in areas that are more likely to generate income. Make sure to capture your audiences attention in your business displays with our gratis customizable Predictive Analytics In The Age Of Big Data Predictive Analytics For Better Budget Allocation Inspiration PDF. These are great for business strategies, office conferences, capital raising or task suggestions. If you desire to acquire more customers for your tech business and ensure they stay satisfied, create your own sales presentation with these plain slides.

CASB 2 0 IT Cloud Access Security Broker CASB Introduction
This slide outlines the overview and benefits of cloud access security broker. The purpose of this slide is to demonstrate the benefits of CASB, such as risk visibility, threat prevention, granular cloud usage control, shadow IT assessment and management, and data loss prevention. This CASB 2 0 IT Cloud Access Security Broker CASB Introduction is perfect for any presentation, be it in front of clients or colleagues. It is a versatile and stylish solution for organizing your meetings. The CASB 2 0 IT Cloud Access Security Broker CASB Introduction features a modern design for your presentation meetings. The adjustable and customizable slides provide unlimited possibilities for acing up your presentation. Slidegeeks has done all the homework before launching the product for you. So, do not wait, grab the presentation templates today
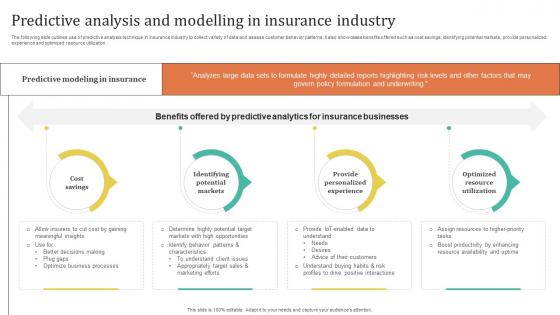
Improving Customer Satisfaction Predictive Analysis And Modelling In Insurance Industry
The following slide outlines use of predictive analysis technique in insurance industry to collect variety of data and assess customer behavior patterns. It also showcases benefits offered such as cost savings, identifying potential markets, provide personalized experience and optimized resource utilization. Slidegeeks is here to make your presentations a breeze with Improving Customer Satisfaction Predictive Analysis And Modelling In Insurance Industry With our easy-to-use and customizable templates, you can focus on delivering your ideas rather than worrying about formatting. With a variety of designs to choose from, you are sure to find one that suits your needs. And with animations and unique photos, illustrations, and fonts, you can make your presentation pop. So whether you are giving a sales pitch or presenting to the board, make sure to check out Slidegeeks first
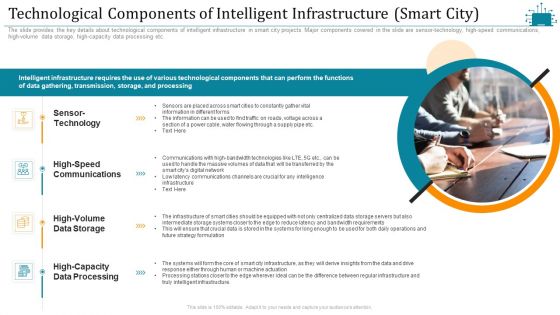
Cloud Intelligence Framework For Application Consumption Technological Components Of Intelligent Infrastructure Smart City Clipart PDF
The slide provides the key details about technological components of intelligent infrastructure in smart city projects. Major components covered in the slide are sensor-technology, high-speed communications, high-volume data storage, high-capacity data processing etc. Presenting cloud intelligence framework for application consumption technological components of intelligent infrastructure smart city clipart pdf to provide visual cues and insights. Share and navigate important information on four stages that need your due attention. This template can be used to pitch topics like data processing, communications, sensor technology, strategy formulation, processing stations. In addtion, this PPT design contains high resolution images, graphics, etc, that are easily editable and available for immediate download.
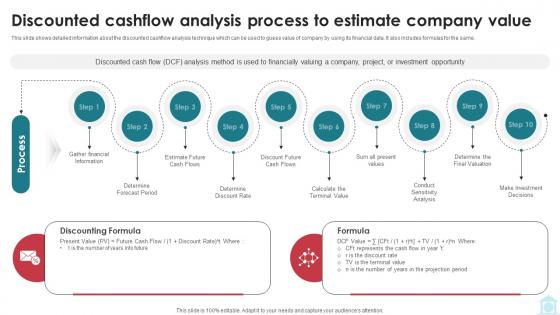
Discounted Cashflow Analysis Process To Estimate Mastering Investment Banking Fin SS V
This slide shows detailed information about the discounted cashflow analysis technique which can be used to guess value of company by using its financial data. It also includes formulas for the same. Make sure to capture your audiences attention in your business displays with our gratis customizable Discounted Cashflow Analysis Process To Estimate Mastering Investment Banking Fin SS V These are great for business strategies, office conferences, capital raising or task suggestions. If you desire to acquire more customers for your tech business and ensure they stay satisfied, create your own sales presentation with these plain slides.
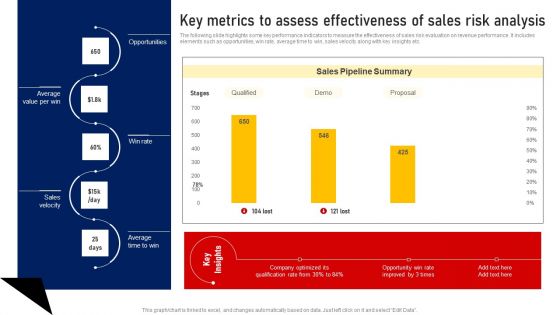
Performing Sales Risk Analysis Procedure Key Metrics To Assess Effectiveness Of Sales Risk Analysis Brochure PDF
The following slide highlights some key performance indicators to measure the effectiveness of sales risk evaluation on revenue performance. It includes elements such as opportunities, win rate, average time to win, sales velocity along with key insights etc. Get a simple yet stunning designed Performing Sales Risk Analysis Procedure Key Metrics To Assess Effectiveness Of Sales Risk Analysis Brochure PDF. It is the best one to establish the tone in your meetings. It is an excellent way to make your presentations highly effective. So, download this PPT today from Slidegeeks and see the positive impacts. Our easy to edit Performing Sales Risk Analysis Procedure Key Metrics To Assess Effectiveness Of Sales Risk Analysis Brochure PDF can be your go to option for all upcoming conferences and meetings. So, what are you waiting for Grab this template today.

Donut Chart For Business Development 4 Stages Plan Excel PowerPoint Templates
We present our donut chart for business development 4 stages plan excel PowerPoint templates.Download our Finance PowerPoint Templates because Our PowerPoint Templates and Slides are created by a hardworking bunch of busybees. Always flitting around with solutions gauranteed to please. Present our Marketing PowerPoint Templates because Our PowerPoint Templates and Slides team portray an attitude of elegance. Personify this quality by using them regularly. Download and present our Shapes PowerPoint Templates because Our PowerPoint Templates and Slides are innately eco-friendly. Their high recall value negate the need for paper handouts. Download our Business PowerPoint Templates because It will mark the footprints of your journey. Illustrate how they will lead you to your desired destination. Download and present our Process and Flows PowerPoint Templates because Our PowerPoint Templates and Slides will provide you a launch platform. Give a lift off to your ideas and send them into orbit.Use these PowerPoint slides for presentations relating to chart, business, data, donut, market, sales, document, economy, display, bar, corporate, income, concept, success, presentation, symbol, diagram, percentage, graphic, finance, stock, clean, analysis, report, marketing, accounting, management, graph, forecast, design, growth, competition, progress, profit, information, background, trade, investment, statistic, financial, infographics, 3d. The prominent colors used in the PowerPoint template are Yellow, Green, Blue.
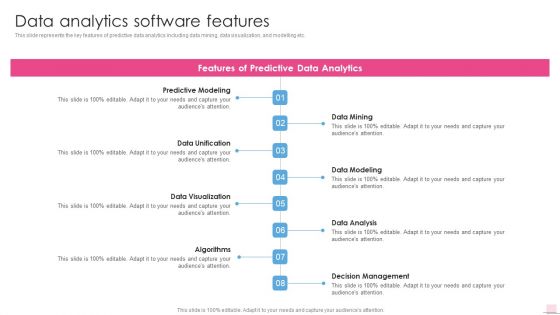
Data Analytics Software Features Business Analysis Modification Toolkit Formats PDF
This slide represents the key features of predictive data analytics including data mining, data visualization, and modelling etc.Presenting Data Analytics Software Features Business Analysis Modification Toolkit Formats PDF to provide visual cues and insights. Share and navigate important information on eight stages that need your due attention. This template can be used to pitch topics like Predictive Modeling, Data Unification, Data Visualization. In addtion, this PPT design contains high resolution images, graphics, etc, that are easily editable and available for immediate download.

Forecast Analysis Technique IT Roadmap For Predictive Modeling Model Development Summary PDF
This slide represents the roadmap for predictive analytics model development, including the steps to be performed in the process, such as highlighting and formulating a problem, data preparation, information exploration, transforming and choosing, making, validating, and so on. Make sure to capture your audiences attention in your business displays with our gratis customizable Forecast Analysis Technique IT Roadmap For Predictive Modeling Model Development Summary PDF. These are great for business strategies, office conferences, capital raising or task suggestions. If you desire to acquire more customers for your tech business and ensure they stay satisfied, create your own sales presentation with these plain slides.
How To Draw Business Process Diagram 3d Team Discussing Bar Graph PowerPoint Templates
We present our how to draw business process diagram 3d team discussing bar graph PowerPoint templates.Download and present our Business PowerPoint Templates because It will get your audience in sync. Download and present our People PowerPoint Templates because You can Be the puppeteer with our PowerPoint Templates and Slides as your strings. Lead your team through the steps of your script. Use our Finance PowerPoint Templates because Our PowerPoint Templates and Slides are created by a hardworking bunch of busybees. Always flitting around with solutions gauranteed to please. Download and present our Symbol PowerPoint Templates because Our PowerPoint Templates and Slides will provide you a launch platform. Give a lift off to your ideas and send them into orbit. Download and present our Success PowerPoint Templates because You have gained great respect for your brilliant ideas. Use our PowerPoint Templates and Slides to strengthen and enhance your reputation.Use these PowerPoint slides for presentations relating to 3d, art, boardroom, budget, business, ceo, character, communication, concept, conference, corporate, council, discussion, economy, executive, finance, gold, graph, growth, icon, idea, idiom, illustration, isolated, lecture, manage, management, market, meet, metaphor, money, office, over, percentage, planning, presentation, projection, prospectus, report, study, summit, symbol, talk, team, white. The prominent colors used in the PowerPoint template are Red, Gray, Black. The feedback we get is that our how to draw business process diagram 3d team discussing bar graph PowerPoint templates are designed by a team of presentation professionals. Customers tell us our character PowerPoint templates and PPT Slides will impress their bosses and teams. The feedback we get is that our how to draw business process diagram 3d team discussing bar graph PowerPoint templates are designed by professionals Professionals tell us our business PowerPoint templates and PPT Slides are readymade to fit into any presentation structure. Presenters tell us our how to draw business process diagram 3d team discussing bar graph PowerPoint templates will make you look like a winner. You can be sure our ceo PowerPoint templates and PPT Slides provide you with a vast range of viable options. Select the appropriate ones and just fill in your text.
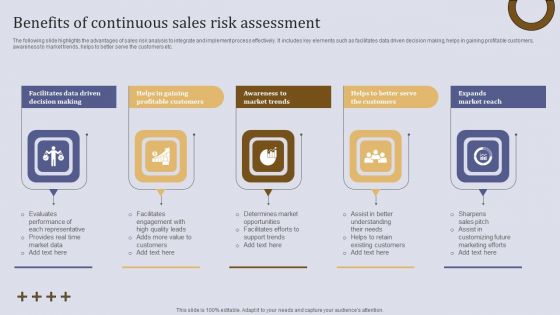
Executing Sales Risk Administration Procedure Benefits Of Continuous Sales Risk Assessment Template PDF
The following slide highlights the advantages of sales risk analysis to integrate and implement process effectively. It includes key elements such as facilitates data driven decision making, helps in gaining profitable customers, awareness to market trends, helps to better serve the customers etc. Create an editable Executing Sales Risk Administration Procedure Benefits Of Continuous Sales Risk Assessment Template PDF that communicates your idea and engages your audience. Whether you are presenting a business or an educational presentation, pre designed presentation templates help save time. Executing Sales Risk Administration Procedure Benefits Of Continuous Sales Risk Assessment Template PDF is highly customizable and very easy to edit, covering many different styles from creative to business presentations. Slidegeeks has creative team members who have crafted amazing templates. So, go and get them without any delay.
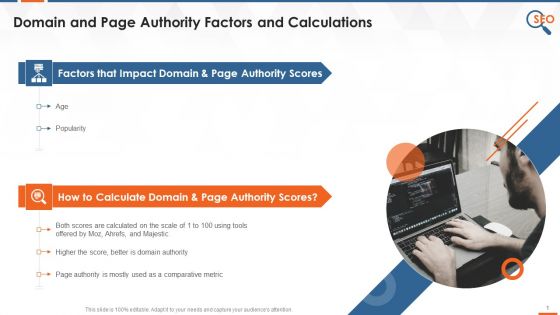
Factors And Calculations Impacting Domain And Page Authority Training Ppt
The slide provides information regarding the factors that impact domain and page authority scores that are age and popularity. It also contains details about the calculation of domain and page authority scores.

Data Visualization And Predictive Analysis Chart Ppt Slides
This is a data visualization and predictive analysis chart ppt slides. This is a nine stage process. The stages in this process are business requirement, data exploration, data selection, data preparation, design model, validate model, deploy model, analyze results, update model, revalidate.
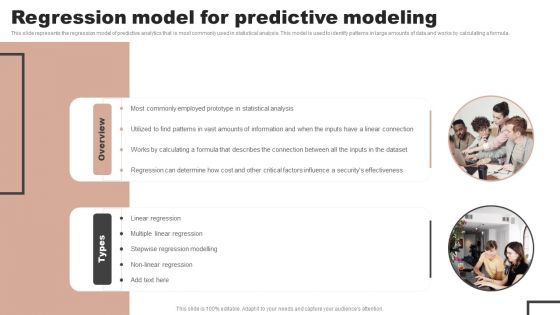
Forecast Analysis Technique IT Regression Model For Predictive Modeling Mockup PDF
This slide represents the regression model of predictive analytics that is most commonly used in statistical analysis. This model is used to identify patterns in large amounts of data and works by calculating a formula. Crafting an eye catching presentation has never been more straightforward. Let your presentation shine with this tasteful yet straightforward Forecast Analysis Technique IT Regression Model For Predictive Modeling Mockup PDF template. It offers a minimalistic and classy look that is great for making a statement. The colors have been employed intelligently to add a bit of playfulness while still remaining professional. Construct the ideal Forecast Analysis Technique IT Regression Model For Predictive Modeling Mockup PDF that effortlessly grabs the attention of your audience Begin now and be certain to wow your customers.
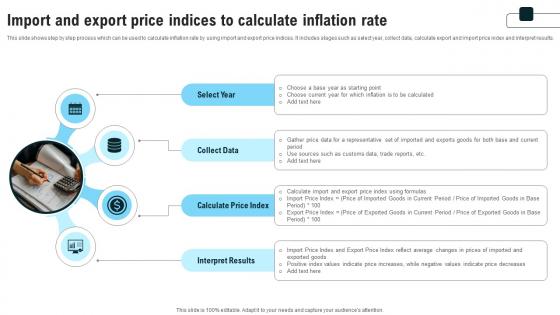
Import And Export Price Indices To Calculate Strategies For Inflation A Tactical Guide Fin SS V
This slide shows step by step process which can be used to calculate inflation rate by using import and export price indices. It includes stages such as select year, collect data, calculate export and import price index and interpret results. This Import And Export Price Indices To Calculate Strategies For Inflation A Tactical Guide Fin SS V is perfect for any presentation, be it in front of clients or colleagues. It is a versatile and stylish solution for organizing your meetings. The Import And Export Price Indices To Calculate Strategies For Inflation A Tactical Guide Fin SS V features a modern design for your presentation meetings. The adjustable and customizable slides provide unlimited possibilities for acing up your presentation. Slidegeeks has done all the homework before launching the product for you. So, do not wait, grab the presentation templates today
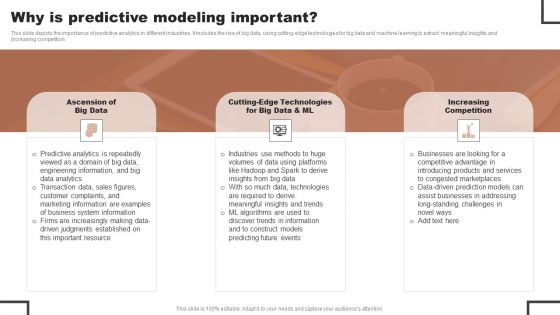
Forecast Analysis Technique IT Why Is Predictive Modeling Important Mockup PDF
This slide depicts the importance of predictive analytics in different industries. It includes the rise of big data, using cutting-edge technologies for big data and machine learning to extract meaningful insights and increasing competition. The Forecast Analysis Technique IT Why Is Predictive Modeling Important Mockup PDF is a compilation of the most recent design trends as a series of slides. It is suitable for any subject or industry presentation, containing attractive visuals and photo spots for businesses to clearly express their messages. This template contains a variety of slides for the user to input data, such as structures to contrast two elements, bullet points, and slides for written information. Slidegeeks is prepared to create an impression.

Steps To Conduct Retention Analysis To Optimize Churn Product Analytics Implementation Data Analytics V
This slide provides phases to conduct retention analysis aimed at helping businesses improve churn rate. It covers six steps such as calculate rate, choose retention KPIs, flag behaviours, determine triggers, identify behaviours and generate feedback This Steps To Conduct Retention Analysis To Optimize Churn Product Analytics Implementation Data Analytics V is perfect for any presentation, be it in front of clients or colleagues. It is a versatile and stylish solution for organizing your meetings. The Steps To Conduct Retention Analysis To Optimize Churn Product Analytics Implementation Data Analytics V features a modern design for your presentation meetings. The adjustable and customizable slides provide unlimited possibilities for acing up your presentation. Slidegeeks has done all the homework before launching the product for you. So, do not wait, grab the presentation templates today

Forecast Analysis Technique IT Introduction To Predictive Modeling Technology Portrait PDF
This slide represents the predictive analytics introduction that is used for forecasts action, behaviors, and trends using recent and past information. It performs the operations such as data mining, text analytics, statistics, and modeling on structured and unstructured data. Boost your pitch with our creative Forecast Analysis Technique IT Introduction To Predictive Modeling Technology Portrait PDF. Deliver an awe inspiring pitch that will mesmerize everyone. Using these presentation templates you will surely catch everyones attention. You can browse the ppts collection on our website. We have researchers who are experts at creating the right content for the templates. So you do not have to invest time in any additional work. Just grab the template now and use them.
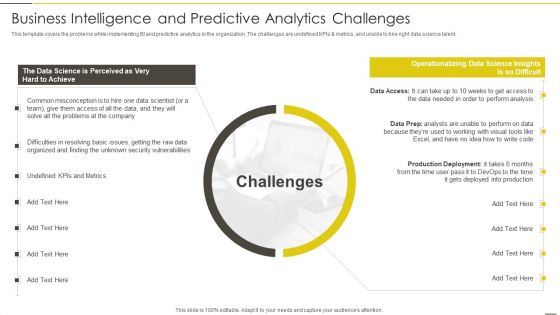
Administered Data And Analytic Quality Playbook Business Intelligence And Predictive Download PDF
This template covers the problems while implementing BI and predictive analytics in the organization. The challenges are undefined KPIs and metrics, and unable to hire right data science talent. Deliver and pitch your topic in the best possible manner with this Administered Data And Analytic Quality Playbook Business Intelligence And Predictive Download PDF Use them to share invaluable insights on Common Misconception, Operationalizing, Production Deployment and impress your audience. This template can be altered and modified as per your expectations. So, grab it now.

Data Analytics Business Case And Roadmap Transformation Toolkit Competitive Intelligence Information Themes PDF
This slide shows the business processes and key deliverables for developing the data analytics BI project. It starts with assessing and document the current state to identify priorities, analyse the process and ends at developing roadmap to achieve the outcomes. Create an editable Data Analytics Business Case And Roadmap Transformation Toolkit Competitive Intelligence Information Themes PDF that communicates your idea and engages your audience. Whether you are presenting a business or an educational presentation, pre designed presentation templates help save time. Data Analytics Business Case And Roadmap Transformation Toolkit Competitive Intelligence Information Themes PDF is highly customizable and very easy to edit, covering many different styles from creative to business presentations. Slidegeeks has creative team members who have crafted amazing templates. So, go and get them without any delay.

Guidebook For Executing Business Market Intelligence Statistics Report Showing Market Graphics PDF
This slide presents an statistics reports providing valuable insights of global market based on data collection and analysis. It covers key elements such as forecasted market CAGR, incremental growth, estimated YoY rate, revenue generating market region and key drivers. Do you have to make sure that everyone on your team knows about any specific topic I yes, then you should give Guidebook For Executing Business Market Intelligence Statistics Report Showing Market Graphics PDF a try. Our experts have put a lot of knowledge and effort into creating this impeccable Guidebook For Executing Business Market Intelligence Statistics Report Showing Market Graphics PDF. You can use this template for your upcoming presentations, as the slides are perfect to represent even the tiniest detail. You can download these templates from the Slidegeeks website and these are easy to edit. So grab these today.

Table Of Contents Data Safety Initiatives For Effective IT Security Threats Administration Summary PDF
Presenting table of contents data safety initiatives for effective it security threats administration summary pdf to provide visual cues and insights. Share and navigate important information on seven stages that need your due attention. This template can be used to pitch topics like overcoming identified gaps, improved incident reporting, communication plan cyber breaches, ensuring effective risk governance. In addtion, this PPT design contains high resolution images, graphics, etc, that are easily editable and available for immediate download.

Comparing Lean Operational Excellence Strategy Manufacturing Kpis With Competitors Mockup PDF
This slide showcases manufacturing KPIs comparison of company with competitors from the industry. Key KPIs included here are total cycle time, time for changeovers, capacity utilization, suppliers quality, reportable incidents, equipment efficiency etc. Pitch your topic with ease and precision using this Comparing Lean Operational Excellence Strategy Manufacturing Kpis With Competitors Mockup PDF. This layout presents information on Parameters, Rejection Rate, Quality. It is also available for immediate download and adjustment. So, changes can be made in the color, design, graphics or any other component to create a unique layout.
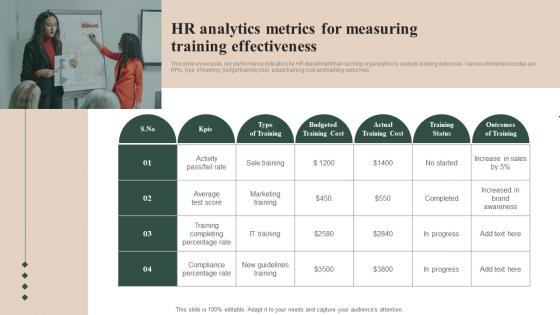
HR Analytics Metrics For Measuring Training Effectiveness Infographics Pdf
This slide showcases key performance indicators for HR department that can help organization to analyze training outcomes. Various elements includes are KPIs, type of training, budget training cost, actual training cost and training outcomes Showcasing this set of slides titled HR Analytics Metrics For Measuring Training Effectiveness Infographics Pdf The topics addressed in these templates are Percentage Rate, Training Completing, Marketing Training All the content presented in this PPT design is completely editable. Download it and make adjustments in color, background, font etc. as per your unique business setting.

 Home
Home