Project Management Dashboard
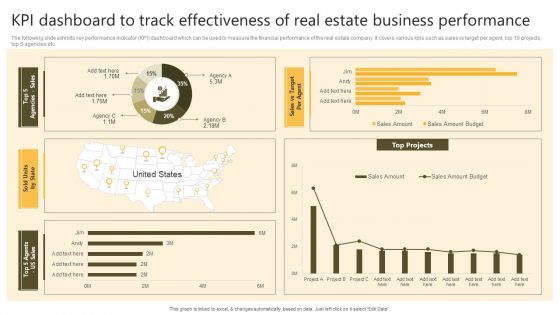
Successful Risk Administration KPI Dashboard To Track Effectiveness Of Real Estate Business Template PDF
The following slide exhibits key performance indicator KPI dashboard which can be used to measure the financial performance of the real estate company. It covers various kpis such as sales vs target per agent, top 10 projects, top 5 agencies etc. If your project calls for a presentation, then Slidegeeks is your go-to partner because we have professionally designed, easy-to-edit templates that are perfect for any presentation. After downloading, you can easily edit Successful Risk Administration KPI Dashboard To Track Effectiveness Of Real Estate Business Template PDF and make the changes accordingly. You can rearrange slides or fill them with different images. Check out all the handy templates.
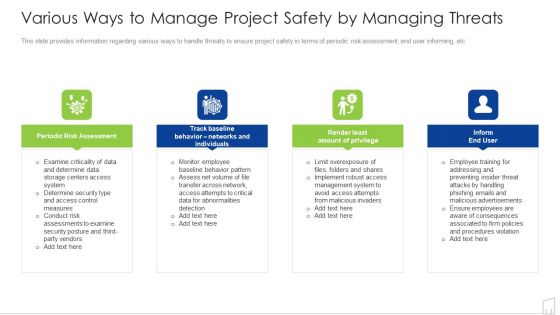
Various Ways To Manage Project Safety By Managing Threats Ppt Ideas Deck PDF
This slide provides information regarding various ways to handle threats to ensure project safety in terms of periodic risk assessment, end user informing, etc. Presenting various ways to manage project safety by managing threats ppt ideas deck pdf to provide visual cues and insights. Share and navigate important information on four stages that need your due attention. This template can be used to pitch topics like determine, system, data, risk, periodic. In addtion, this PPT design contains high resolution images, graphics, etc, that are easily editable and available for immediate download.

Risk Key Performance Indicator Dashboard With Injury Cost Ppt Summary Brochure PDF
The following slide highlights the safety key performance indicator dashboard with injury cost. It showcases recordable incident rate, serious injuries, injury cost, reporting culture trend, fleet accidents, project safety, safety training completion and safety incidents. Pitch your topic with ease and precision using this Risk Key Performance Indicator Dashboard With Injury Cost Ppt Summary Brochure PDF. This layout presents information on Recordable Incident Rate, Reporting Culture Trend, Project Safety. It is also available for immediate download and adjustment. So, changes can be made in the color, design, graphics or any other component to create a unique layout.
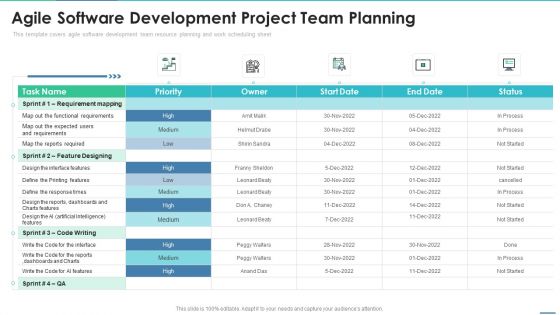
Agile Project Team Delegation IT Agile Software Development Project Team Planning Ideas PDF
This template covers agile software development team resource planning and work scheduling sheet. Deliver and pitch your topic in the best possible manner with this agile project team delegation it agile software development project team planning ideas pdf. Use them to share invaluable insights on requirement mapping, design, dashboards and impress your audience. This template can be altered and modified as per your expectations. So, grab it now.

Equity Asset Allocation Dashboard Analytics Strategic Investment Plan For Optimizing Risk SS V
This slide represents an equity asset allocation dashboard to measure and manage the performance of equity overtime. It tracks KPIs such as, average position size, market cap distribution, average PE distribution, ratio and yield, by geography, industry, currency and holding lists.If your project calls for a presentation, then Slidegeeks is your go-to partner because we have professionally designed, easy-to-edit templates that are perfect for any presentation. After downloading, you can easily edit Equity Asset Allocation Dashboard Analytics Strategic Investment Plan For Optimizing Risk SS V and make the changes accordingly. You can rearrange slides or fill them with different images. Check out all the handy templates
New Product Launch Product Launch Activities Tracking Dashboard Wd Topics PDF
This slide provides information regarding product launch activities tracking dashboard in terms of project budget, projected launch date, overdue tasks, workload, risks, etc. The best PPT templates are a great way to save time, energy, and resources. Slidegeeks have 100 percent editable powerpoint slides making them incredibly versatile. With these quality presentation templates, you can create a captivating and memorable presentation by combining visually appealing slides and effectively communicating your message. Download New Product Launch Product Launch Activities Tracking Dashboard Wd Topics PDF from Slidegeeks and deliver a wonderful presentation.

Dashboard To Track IT Security Playbook For Strategic Actions To Improve IT Performance Summary Pdf
This slide portrays information regarding the dashboard that firm will track various incidents detected. These incidents will be managed in order to avoid security risks. If your project calls for a presentation, then Slidegeeks is your go to partner because we have professionally designed, easy to edit templates that are perfect for any presentation. After downloading, you can easily edit Dashboard To Track IT Security Playbook For Strategic Actions To Improve IT Performance Summary Pdf and make the changes accordingly. You can rearrange slides or fill them with different images. Check out all the handy templates

Budget Vs Actual Cost Comparison Dashboard Ppt PowerPoint Presentation Professional Format Ideas PDF
This slide illustrates fact and figures relating to various project budgets of a company. It includes monthly budget graph, project budget meter and budget vs. Actual costs chart.Pitch your topic with ease and precision using this Budget Vs Actual Cost Comparison Dashboard Ppt PowerPoint Presentation Professional Format Ideas PDF. This layout presents information on Milestones, Budget Graph, Manager. It is also available for immediate download and adjustment. So, changes can be made in the color, design, graphics or any other component to create a unique layout.
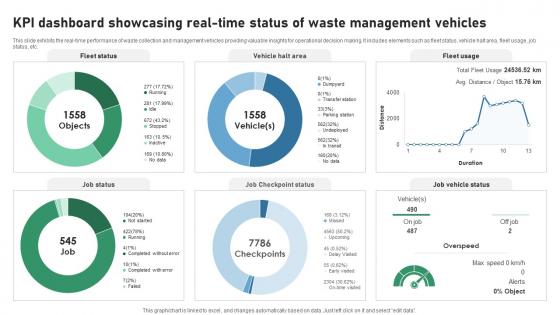
KPI Dashboard Showcasing Real Time Status Of Waste IOT Applications In Smart Waste IoT SS V
This slide exhibits the real-time performance of waste collection and management vehicles providing valuable insights for operational decision making. It includes elements such as fleet status, vehicle halt area, fleet usage, job status, etc. Take your projects to the next level with our ultimate collection of KPI Dashboard Showcasing Real Time Status Of Waste IOT Applications In Smart Waste IoT SS V. Slidegeeks has designed a range of layouts that are perfect for representing task or activity duration, keeping track of all your deadlines at a glance. Tailor these designs to your exact needs and give them a truly corporate look with your own brand colors they will make your projects stand out from the rest
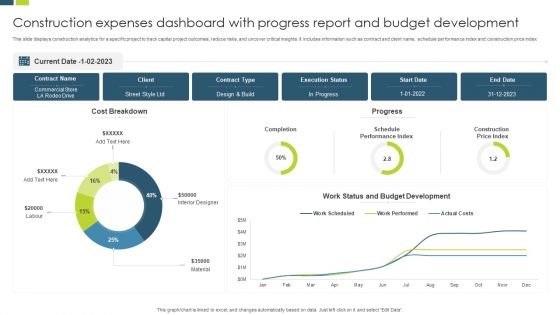
Construction Expenses Dashboard With Progress Report And Budget Development Background PDF
This slide displays construction analytics for a specific project to track capital project outcomes, reduce risks, and uncover critical insights. It includes information such as contract and client name, schedule performance index and construction price index. Showcasing this set of slides titled Construction Expenses Dashboard With Progress Report And Budget Development Background PDF. The topics addressed in these templates are Budget Development, Execution Status, Commercial Store. All the content presented in this PPT design is completely editable. Download it and make adjustments in color, background, font etc. as per your unique business setting.
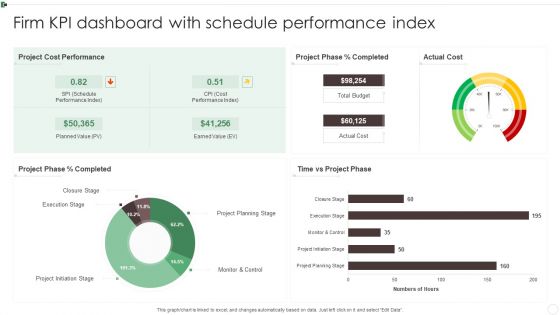
Firm KPI Dashboard With Schedule Performance Index Ppt Visual Aids PDF
This graph or chart is linked to excel, and changes automatically based on data. Just left click on it and select Edit Data. Pitch your topic with ease and precision using this Firm KPI Dashboard With Schedule Performance Index Ppt Visual Aids PDF. This layout presents information on Project Cost Performance, Project Planning Stage, Monitor And Control. It is also available for immediate download and adjustment. So, changes can be made in the color, design, graphics or any other component to create a unique layout.

Integrating Cloud Project Software With Mobile Devices Integrating Cloud Computing To Enhance Projects Effectiveness Mockup PDF
This slide illustrates integrating cloud project management software with smartphones and devices. It provides information about android, iOS, cost, login, size, logging, to do list, gantt chart, chat, dashboard, etc. Crafting an eye catching presentation has never been more straightforward. Let your presentation shine with this tasteful yet straightforward Integrating Cloud Project Software With Mobile Devices Integrating Cloud Computing To Enhance Projects Effectiveness Mockup PDF template. It offers a minimalistic and classy look that is great for making a statement. The colors have been employed intelligently to add a bit of playfulness while still remaining professional. Construct the ideal Integrating Cloud Project Software With Mobile Devices Integrating Cloud Computing To Enhance Projects Effectiveness Mockup PDF that effortlessly grabs the attention of your audience Begin now and be certain to wow your customers.

Dashboard To Analyze Flexible Working Strategies Impact On Employees Performance Rules PDF
The following slide delineates a key performance indicator KPI dashboard through which managers can evaluate the success of a flexible working policy on workforce performance. The major KPIs are absenteeism rate, overall labor effectiveness etc.If your project calls for a presentation, then Slidegeeks is your go-to partner because we have professionally designed, easy to edit templates that are perfect for any presentation. After downloading, you can easily edit Dashboard To Analyze Flexible Working Strategies Impact On Employees Performance Rules PDF and make the changes accordingly. You can rearrange slides or fill them with different images. Check out all the handy templates
New Product Launch To Market Playbook Product Launch Activities Tracking Dashboard Graphics PDF
This slide provides information regarding product launch activities tracking dashboard in terms of project budget, projected launch date, overdue tasks, workload, risks, etc. Get a simple yet stunning designed New Product Launch To Market Playbook Product Launch Activities Tracking Dashboard Graphics PDF. It is the best one to establish the tone in your meetings. It is an excellent way to make your presentations highly effective. So, download this PPT today from Slidegeeks and see the positive impacts. Our easy to edit New Product Launch To Market Playbook Product Launch Activities Tracking Dashboard Graphics PDF can be your go to option for all upcoming conferences and meetings. So, what are you waiting for Grab this template today.

Depicting Impact On Project Success Rate Strategies To Enhance Project Lifecycle Infographics PDF
This slide focuses on impact of project management plan on success rate which compares project success due to efficient scheduling, capable project team, etc.This Depicting Impact On Project Success Rate Strategies To Enhance Project Lifecycle Infographics PDF from Slidegeeks makes it easy to present information on your topic with precision. It provides customization options, so you can make changes to the colors, design, graphics, or any other component to create a unique layout. It is also available for immediate download, so you can begin using it right away. Slidegeeks has done good research to ensure that you have everything you need to make your presentation stand out. Make a name out there for a brilliant performance.

Dashboard Showing Performance Brand Building Techniques To Gain Competitive Edge Topics Pdf
The following slide outlines the key performance indicator dashboard used by the organization to evaluate the effectiveness of multiple marketing campaigns. It provides information about total spending, impressions, acquisitions, cost per acquisition, clicks, etc. If your project calls for a presentation, then Slidegeeks is your go to partner because we have professionally designed, easy to edit templates that are perfect for any presentation. After downloading, you can easily edit Dashboard Showing Performance Brand Building Techniques To Gain Competitive Edge Topics Pdf and make the changes accordingly. You can rearrange slides or fill them with different images. Check out all the handy templates

Vendor Procurement Cycle And Expenses Management Effective Vendor Management For Enhancing Introduction PDF
The following slide illustrates supplier procurement cycle and expenses management dashboard. It provides information about conracted, unlisted, top suppliers, spending, savings, procurement cycle time, etc. If your project calls for a presentation, then Slidegeeks is your go-to partner because we have professionally designed, easy-to-edit templates that are perfect for any presentation. After downloading, you can easily edit Vendor Procurement Cycle And Expenses Management Effective Vendor Management For Enhancing Introduction PDF and make the changes accordingly. You can rearrange slides or fill them with different images. Check out all the handy templates
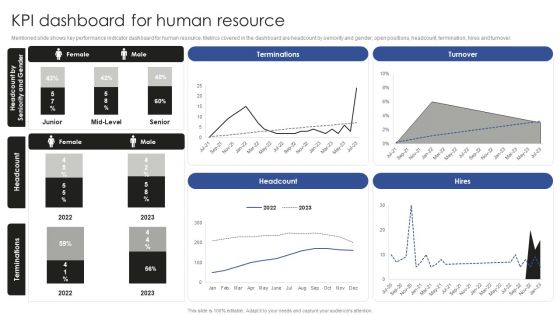
Talent Administration And Succession KPI Dashboard For Human Resource Rules PDF
Mentioned slide shows key performance indicator dashboard for human resource. Metrics covered in the dashboard are headcount by seniority and gender, open positions, headcount, termination, hires and turnover. If your project calls for a presentation, then Slidegeeks is your go-to partner because we have professionally designed, easy-to-edit templates that are perfect for any presentation. After downloading, you can easily edit Talent Administration And Succession KPI Dashboard For Human Resource Rules PDF and make the changes accordingly. You can rearrange slides or fill them with different images. Check out all the handy templates
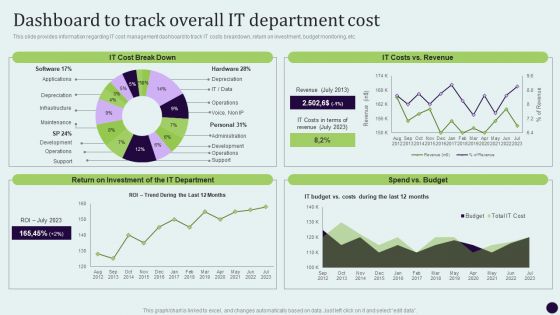
Critical Measures For Ensuring Dashboard To Track Overall IT Department Cost Template PDF
This slide provides information regarding IT cost management dashboard to track IT costs breakdown, return on investment, budget monitoring, etc. There are so many reasons you need a Critical Measures For Ensuring Dashboard To Track Overall IT Department Cost Template PDF. The first reason is you cant spend time making everything from scratch, Thus, Slidegeeks has made presentation templates for you too. You can easily download these templates from our website easily.

Dashboard For Enabling Brand Reinforcement Encouraging Repetitive Customer Purchase Ppt Slide
This slide showcases metrics for brand reinforcement. This template focuses on tracking project performance to keep team informed about work status. It covers aspects related to sales revenue, costs, revenue earned, profits, etc. From laying roadmaps to briefing everything in detail, our templates are perfect for you. You can set the stage with your presentation slides. All you have to do is download these easy-to-edit and customizable templates. Dashboard For Enabling Brand Reinforcement Encouraging Repetitive Customer Purchase Ppt Slide will help you deliver an outstanding performance that everyone would remember and praise you for. Do download this presentation today.
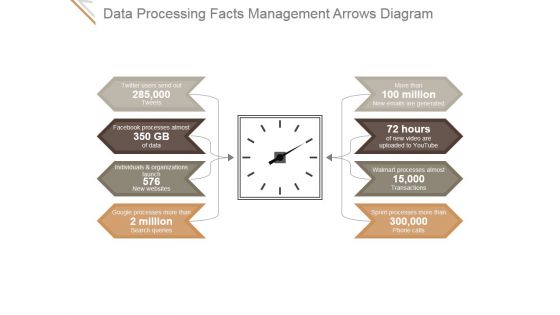
Data Processing Facts Management Arrows Diagram Ppt PowerPoint Presentation Templates
This is a data processing facts management arrows diagram ppt powerpoint presentation templates. This is a eight stage process. The stages in this process are marketing, arrows, management, facts, data processing.

Guide To Healthcare Services Administration Dashboard To Evaluate The Hospital Operations Performance Infographics PDF
The following slide showcases dashboard which can be used by the healthcare professionals to measure the performance of operational department. The KPIs covered in the slide are total patients, operational cost, available staff per division etc. If your project calls for a presentation, then Slidegeeks is your go to partner because we have professionally designed, easy to edit templates that are perfect for any presentation. After downloading, you can easily edit Guide To Healthcare Services Administration Dashboard To Evaluate The Hospital Operations Performance Infographics PDF and make the changes accordingly. You can rearrange slides or fill them with different images. Check out all the handy templates
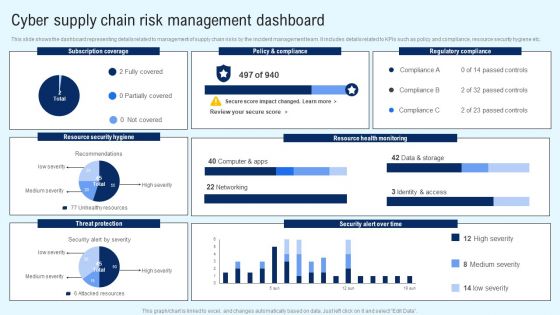
Implementing Cyber Security Incident Cyber Supply Chain Risk Dashboard Download PDF
This slide shows the dashboard representing details related to management of supply chain risks by the incident management team. It includes details related to KPIs such as policy and compliance, resource security hygiene etc. Slidegeeks is here to make your presentations a breeze with Implementing Cyber Security Incident Cyber Supply Chain Risk Dashboard Download PDF With our easy to use and customizable templates, you can focus on delivering your ideas rather than worrying about formatting. With a variety of designs to choose from, you are sure to find one that suits your needs. And with animations and unique photos, illustrations, and fonts, you can make your presentation pop. So whether you are giving a sales pitch or presenting to the board, make sure to check out Slidegeeks first.
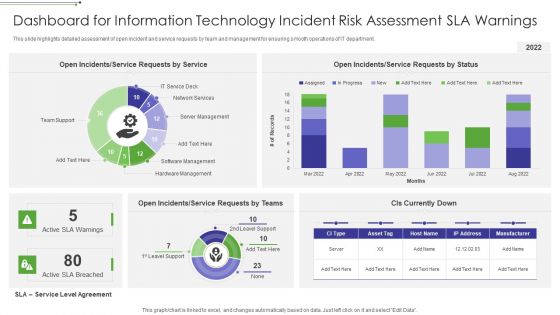
Dashboard For Information Technology Incident Risk Assessment SLA Warnings Sample PDF
This slide highlights detailed assessment of open incident and service requests by team and management for ensuring smooth operations of IT department.Showcasing this set of slides titled Dashboard For Information Technology Incident Risk Assessment SLA Warnings Sample PDF The topics addressed in these templates are Open Incidents, Requests By Service, Open Incidents All the content presented in this PPT design is completely editable. Download it and make adjustments in color, background, font etc. as per your unique business setting.
Change Execution Plan Dashboard For Issues Tracking Ppt PowerPoint Presentation Gallery Background Images PDF
This slide shows the issues tracking the dashboard for the business transition project. It provides details of multiple issues faced by users to keep records for effective management of the project. Deliver and pitch your topic in the best possible manner with this Change Execution Plan Dashboard For Issues Tracking Ppt PowerPoint Presentation Gallery Background Images PDF. Use them to share invaluable insights on Employee Wise Issues, Overall Issues Status, High Churn Issue and impress your audience. This template can be altered and modified as per your expectations. So, grab it now.

Overview Of Organizational Kpi Metrics Dashboard Highlighting Organization Revenue Brochure PDF
The following slide outlines key performance indicator KPI dashboard showcasing various financial metrics of the organization. The key metrics are gross revenue, product revenue, service revenue, gross profit, net profit etc. If your project calls for a presentation, then Slidegeeks is your go-to partner because we have professionally designed, easy-to-edit templates that are perfect for any presentation. After downloading, you can easily edit Overview Of Organizational Kpi Metrics Dashboard Highlighting Organization Revenue Brochure PDF and make the changes accordingly. You can rearrange slides or fill them with different images. Check out all the handy templates.
Technology Upgradation Action Plan Dashboard For Issues Tracking Ppt Portfolio Graphics Pictures PDF
This slide shows the issues tracking the dashboard for the business transition project. It provides details of multiple issues faced by users to keep records for effective management of the project. Deliver an awe inspiring pitch with this creative Technology Upgradation Action Plan Dashboard For Issues Tracking Ppt Portfolio Graphics Pictures PDF bundle. Topics like Issues Failed Verification, Immediate Issues, High Churn Issues, Suspect Requirements, Failed Test Runs can be discussed with this completely editable template. It is available for immediate download depending on the needs and requirements of the user.
Information Technology Change Implementation Plan Dashboard For Issues Tracking Clipart PDF
This slide shows the issues tracking the dashboard for the business transition project. It provides details of multiple issues faced by users to keep records for effective management of the project. Deliver an awe inspiring pitch with this creative Information Technology Change Implementation Plan Dashboard For Issues Tracking Clipart PDF bundle. Topics like Issues Failed Verification, Immediate Issues, High Churn Issues, Suspect Requirements, Failed Test Runs can be discussed with this completely editable template. It is available for immediate download depending on the needs and requirements of the user.
Conformance Testing Performance Tracking Dashboard Compliance Assessment Ppt Layouts Graphics PDF
This slide depicts the conformance testing performance tracking dashboard by covering details of test case analysis, tests linked to requirements, test case breakdown, tests per requirement, and so on. If your project calls for a presentation, then Slidegeeks is your go-to partner because we have professionally designed, easy-to-edit templates that are perfect for any presentation. After downloading, you can easily edit Conformance Testing Performance Tracking Dashboard Compliance Assessment Ppt Layouts Graphics PDF and make the changes accordingly. You can rearrange slides or fill them with different images. Check out all the handy templates
Robotic Process Automation Shipping And Logistics Tracking Dashboard With Shipments Clipart PDF
This slide covers Key performance indicators to track the automation system of the company. This dashboard includes Logistics Efficiency Status, delivery time accuracy etc. If your project calls for a presentation, then Slidegeeks is your go-to partner because we have professionally designed, easy-to-edit templates that are perfect for any presentation. After downloading, you can easily edit Robotic Process Automation Shipping And Logistics Tracking Dashboard With Shipments Clipart PDF and make the changes accordingly. You can rearrange slides or fill them with different images. Check out all the handy templates

Sustainability Calculation With KPI Customer Satisfaction Dashboard Customer Ppt PowerPoint Presentation Gallery Smartart PDF
Following slide shows customer satisfaction dashboard covering net promoter score. It also includes customer retention metrics with a 12 month format. Deliver and pitch your topic in the best possible manner with this sustainability calculation with kpi customer satisfaction dashboard customer ppt powerpoint presentation gallery smartart pdf. Use them to share invaluable insights on customer satisfaction dashboard and impress your audience. This template can be altered and modified as per your expectations. So, grab it now.
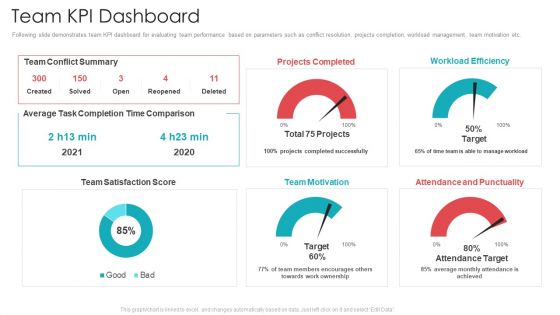
Official Team Collaboration Plan Team KPI Dashboard Ppt Gallery Backgrounds PDF
Following slide demonstrates team KPI dashboard for evaluating team performance based on parameters such as conflict resolution, projects completion, workload management, team motivation etc. Deliver an awe-inspiring pitch with this creative official team collaboration plan team kpi dashboard ppt gallery backgrounds pdf bundle. Topics like projects completed, workload efficiency, team motivation, attendance and punctuality, team satisfaction score can be discussed with this completely editable template. It is available for immediate download depending on the needs and requirements of the user.

Organizational Program To Improve Team Productivity And Efficiency Team Kpi Dashboard Clipart PDF
Following slide demonstrates team KPI dashboard for evaluating team performance based on parameters such as conflict resolution, projects completion, workload management, team motivation etc. Deliver and pitch your topic in the best possible manner with this organizational program to improve team productivity and efficiency team kpi dashboard clipart pdf Use them to share invaluable insights on projects completed, workload efficiency, attendance and punctualityand impress your audience. This template can be altered and modified as per your expectations. So, grab it now.

New Product Launch Event Management Activities Event Management And Budget Planner Template PDF
This slide provides an overview of dashboard depicting budget planning for event. It includes budget graph, photographer, venue, decoration and catering expenses. Whether you have daily or monthly meetings, a brilliant presentation is necessary. New Product Launch Event Management Activities Event Management And Budget Planner Template PDF can be your best option for delivering a presentation. Represent everything in detail using New Product Launch Event Management Activities Event Management And Budget Planner Template PDF and make yourself stand out in meetings. The template is versatile and follows a structure that will cater to your requirements. All the templates prepared by Slidegeeks are easy to download and edit. Our research experts have taken care of the corporate themes as well. So, give it a try and see the results.
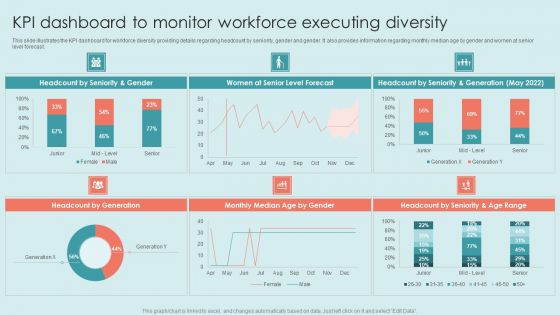
Executing Diversity KPI Dashboard To Monitor Workforce Executing Diversity Background PDF
This slide covers information regarding the key traits of inclusive leadership such as commitment, courage, cognize bias, curiosity etc. It also provides details about thinking to develop and behavior to adopt for becoming an effective inclusive leader. If your project calls for a presentation, then Slidegeeks is your go-to partner because we have professionally designed, easy-to-edit templates that are perfect for any presentation. After downloading, you can easily edit Executing Diversity KPI Dashboard To Monitor Workforce Executing Diversity Background PDF and make the changes accordingly. You can rearrange slides or fill them with different images. Check out all the handy templates.
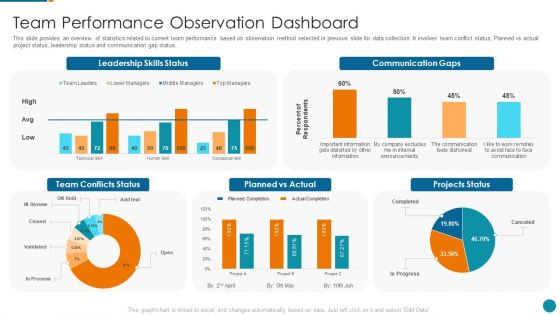
Strategic Procedure To Improve Employee Efficiency Team Performance Observation Dashboard Formats PDF
This slide provides an overview of statistics related to current team performance based on observation method selected in previous slide for data collection. It involves team conflict status, Planned vs actual project status, leadership status and communication gap status.Deliver an awe inspiring pitch with this creative strategic procedure to improve employee efficiency team performance observation dashboard formats pdf bundle. Topics like leadership skills status, communication gaps, planned vs actual can be discussed with this completely editable template. It is available for immediate download depending on the needs and requirements of the user.

KPI Dashboard To Track Performance Of Security For Cloud Based Systems Clipart PDF
This slide shows the dashboard which can be used by organization to monitor cloud security. It includes metrics overall progress, risk identified, number of critical incidents, initiatives, incident and threat management etc. Showcasing this set of slides titled KPI Dashboard To Track Performance Of Security For Cloud Based Systems Clipart PDF. The topics addressed in these templates are Kpi Dashboard To Track, Performance Of Security, Cloud Based Systems . All the content presented in this PPT design is completely editable. Download it and make adjustments in color, background, font etc. as per your unique business setting.
Dashboard To Measure Performance Of E Commerce Retail Business Growth Marketing Techniques Icons PDF
This following slide displays the key metrics that can help an organization to measure effectiveness of e-commerce strategies. These can be revenue generated using e-commerce platform, conversion rates etc. If your project calls for a presentation, then Slidegeeks is your go to partner because we have professionally designed, easy to edit templates that are perfect for any presentation. After downloading, you can easily edit Dashboard To Measure Performance Of E Commerce Retail Business Growth Marketing Techniques Icons PDF and make the changes accordingly. You can rearrange slides or fill them with different images. Check out all the handy templates

Target Audience Strategy For B2B And B2C Business Dashboard For Inbound Marketing Efforts Graphics PDF
The following slide displays key metrics that can help the organization to measure effectiveness of inbound marketing strategy, these can be cost per conversion, clicks, impressions, etc. If your project calls for a presentation, then Slidegeeks is your go-to partner because we have professionally designed, easy-to-edit templates that are perfect for any presentation. After downloading, you can easily edit Target Audience Strategy For B2B And B2C Business Dashboard For Inbound Marketing Efforts Graphics PDF and make the changes accordingly. You can rearrange slides or fill them with different images. Check out all the handy templates
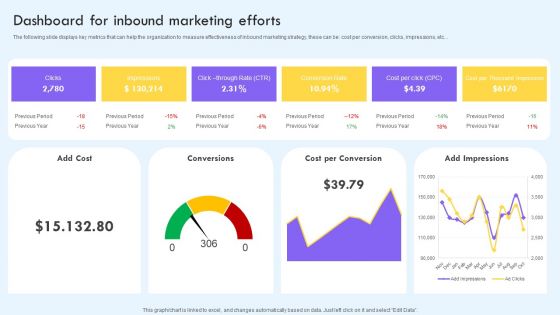
Dashboard For Inbound Marketing Efforts Ppt PowerPoint Presentation File Infographic Template PDF
The following slide displays key metrics that can help the organization to measure effectiveness of inbound marketing strategy, these can be cost per conversion, clicks, impressions, etc. If your project calls for a presentation, then Slidegeeks is your go to partner because we have professionally designed, easy to edit templates that are perfect for any presentation. After downloading, you can easily edit Dashboard For Inbound Marketing Efforts Ppt PowerPoint Presentation File Infographic Template PDF and make the changes accordingly. You can rearrange slides or fill them with different images. Check out all the handy templates.
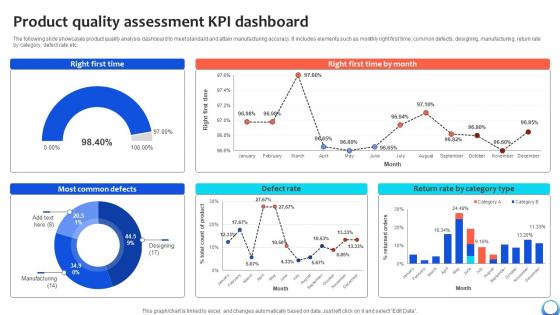
Product Quality Assessment KPI Dashboard Automating Production Process Strategy SS V
The following slide showcases product quality analysis dashboard to meet standard and attain manufacturing accuracy. It includes elements such as monthly right first time, common defects, designing, manufacturing, return rate by category, defect rate etc. Take your projects to the next level with our ultimate collection of Product Quality Assessment KPI Dashboard Automating Production Process Strategy SS V. Slidegeeks has designed a range of layouts that are perfect for representing task or activity duration, keeping track of all your deadlines at a glance. Tailor these designs to your exact needs and give them a truly corporate look with your own brand colors they will make your projects stand out from the rest

Agile Playbook For Program Designers Software Development Dashboard Ppt Infographics Brochure PDF
This slide covers software evaluation dashboard including spring details, team details to evaluate the project while proceeding to closure. If you are looking for a format to display your unique thoughts, then the professionally designed Agile Playbook For Program Designers Software Development Dashboard Ppt Infographics Brochure PDF is the one for you. You can use it as a Google Slides template or a PowerPoint template. Incorporate impressive visuals, symbols, images, and other charts. Modify or reorganize the text boxes as you desire. Experiment with shade schemes and font pairings. Alter, share or cooperate with other people on your work. Download Agile Playbook For Program Designers Software Development Dashboard Ppt Infographics Brochure PDF and find out how to give a successful presentation. Present a perfect display to your team and make your presentation unforgettable.

ERM Dashboard With Heat Map And Risk Analysis Ppt PowerPoint Presentation File Backgrounds PDF
This slide contains the overall information of an information of cyber risk management . It also includes risk rating breakdown, heat map, action plan , etc. Showcasing this set of slides titled ERM Dashboard With Heat Map And Risk Analysis Ppt PowerPoint Presentation File Backgrounds PDF. The topics addressed in these templates are Risk Rating Breakdown, Average Risk, Risk Analysis Progress. All the content presented in this PPT design is completely editable. Download it and make adjustments in color, background, font etc. as per your unique business setting.
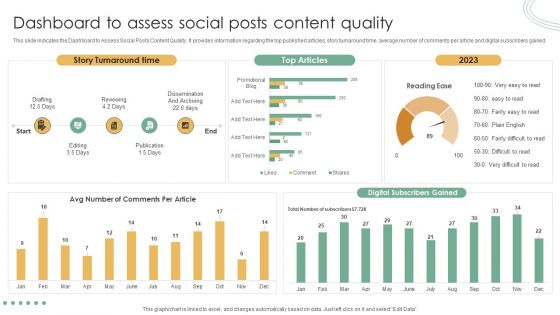
Online Marketing Techniques Assessment Approach Dashboard To Assess Social Posts Content Quality Information PDF
Take your projects to the next level with our ultimate collection of Online Marketing Techniques Assessment Approach Dashboard To Assess Social Posts Content Quality Information PDF. Slidegeeks has designed a range of layouts that are perfect for representing task or activity duration, keeping track of all your deadlines at a glance. Tailor these designs to your exact needs and give them a truly corporate look with your own brand colors they will make your projects stand out from the rest.

Project Work Plan Project Execution Plan Template Ppt PowerPoint Presentation Styles
This is a project work plan project execution plan template ppt powerpoint presentation styles. This is a seven stage process. The stages in this process are project, management, business, marketing, success.
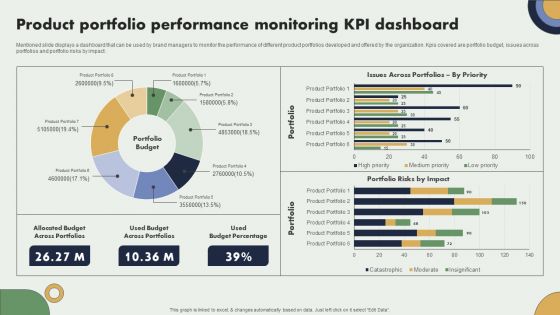
Product Portfolio Performance Monitoring Kpi Dashboard Brand Expansion Plan Slides PDF
Mentioned slide displays a dashboard that can be used by brand managers to monitor the performance of different product portfolios developed and offered by the organization. Kpis covered are portfolio budget, issues across portfolios and portfolio risks by impact.Take your projects to the next level with our ultimate collection of Product Portfolio Performance Monitoring Kpi Dashboard Brand Expansion Plan Slides PDF. Slidegeeks has designed a range of layouts that are perfect for representing task or activity duration, keeping track of all your deadlines at a glance. Tailor these designs to your exact needs and give them a truly corporate look with your own brand colors they all make your projects stand out from the rest.

Comprehensive Guide To Strengthen Brand Equity Financial KPI Dashboard Measure Brand Structure PDF
Mentioned slide showcases KPI dashboard that can be used to check the financial performance of a brand. Metrics covered in the dashboard are return on assets, working capital ratio, return on equity etc. Take your projects to the next level with our ultimate collection of Comprehensive Guide To Strengthen Brand Equity Financial KPI Dashboard Measure Brand Structure PDF. Slidegeeks has designed a range of layouts that are perfect for representing task or activity duration, keeping track of all your deadlines at a glance. Tailor these designs to your exact needs and give them a truly corporate look with your own brand colors they will make your projects stand out from the rest

Strategic Procedure To Improve Employee Efficiency Team KPI Dashboard Topics PDF
Following slide demonstrates team KPI dashboard for evaluating team performance based on parameters such as conflict resolution, projects completion, workload management, team motivation etc. Deliver and pitch your topic in the best possible manner with this strategic procedure to improve employee efficiency team kpi dashboard topics pdf Use them to share invaluable insights on team conflict summary, workload efficiency, team motivation and impress your audience. This template can be altered and modified as per your expectations. So, grab it now.
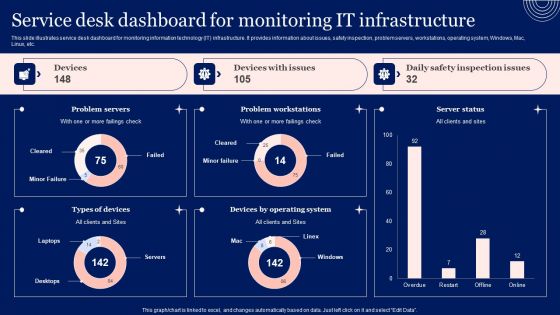
Implementing Advanced Service Help Desk Administration Program Service Desk Dashboard For Monitoring It Infrastructure Summary PDF
This slide illustrates service desk dashboard for monitoring information technology IT infrastructure. It provides information about issues, safety inspection, problem servers, workstations, operating system, Windows, Mac, Linux, etc. Take your projects to the next level with our ultimate collection of Implementing Advanced Service Help Desk Administration Program Service Desk Dashboard For Monitoring It Infrastructure Summary PDF. Slidegeeks has designed a range of layouts that are perfect for representing task or activity duration, keeping track of all your deadlines at a glance. Tailor these designs to your exact needs and give them a truly corporate look with your own brand colors they will make your projects stand out from the rest
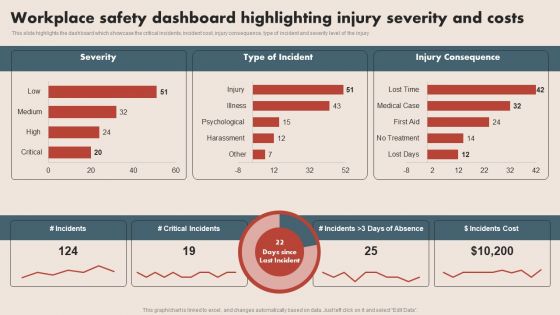
Deploying Safe Operating Procedures In The Organization Workplace Safety Dashboard Highlighting Injury Professional PDF
This slide highlights the dashboard which showcase the critical incidents, incident cost, injury consequence, type of incident and severity level of the injury. Take your projects to the next level with our ultimate collection of Deploying Safe Operating Procedures In The Organization Workplace Safety Dashboard Highlighting Injury Professional PDF. Slidegeeks has designed a range of layouts that are perfect for representing task or activity duration, keeping track of all your deadlines at a glance. Tailor these designs to your exact needs and give them a truly corporate look with your own brand colors they will make your projects stand out from the rest.
Cognitive Analytics Strategy And Techniques Tracking Customer Data Insights Dashboard Demonstration PDF
This slide provides information regarding customer data insights dashboard in terms of average churn risk, segments, high earner, highly engaged customers, etc. Take your projects to the next level with our ultimate collection of Cognitive Analytics Strategy And Techniques Tracking Customer Data Insights Dashboard Demonstration PDF. Slidegeeks has designed a range of layouts that are perfect for representing task or activity duration, keeping track of all your deadlines at a glance. Tailor these designs to your exact needs and give them a truly corporate look with your own brand colors they will make your projects stand out from the rest.
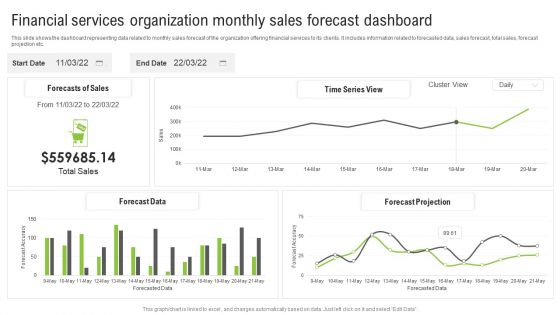
Financial Services Organization Monthly Sales Forecast Dashboard Ppt Summary Slideshow PDF
This slide shows the dashboard representing data related to monthly sales forecast of the organization offering financial services to its clients. It includes information related to forecasted data, sales forecast, total sales, forecast projection etc. Showcasing this set of slides titled Financial Services Organization Monthly Sales Forecast Dashboard Ppt Summary Slideshow PDF. The topics addressed in these templates are Forecasts Sales, Time Series View, Forecast Projection. All the content presented in this PPT design is completely editable. Download it and make adjustments in color, background, font etc. as per your unique business setting.
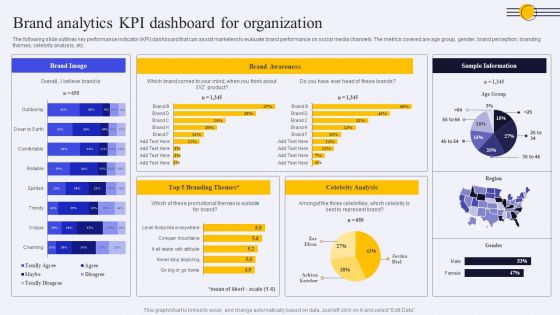
Brand Analytics KPI Dashboard For Organization Ppt PowerPoint Presentation Diagram PDF
The following slide outlines key performance indicator KPI dashboard that can assist marketers to evaluate brand performance on social media channels. The metrics covered are age group, gender, brand perception, branding themes, celebrity analysis, etc. Take your projects to the next level with our ultimate collection of Brand Analytics KPI Dashboard For Organization Ppt PowerPoint Presentation Diagram PDF. Slidegeeks has designed a range of layouts that are perfect for representing task or activity duration, keeping track of all your deadlines at a glance. Tailor these designs to your exact needs and give them a truly corporate look with your own brand colors they will make your projects stand out from the rest.
Driving Results Designing A Team Training And Development Program Tracking Dashboard
This slide depicts team development program tracking dashboard to analyze the impact of implementing training plan for the members. It includes training satisfaction rate, engagement score, drop-out rate and top 5 trainees. Take your projects to the next level with our ultimate collection of Driving Results Designing A Team Training And Development Program Tracking Dashboard. Slidegeeks has designed a range of layouts that are perfect for representing task or activity duration, keeping track of all your deadlines at a glance. Tailor these designs to your exact needs and give them a truly corporate look with your own brand colors they will make your projects stand out from the rest
Intelligent Process Automation IPA Hyper Automation Performance Tracking Dashboard Sample PDF
This slide depicts the performance tracking dashboard for hyper-automation, covering the number of rules triggered, automated emails, average originator, recipient, average click-through rate for automated emails, and quick links. Take your projects to the next level with our ultimate collection of Intelligent Process Automation IPA Hyper Automation Performance Tracking Dashboard Sample PDF. Slidegeeks has designed a range of layouts that are perfect for representing task or activity duration, keeping track of all your deadlines at a glance. Tailor these designs to your exact needs and give them a truly corporate look with your own brand colors they will make your projects stand out from the rest
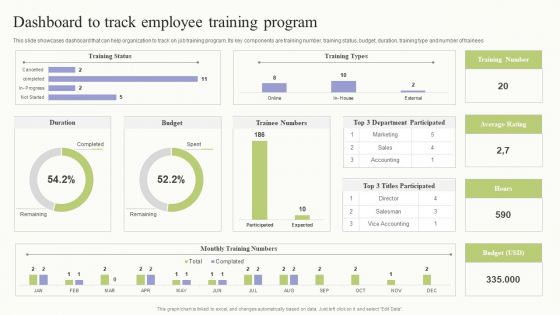
Workplace Training Techniques For Departments And Individual Staff Dashboard To Track Employee Training Program Formats PDF
This slide showcases dashboard that can help organization to track on job training program. Its key components are training number, training status, budget, duration, training type and number of trainees. Take your projects to the next level with our ultimate collection of Workplace Training Techniques For Departments And Individual Staff Dashboard To Track Employee Training Program Formats PDF. Slidegeeks has designed a range of layouts that are perfect for representing task or activity duration, keeping track of all your deadlines at a glance. Tailor these designs to your exact needs and give them a truly corporate look with your own brand colors they will make your projects stand out from the rest.

Dashboard To Track Product Sales Performance Implementing Focus Strategy To Improve Designs PDF
This slide showcases dashboard that can help organization to analyse the sales of product after entering into niche market. Its key elements are sales, sales target, sales growth, sales by channel, inventory days outstanding etc.Take your projects to the next level with our ultimate collection of Dashboard To Track Product Sales Performance Implementing Focus Strategy To Improve Designs PDF. Slidegeeks has designed a range of layouts that are perfect for representing task or activity duration, keeping track of all your deadlines at a glance. Tailor these designs to your exact needs and give them a truly corporate look with your own brand colors they all make your projects stand out from the rest.
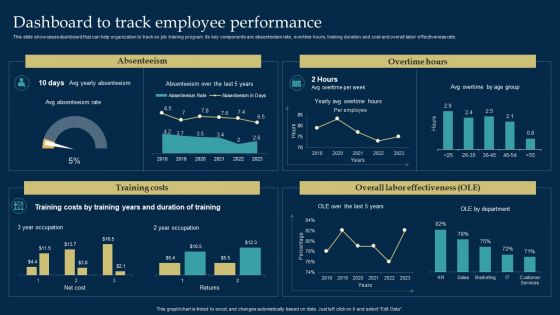
Employee Training And Development Strategy Dashboard To Track Employee Performance Slides PDF
This slide showcases dashboard that can help organization to track on job training program. Its key components are absenteeism rate, overtime hours, training duration and cost and overall labor effectiveness rate. Take your projects to the next level with our ultimate collection of Employee Training And Development Strategy Dashboard To Track Employee Performance Slides PDF. Slidegeeks has designed a range of layouts that are perfect for representing task or activity duration, keeping track of all your deadlines at a glance. Tailor these designs to your exact needs and give them a truly corporate look with your own brand colors they will make your projects stand out from the rest.
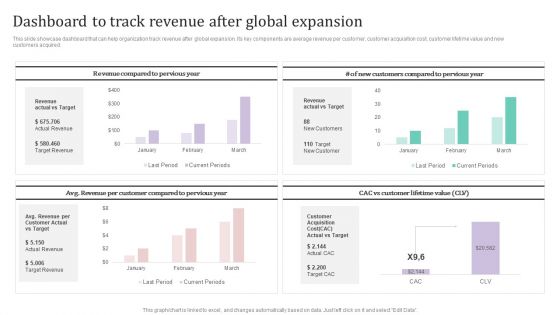
Dashboard To Track Revenue After Global Expansion Ppt PowerPoint Presentation File Example PDF
This slide showcase dashboard that can help organization track revenue after global expansion. Its key components are average revenue per customer, customer acquisition cost, customer lifetime value and new customers acquired.Take your projects to the next level with our ultimate collection of Dashboard To Track Revenue After Global Expansion Ppt PowerPoint Presentation File Example PDF. Slidegeeks has designed a range of layouts that are perfect for representing task or activity duration, keeping track of all your deadlines at a glance. Tailor these designs to your exact needs and give them a truly corporate look with your own brand colors they all make your projects stand out from the rest.

Project Administration Planning Project Requirements Traceability Matrix Business Ppt PowerPoint Presentation File Example PDF
This slide provides the glimpse about the requirements traceability table which focuses on project description, requestor, department, business justification, test strategy, etc. Deliver and pitch your topic in the best possible manner with this project administration planning project requirements traceability matrix business ppt powerpoint presentation file example pdf. Use them to share invaluable insights on dashboard, responsibility, strategy, business, source and impress your audience. This template can be altered and modified as per your expectations. So, grab it now.

 Home
Home