Project Kpi
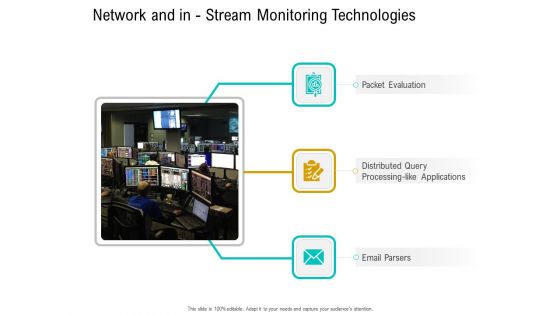
Business Data Analysis Network And In Stream Monitoring Technologies Portrait PDF
This is a business data analysis network and in stream monitoring technologies portrait pdf template with various stages. Focus and dispense information on three stages using this creative set, that comes with editable features. It contains large content boxes to add your information on topics like packet evaluation, distributed query processing like applications, email parsers . You can also showcase facts, figures, and other relevant content using this PPT layout. Grab it now.
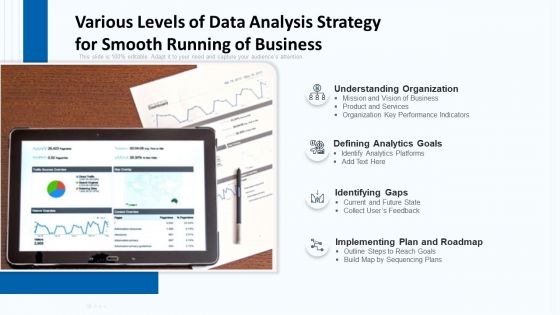
Various Levels Of Data Analysis Strategy For Smooth Running Of Business Inspiration PDF
Persuade your audience using this various levels of data analysis strategy for smooth running of business inspiration pdf.This PPT design covers four stages, thus making it a great tool to use. It also caters to a variety of topics including understanding organization, defining analytics goals, identifying gaps, implementing plan and roadmap. Download this PPT design now to present a convincing pitch that not only emphasizes the topic but also showcases your presentation skills.
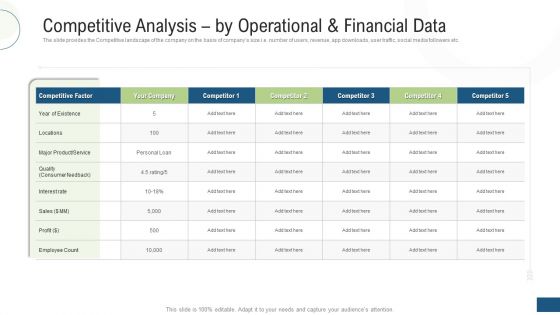
Competitive Analysis By Operational And Financial Data Ppt Outline Graphics Example PDF
The slide provides the Competitive landscape of the company on the basis of companys size i.e. number of users, revenue, app downloads, user traffic, social media followers etc. Deliver an awe inspiring pitch with this creative competitive analysis by operational and financial data ppt outline graphics example pdf bundle. Topics like competitive factor, product service, profit, competitor can be discussed with this completely editable template. It is available for immediate download depending on the needs and requirements of the user.

Five Year Organization Data Analysis Process Enhancement Best Practices Roadmap Rules
Presenting our innovatively structured five year organization data analysis process enhancement best practices roadmap rules Template. Showcase your roadmap process in different formats like PDF, PNG, and JPG by clicking the download button below. This PPT design is available in both Standard Screen and Widescreen aspect ratios. It can also be easily personalized and presented with modified font size, font type, color, and shapes to measure your progress in a clear way.

Six Months Organization Data Analysis Process Enhancement Best Practices Roadmap Inspiration
Presenting our innovatively structured six months organization data analysis process enhancement best practices roadmap inspiration Template. Showcase your roadmap process in different formats like PDF, PNG, and JPG by clicking the download button below. This PPT design is available in both Standard Screen and Widescreen aspect ratios. It can also be easily personalized and presented with modified font size, font type, color, and shapes to measure your progress in a clear way.

Three Months Organization Data Analysis Process Enhancement Best Practices Roadmap Portrait
Presenting our innovatively structured three months organization data analysis process enhancement best practices roadmap portrait Template. Showcase your roadmap process in different formats like PDF, PNG, and JPG by clicking the download button below. This PPT design is available in both Standard Screen and Widescreen aspect ratios. It can also be easily personalized and presented with modified font size, font type, color, and shapes to measure your progress in a clear way.
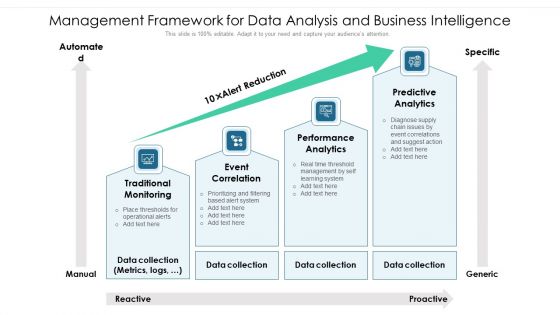
Management Framework For Data Analysis And Business Intelligence Ppt PowerPoint Presentation Layouts Smartart PDF
Persuade your audience using this management framework for data analysis and business intelligence ppt powerpoint presentation layouts smartart pdf. This PPT design covers four stages, thus making it a great tool to use. It also caters to a variety of topics including traditional monitoring, event correlation, performance analytics. Download this PPT design now to present a convincing pitch that not only emphasizes the topic but also showcases your presentation skills.

Half Yearly Development And Strategy Roadmap For Big Data Analysis Ideas
Presenting our innovatively-structured half yearly development and strategy roadmap for big data analysis ideas Template. Showcase your roadmap process in different formats like PDF, PNG, and JPG by clicking the download button below. This PPT design is available in both Standard Screen and Widescreen aspect ratios. It can also be easily personalized and presented with modified font size, font type, color, and shapes to measure your progress in a clear way.
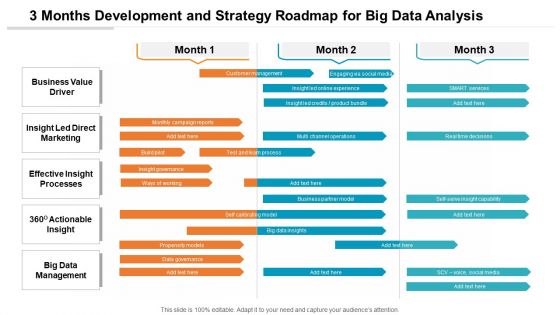
3 Months Development And Strategy Roadmap For Big Data Analysis Background
Presenting our innovatively-structured 3 months development and strategy roadmap for big data analysis background Template. Showcase your roadmap process in different formats like PDF, PNG, and JPG by clicking the download button below. This PPT design is available in both Standard Screen and Widescreen aspect ratios. It can also be easily personalized and presented with modified font size, font type, color, and shapes to measure your progress in a clear way.
3 Months Strategy Roadmap For Data Analysis Integration To Business Icons
Introducing our 3 months strategy roadmap for data analysis integration to business icons. This PPT presentation is Google Slides compatible, therefore, you can share it easily with the collaborators for measuring the progress. Also, the presentation is available in both standard screen and widescreen aspect ratios. So edit the template design by modifying the font size, font type, color, and shapes as per your requirements. As this PPT design is fully editable it can be presented in PDF, JPG and PNG formats.

5 Year Development And Strategy Roadmap For Big Data Analysis Elements
Presenting our innovatively-structured 5 year development and strategy roadmap for big data analysis elements Template. Showcase your roadmap process in different formats like PDF, PNG, and JPG by clicking the download button below. This PPT design is available in both Standard Screen and Widescreen aspect ratios. It can also be easily personalized and presented with modified font size, font type, color, and shapes to measure your progress in a clear way.
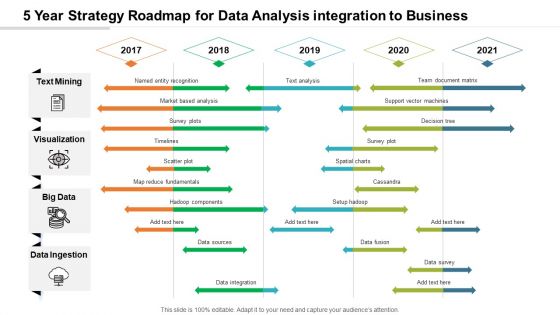
5 Year Strategy Roadmap For Data Analysis Integration To Business Pictures
Introducing our 5 year strategy roadmap for data analysis integration to business pictures. This PPT presentation is Google Slides compatible, therefore, you can share it easily with the collaborators for measuring the progress. Also, the presentation is available in both standard screen and widescreen aspect ratios. So edit the template design by modifying the font size, font type, color, and shapes as per your requirements. As this PPT design is fully editable it can be presented in PDF, JPG and PNG formats.

6 Months Development And Strategy Roadmap For Big Data Analysis Graphics
Presenting our innovatively-structured 6 months development and strategy roadmap for big data analysis graphics Template. Showcase your roadmap process in different formats like PDF, PNG, and JPG by clicking the download button below. This PPT design is available in both Standard Screen and Widescreen aspect ratios. It can also be easily personalized and presented with modified font size, font type, color, and shapes to measure your progress in a clear way.

6 Months Strategy Roadmap For Data Analysis Integration To Business Diagrams
Introducing our 6 months strategy roadmap for data analysis integration to business diagrams. This PPT presentation is Google Slides compatible, therefore, you can share it easily with the collaborators for measuring the progress. Also, the presentation is available in both standard screen and widescreen aspect ratios. So edit the template design by modifying the font size, font type, color, and shapes as per your requirements. As this PPT design is fully editable it can be presented in PDF, JPG and PNG formats.
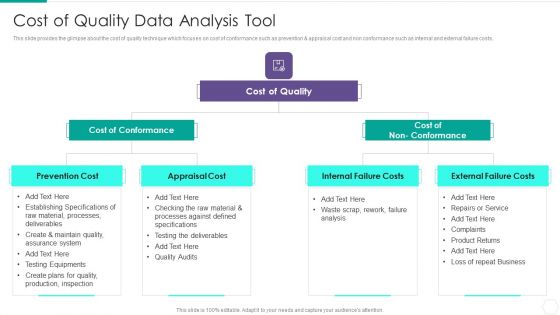
Quantitative Risk Assessment Cost Of Quality Data Analysis Tool Graphics PDF
Presenting Quantitative Risk Assessment Cost Of Quality Data Analysis Tool Graphics PDF to provide visual cues and insights. Share and navigate important information on three stages that need your due attention. This template can be used to pitch topics like Cost Of Conformance, Cost Of Quality, Internal Failure Costs, External Failure Costs, Appraisal Cost. In addtion, this PPT design contains high resolution images, graphics, etc, that are easily editable and available for immediate download.
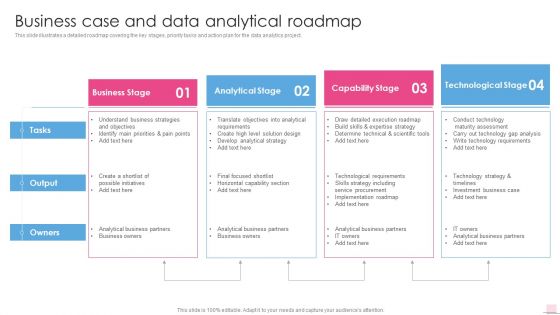
Business Case And Data Analytical Roadmap Business Analysis Modification Toolkit Structure PDF
Presenting Business Case And Data Analytical Roadmap Business Analysis Modification Toolkit Structure PDF to provide visual cues and insights. Share and navigate important information on four stages that need your due attention. This template can be used to pitch topics like Understand Business, Possible Initiatives, Business Partners. In addtion, this PPT design contains high resolution images, graphics, etc, that are easily editable and available for immediate download.
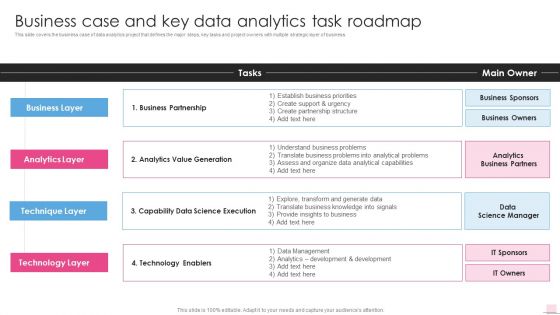
Business Case And Key Data Analytics Task Roadmap Business Analysis Modification Toolkit Information PDF
This is a Business Case And Key Data Analytics Task Roadmap Business Analysis Modification Toolkit Information PDF template with various stages. Focus and dispense information on four stages using this creative set, that comes with editable features. It contains large content boxes to add your information on topics like Business Partners, Business Sponsors, Business Owners. You can also showcase facts, figures, and other relevant content using this PPT layout. Grab it now.

Business Case And Roadmap For Data Analytics Business Analysis Modification Toolkit Portrait PDF
Presenting Business Case And Roadmap For Data Analytics Business Analysis Modification Toolkit Portrait PDF to provide visual cues and insights. Share and navigate important information on five stages that need your due attention. This template can be used to pitch topics like Vision Objectives, Analytical Capabilities, Business Partners. In addtion, this PPT design contains high resolution images, graphics, etc, that are easily editable and available for immediate download.

Business Data Analytics Requirement Table Business Analysis Modification Toolkit Rules PDF
This is a Business Data Analytics Requirement Table Business Analysis Modification Toolkit Rules PDF template with various stages. Focus and dispense information on six stages using this creative set, that comes with editable features. It contains large content boxes to add your information on topics like Contribution Performance, Category Performance, Category Scorecarding. You can also showcase facts, figures, and other relevant content using this PPT layout. Grab it now.
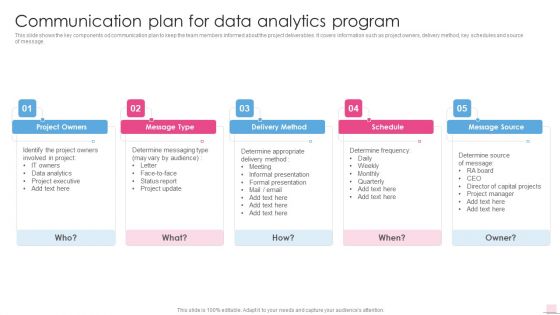
Communication Plan For Data Analytics Program Business Analysis Modification Toolkit Formats PDF
Presenting Communication Plan For Data Analytics Program Business Analysis Modification Toolkit Formats PDF to provide visual cues and insights. Share and navigate important information on five stages that need your due attention. This template can be used to pitch topics like Determine Messaging, Informal Presentation, Formal Presentation. In addtion, this PPT design contains high resolution images, graphics, etc, that are easily editable and available for immediate download.
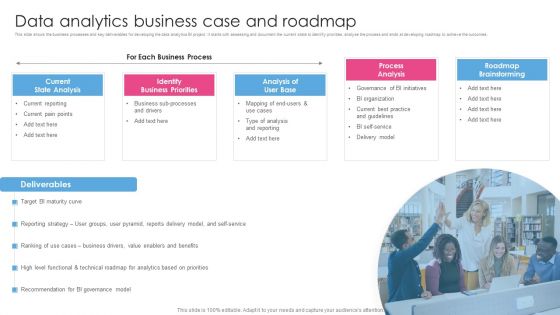
Data Analytics Business Case And Roadmap Business Analysis Modification Toolkit Diagrams PDF
Presenting Data Analytics Business Case And Roadmap Business Analysis Modification Toolkit Diagrams PDF to provide visual cues and insights. Share and navigate important information on one stage that need your due attention. This template can be used to pitch topics like Identify Business, Governance Initiatives, Governance Model. In addtion, this PPT design contains high resolution images, graphics, etc, that are easily editable and available for immediate download.

Data Analytics Software Vendor Profile Business Analysis Modification Toolkit Diagrams PDF
This slide shows the vendor profile matrix. It contains multiple features that can be scored and weighted to evaluate the vendors capability to deliver the software.Deliver an awe inspiring pitch with this creative Data Analytics Software Vendor Profile Business Analysis Modification Toolkit Diagrams PDF bundle. Topics like Independent Industry, Implementation Support, Infrastructure Support can be discussed with this completely editable template. It is available for immediate download depending on the needs and requirements of the user.

Vendor Profile For Data Analytics Software Business Analysis Modification Toolkit Rules PDF
This slide represents the list of vendors along with accompanying information including the key features, pros and cons of each vendor software.Deliver and pitch your topic in the best possible manner with this Vendor Profile For Data Analytics Software Business Analysis Modification Toolkit Rules PDF. Use them to share invaluable insights on Company Information, Terms Conditions, process comprehensive and impress your audience. This template can be altered and modified as per your expectations. So, grab it now.

Vendor Scan Selection Score Sheet For Data Analytics Software Business Analysis Modification Toolkit Mockup PDF
This is a Vendor Scan Selection Score Sheet For Data Analytics Software Business Analysis Modification Toolkit Mockup PDF template with various stages. Focus and dispense information on one stage using this creative set, that comes with editable features. It contains large content boxes to add your information on topics like Vendor Strength, Architecture, Excellent. You can also showcase facts, figures, and other relevant content using this PPT layout. Grab it now.

Comparision Matrix To Select Best Quantitative Data Analysis Software Download PDF
Persuade your audience using this Comparision Matrix To Select Best Quantitative Data Analysis Software Download PDF. This PPT design covers six stages, thus making it a great tool to use. It also caters to a variety of topics including Manufacturer, Platform, Licensing, Features, Costing. Download this PPT design now to present a convincing pitch that not only emphasizes the topic but also showcases your presentation skills.

Target Customer Analysis Collecting Data For Target Market Assessment Summary PDF
Slidegeeks is one of the best resources for PowerPoint templates. You can download easily and regulate Target Customer Analysis Collecting Data For Target Market Assessment Summary PDF for your personal presentations from our wonderful collection. A few clicks is all it takes to discover and get the most relevant and appropriate templates. Use our Templates to add a unique zing and appeal to your presentation and meetings. All the slides are easy to edit and you can use them even for advertisement purposes.

Guidebook For Executing Business Market Intelligence Data Evaluation With Maxdiff Analysis Method Designs PDF
Make sure to capture your audiences attention in your business displays with our gratis customizable Guidebook For Executing Business Market Intelligence Data Evaluation With Maxdiff Analysis Method Designs PDF. These are great for business strategies, office conferences, capital raising or task suggestions. If you desire to acquire more customers for your tech business and ensure they stay satisfied, create your own sales presentation with these plain slides.

Ml And Big Data In Information Technology Processes Competitive Analysis Of Aiop Market Designs PDF
The purpose of the following slide is to show the nature of the Artificial Intelligence in IT operation market, and it highlights the key players of the market. There are so many reasons you need a Ml And Big Data In Information Technology Processes Competitive Analysis Of Aiop Market Designs PDF. The first reason is you cannot spend time making everything from scratch, Thus, Slidegeeks has made presentation templates for you too. You can easily download these templates from our website easily.
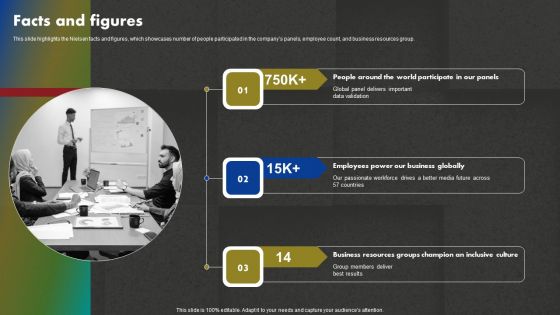
Data And Customer Analysis Company Outline Facts And Figures Topics PDF
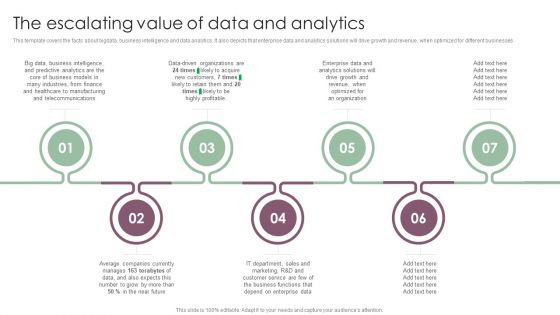
Information Analysis And BI Playbook The Escalating Value Of Data And Analytics Download PDF
This template covers the facts about bigdata, business intelligence and data analytics. It also depicts that enterprise data and analytics solutions will drive growth and revenue, when optimized for different businesses. Slidegeeks is here to make your presentations a breeze with Information Analysis And BI Playbook The Escalating Value Of Data And Analytics Download PDF With our easy to use and customizable templates, you can focus on delivering your ideas rather than worrying about formatting. With a variety of designs to choose from, you are sure to find one that suits your needs. And with animations and unique photos, illustrations, and fonts, you can make your presentation pop. So whether you are giving a sales pitch or presenting to the board, make sure to check out Slidegeeks first.

Marketers Guide To Data Analysis Optimization Top Marketing Analytics Challenges Faced By Companies Formats PDF
This slide covers significant issues faced by organizations while using marketing analytics. It includes problems such as collecting the correct data, determining how to use data, identifying the correct KPIs, converting leads to revenue, and identifying market trends. Boost your pitch with our creative Marketers Guide To Data Analysis Optimization Top Marketing Analytics Challenges Faced By Companies Formats PDF. Deliver an awe-inspiring pitch that will mesmerize everyone. Using these presentation templates you will surely catch everyones attention. You can browse the ppts collection on our website. We have researchers who are experts at creating the right content for the templates. So you do not have to invest time in any additional work. Just grab the template now and use them.
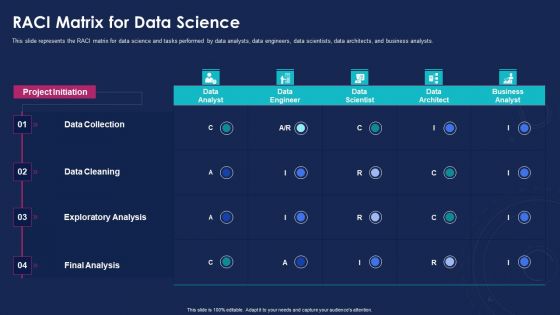
Data Analytics IT RACI Matrix For Data Science Ppt File Maker PDF
This slide represents the RACI matrix for data science and tasks performed by data analysts, data engineers, data scientists, data architects, and business analysts. Deliver and pitch your topic in the best possible manner with this data analytics it raci matrix for data science ppt file maker pdf. Use them to share invaluable insights on data collection, data cleaning, exploratory analysis, final analysis and impress your audience. This template can be altered and modified as per your expectations. So, grab it now.
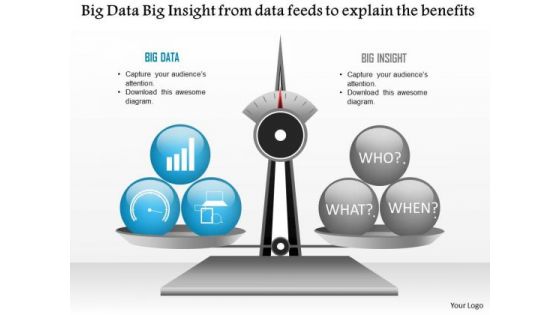
Business Diagram Big Data Big Insight From Data Feeds To Explain The Benefits Ppt Slide
Explain the benefits of big data analysis and data feeds with this technology diagram. This slide contains the graphic of scale with big data and big insight. Use this slide your data information and measurement related presentations.

Layout For Precentage Data Display PowerPoint Template
Growth analysis for business can be defined with this business diagram. This slide depicts text boxes in increasing flow. Present your views using this innovative slide and be assured of leaving a lasting impression
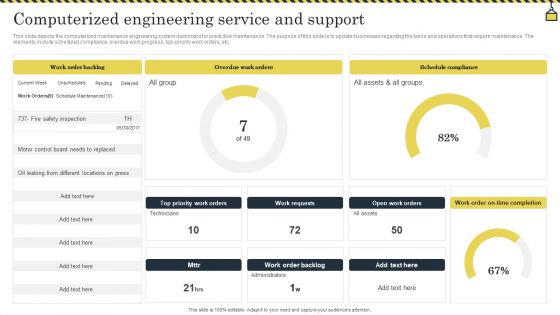
Computerized Engineering Service And Support Graphics PDF
This slide depicts the computerized maintenance engineering system dashboard for predictive maintenance. The purpose of this slide is to update businesses regarding the tasks and operations that require maintenance. The elements include scheduled compliance, overdue work progress, top priority work orders, etc. Showcasing this set of slides titled Computerized Engineering Service And Support Graphics PDF. The topics addressed in these templates are Administrators, Locations, Technicians. All the content presented in this PPT design is completely editable. Download it and make adjustments in color, background, font etc. as per your unique business setting.

Qualitative Data Process Sample Diagram Example
This is a qualitative data process sample diagram example. This is a three stage process. The stages in this process are data collection, process data, analysis data, listen, observe, interview, audio recording, visual recording, jotted notes, field notes, sort and classify, open coding, axial coding, selective coding, processed data.
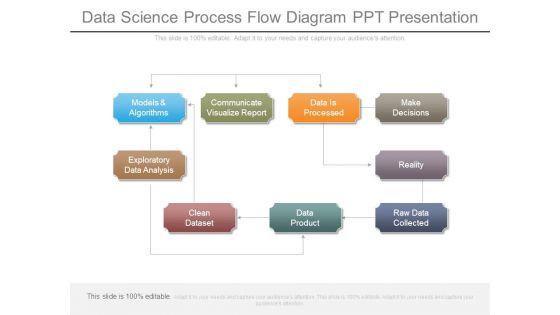
Data Science Process Flow Diagram Ppt Presentation
This is a data science process flow diagram ppt presentation. This is a nine stage process. The stages in this process are models and algorithms, communicate visualize report, data is processed, make decisions, exploratory data analysis, clean dataset, data product, raw data collected, reality.
Annual Financial Data Insights Dashboard Icon Introduction PDF
Showcasing this set of slides titled Annual Financial Data Insights Dashboard Icon Introduction PDF. The topics addressed in these templates are Annual Financial, Data Insights, Dashboard. All the content presented in this PPT design is completely editable. Download it and make adjustments in color, background, font etc. as per your unique business setting.
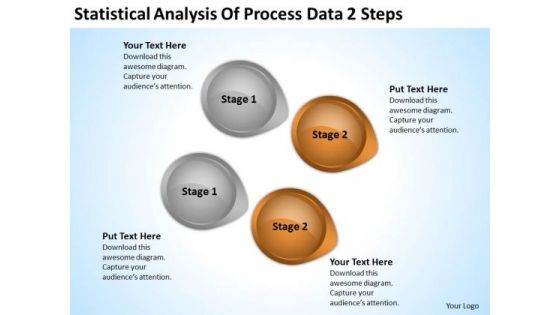
Arrow In PowerPoint Statistical Analysis Of Process Data 2 Steps Ppt Slide
We present our arrow in powerpoint statistical analysis of process data 2 steps ppt Slide.Download our Business PowerPoint Templates because Our PowerPoint Templates and Slides will weave a web of your great ideas. They are gauranteed to attract even the most critical of your colleagues. Use our Circle Charts PowerPoint Templates because Our PowerPoint Templates and Slides will let your words and thoughts hit bullseye everytime. Download our Arrows PowerPoint Templates because Our PowerPoint Templates and Slides will let you Hit the right notes. Watch your audience start singing to your tune. Download and present our Shapes PowerPoint Templates because You have the co-ordinates for your destination of success. Let our PowerPoint Templates and Slides map out your journey. Download and present our Signs PowerPoint Templates because It will let you Set new benchmarks with our PowerPoint Templates and Slides. They will keep your prospects well above par.Use these PowerPoint slides for presentations relating to 3d, abstract, analysis, arrow, background, business, button, chart, circle, circular, color, concept, conservation, cycle, development, diagram, direction, eco, ecology, energy, environment, flow, flowchart, globe, graphic, growing, growth, icon, internet, isolated, object, power, process, protection, recyclable, recycle, recycling, render, resource, saving, sign, solution, sphere, statistic, sustainable, symbol, technology, white. The prominent colors used in the PowerPoint template are Brown, Gray, Black. You can be sure our arrow in powerpoint statistical analysis of process data 2 steps ppt Slide are designed by professionals People tell us our button PowerPoint templates and PPT Slides will make the presenter look like a pro even if they are not computer savvy. You can be sure our arrow in powerpoint statistical analysis of process data 2 steps ppt Slide are designed by professionals Use our arrow PowerPoint templates and PPT Slides have awesome images to get your point across. Presenters tell us our arrow in powerpoint statistical analysis of process data 2 steps ppt Slide will make the presenter successul in his career/life. We assure you our arrow PowerPoint templates and PPT Slides are visually appealing.

How Experian Reduces Turnover Rate In Organisation Analysing Hr Data For Effective Decision Making
This slide covers a case study of Experian organization that tackles high employee turnover issues through hr analysis. It includes the main issue, factor analysis, strategies implementation, benefits to the business. Explore a selection of the finest How Experian Reduces Turnover Rate In Organisation Analysing Hr Data For Effective Decision Making here. With a plethora of professionally designed and pre-made slide templates, you can quickly and easily find the right one for your upcoming presentation. You can use our How Experian Reduces Turnover Rate In Organisation Analysing Hr Data For Effective Decision Making to effectively convey your message to a wider audience. Slidegeeks has done a lot of research before preparing these presentation templates. The content can be personalized and the slides are highly editable. Grab templates today from Slidegeeks.
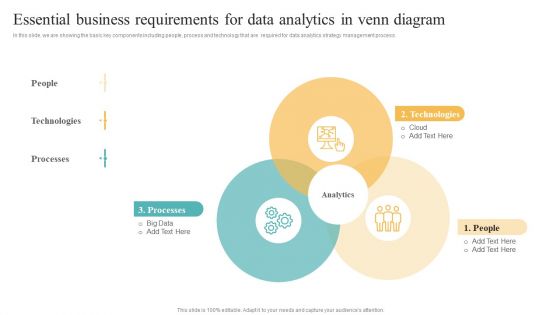
Transformation Toolkit Competitive Intelligence Information Analysis Essential Business Requirements For Data Analytics Summary PDF
In this slide, we are showing the basic key components including people, process and technology that are required for data analytics strategy management process. Present like a pro with Transformation Toolkit Competitive Intelligence Information Analysis Essential Business Requirements For Data Analytics Summary PDF Create beautiful presentations together with your team, using our easy to use presentation slides. Share your ideas in real time and make changes on the fly by downloading our templates. So whether you are in the office, on the go, or in a remote location, you can stay in sync with your team and present your ideas with confidence. With Slidegeeks presentation got a whole lot easier. Grab these presentations today.
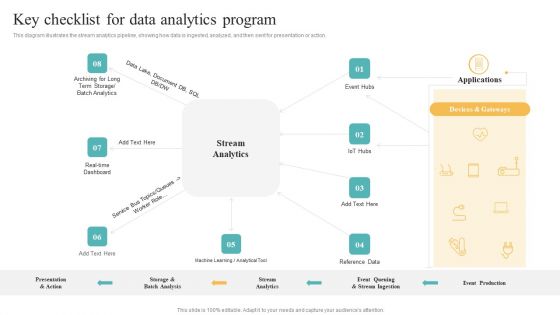
Transformation Toolkit Competitive Intelligence Information Analysis Key Checklist For Data Analytics Program Action Guidelines PDF
This diagram illustrates the stream analytics pipeline, showing how data is ingested, analyzed, and then sent for presentation or action. Slidegeeks is here to make your presentations a breeze with Transformation Toolkit Competitive Intelligence Information Analysis Key Checklist For Data Analytics Program Action Guidelines PDF With our easy to use and customizable templates, you can focus on delivering your ideas rather than worrying about formatting. With a variety of designs to choose from, you are sure to find one that suits your needs. And with animations and unique photos, illustrations, and fonts, you can make your presentation pop. So whether you are giving a sales pitch or presenting to the board, make sure to check out Slidegeeks first.

Marketers Guide To Data Analysis And Optimization Ppt PowerPoint Presentation Complete Deck With Slides
With well-researched insights and carefully constructed design, this Marketers Guide To Data Analysis And Optimization Ppt PowerPoint Presentation Complete Deck With Slides is all that you need for your next business meeting with clients and win them over. Add your data to graphs, charts, and tables that are already ready to display it with stunning visuals and help your audience recall your work. With this PPT Complete Deck, you will be able to display your knowledge of the subject as well as your skills as a communicator. Share your ideas and make an impact on the audience with this PowerPoint Layout and ensure that you are known as a presentation professional. Download this PPT Template Bundle to create the most interesting presentation anyone has ever seen.
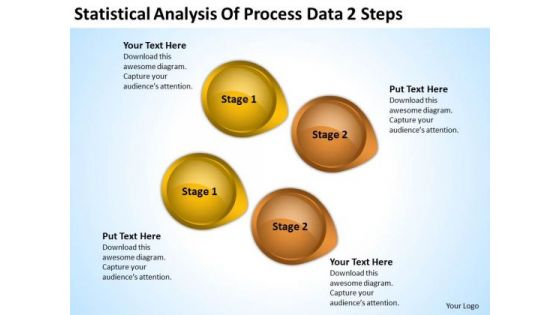
Power Point Arrows Statistical Analysis Of Process Data 2 Steps PowerPoint Templates
We present our power point arrows statistical analysis of process data 2 steps PowerPoint templates.Download and present our Business PowerPoint Templates because It is Aesthetically crafted by artistic young minds. Our PowerPoint Templates and Slides are designed to display your dexterity. Present our Arrows PowerPoint Templates because You can Rise to the occasion with our PowerPoint Templates and Slides. You will bring your audience on their feet in no time. Download and present our Circle Charts PowerPoint Templates because Our PowerPoint Templates and Slides help you pinpoint your timelines. Highlight the reasons for your deadlines with their use. Present our Shapes PowerPoint Templates because You aspire to touch the sky with glory. Let our PowerPoint Templates and Slides provide the fuel for your ascent. Present our Symbol PowerPoint Templates because You have gained great respect for your brilliant ideas. Use our PowerPoint Templates and Slides to strengthen and enhance your reputation.Use these PowerPoint slides for presentations relating to abstract, arrow, art, background, banner, blue, bright, business, circle, color, colorful, concept, conceptual, connection, creative, cycle, design, different, element, empty, flower, form, frame, graphic, green, group, idea, illustration, match, message, order, part, petal, piece, place, red, ring, shape, solution, special, speech, strategy, symbol, template, text, usable, vector, web, website. The prominent colors used in the PowerPoint template are Yellow, Brown, Black. People tell us our power point arrows statistical analysis of process data 2 steps PowerPoint templates will impress their bosses and teams. People tell us our circle PowerPoint templates and PPT Slides are designed by professionals Presenters tell us our power point arrows statistical analysis of process data 2 steps PowerPoint templates are second to none. We assure you our banner PowerPoint templates and PPT Slides will make the presenter successul in his career/life. Presenters tell us our power point arrows statistical analysis of process data 2 steps PowerPoint templates will help you be quick off the draw. Just enter your specific text and see your points hit home. Professionals tell us our background PowerPoint templates and PPT Slides will make the presenter look like a pro even if they are not computer savvy.

Half Yearly Organization Data Analysis Process Enhancement Best Practices Roadmap Portrait
Presenting the half yearly organization data analysis process enhancement best practices roadmap portrait. The template includes a roadmap that can be used to initiate a strategic plan. Not only this, the PowerPoint slideshow is completely editable and you can effortlessly modify the font size, font type, and shapes according to your needs. This PPT slide can be easily reached in standard screen and widescreen aspect ratios. The set is also available in various formats like PDF, PNG, and JPG. So download and use it multiple times as per your knowledge.

Advanced Service Data Analysis Ppt PowerPoint Presentation Complete Deck With Slides
This complete deck covers various topics and highlights important concepts. It has PPT slides which cater to your business needs. This complete deck presentation emphasizes advanced service data analysis ppt powerpoint presentation complete deck with slides and has templates with professional background images and relevant content. This deck consists of total of fortynine slides. Our designers have created customizable templates, keeping your convenience in mind. You can edit the colour, text and font size with ease. Not just this, you can also add or delete the content if needed. Get access to this fully editable complete presentation by clicking the download button below.
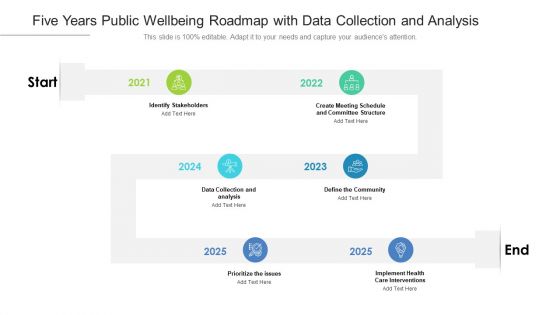
Five Years Public Wellbeing Roadmap With Data Collection And Analysis Topics
Presenting the five years public wellbeing roadmap with data collection and analysis topics. The template includes a roadmap that can be used to initiate a strategic plan. Not only this, the PowerPoint slideshow is completely editable and you can effortlessly modify the font size, font type, and shapes according to your needs. This PPT slide can be easily reached in standard screen and widescreen aspect ratios. The set is also available in various formats like PDF, PNG, and JPG. So download and use it multiple times as per your knowledge.

Half Yearly Public Wellbeing Roadmap With Data Collection And Analysis Graphics
Presenting the half yearly public wellbeing roadmap with data collection and analysis graphics. The template includes a roadmap that can be used to initiate a strategic plan. Not only this, the PowerPoint slideshow is completely editable and you can effortlessly modify the font size, font type, and shapes according to your needs. This PPT slide can be easily reached in standard screen and widescreen aspect ratios. The set is also available in various formats like PDF, PNG, and JPG. So download and use it multiple times as per your knowledge.

Six Months Public Wellbeing Roadmap With Data Collection And Analysis Clipart
Presenting the six months public wellbeing roadmap with data collection and analysis clipart. The template includes a roadmap that can be used to initiate a strategic plan. Not only this, the PowerPoint slideshow is completely editable and you can effortlessly modify the font size, font type, and shapes according to your needs. This PPT slide can be easily reached in standard screen and widescreen aspect ratios. The set is also available in various formats like PDF, PNG, and JPG. So download and use it multiple times as per your knowledge.

Three Months Public Wellbeing Roadmap With Data Collection And Analysis Guidelines
Presenting the three months public wellbeing roadmap with data collection and analysis guidelines. The template includes a roadmap that can be used to initiate a strategic plan. Not only this, the PowerPoint slideshow is completely editable and you can effortlessly modify the font size, font type, and shapes according to your needs. This PPT slide can be easily reached in standard screen and widescreen aspect ratios. The set is also available in various formats like PDF, PNG, and JPG. So download and use it multiple times as per your knowledge.
Business Operation Modeling Approaches Cost Of Quality Data Analysis Tool Icons PDF
This slide provides the glimpse about the cost of quality technique which focuses on cost of conformance such as prevention and appraisal cost and non conformance such as internal and external failure costs.This is a business operation modeling approaches cost of quality data analysis tool icons pdf template with various stages. Focus and dispense information on two stages using this creative set, that comes with editable features. It contains large content boxes to add your information on topics like cost of quality, cost of conformance, external failure costs You can also showcase facts, figures, and other relevant content using this PPT layout. Grab it now.
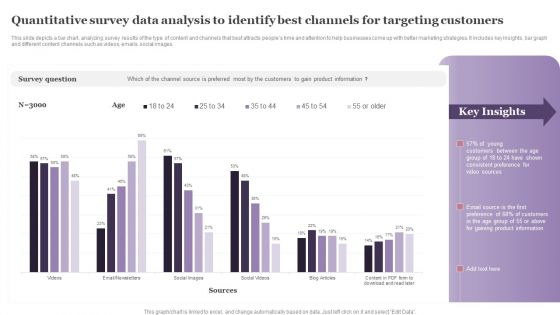
Quantitative Survey Data Analysis To Identify Best Channels For Targeting Customers Formats PDF
This slide depicts a bar chart, analyzing survey results of the type of content and channels that best attracts peoples time and attention to help businesses come up with better marketing strategies. It includes key insights, bar graph and different content channels such as videos, emails, social images. Pitch your topic with ease and precision using this Quantitative Survey Data Analysis To Identify Best Channels For Targeting Customers Formats PDF. This layout presents information on Survey Question, Young Customers, Consistent Preference. It is also available for immediate download and adjustment. So, changes can be made in the color, design, graphics or any other component to create a unique layout.
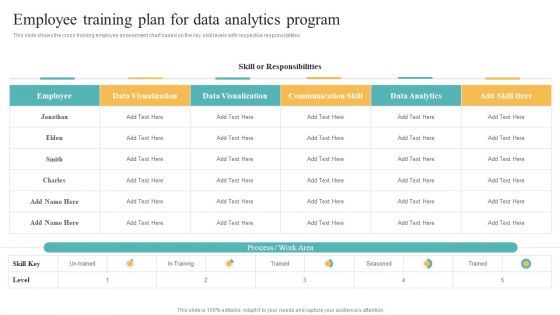
Transformation Toolkit Competitive Intelligence Information Analysis Employee Training Plan For Data Analytics Program Background PDF
This slide shows the cross training employee assessment chart based on the key skill levels with respective responsibilities. From laying roadmaps to briefing everything in detail, our templates are perfect for you. You can set the stage with your presentation slides. All you have to do is download these easy to edit and customizable templates. Transformation Toolkit Competitive Intelligence Information Analysis Employee Training Plan For Data Analytics Program Background PDF will help you deliver an outstanding performance that everyone would remember and praise you for. Do download this presentation today.
Marketers Guide To Data Analysis Optimization Tracking Unsubscribe Rate For Improving Email Content Infographics PDF
This slide covers an overview of the unsubscribe rate to identify the percentage of recipients that opt out of the mailing list. It also includes strategies to reduce unsubscribe rates, such as creating an optimized list, using automation, etc. From laying roadmaps to briefing everything in detail, our templates are perfect for you. You can set the stage with your presentation slides. All you have to do is download these easy to edit and customizable templates. Marketers Guide To Data Analysis Optimization Tracking Unsubscribe Rate For Improving Email Content Infographics PDF will help you deliver an outstanding performance that everyone would remember and praise you for. Do download this presentation today.
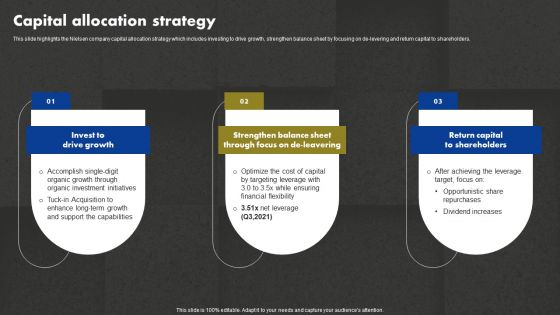
Data And Customer Analysis Company Outline Capital Allocation Strategy Information PDF
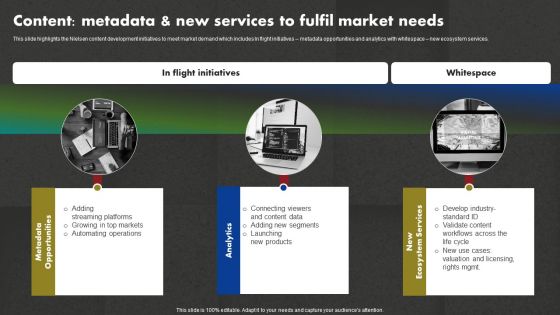
Data And Customer Analysis Company Outline Content Metadata And New Services Infographics PDF
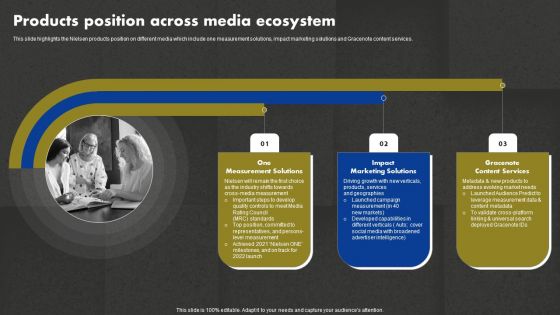
Data And Customer Analysis Company Outline Products Position Across Media Ecosystem Rules PDF
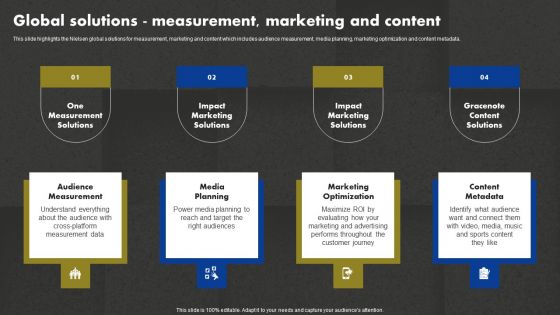
Data And Customer Analysis Company Outline Global Solutions Measurement Marketing Information PDF

Data And Customer Analysis Company Outline Diversified And Growing Business Elements PDF
This slide highlights the Nielsen diversified and growing business which includes solutions revenue share, customer base and revenue by geography, contracted revenue and years of experience. Find a pre designed and impeccable Data And Customer Analysis Company Outline Diversified And Growing Business Elements PDF. The templates can ace your presentation without additional effort. You can download these easy to edit presentation templates to make your presentation stand out from others. So, what are you waiting for Download the template from Slidegeeks today and give a unique touch to your presentation.

Data And Customer Analysis Company Outline Earning Per Share Free Cash Flow And EBITDA Structure PDF
This slide highlights the Nielsen Adj EBITDA margin, free cash flow, earnings per share, and organic constant currency revenue growth of the financial year 2021 with margin trend. Boost your pitch with our creative Data And Customer Analysis Company Outline Earning Per Share Free Cash Flow And EBITDA Structure PDF. Deliver an awe-inspiring pitch that will mesmerize everyone. Using these presentation templates you will surely catch everyones attention. You can browse the ppts collection on our website. We have researchers who are experts at creating the right content for the templates. So you do not have to invest time in any additional work. Just grab the template now and use them.

 Home
Home