Project Kpi
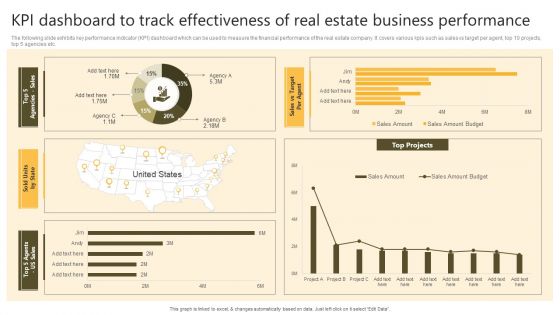
Successful Risk Administration KPI Dashboard To Track Effectiveness Of Real Estate Business Template PDF
The following slide exhibits key performance indicator KPI dashboard which can be used to measure the financial performance of the real estate company. It covers various kpis such as sales vs target per agent, top 10 projects, top 5 agencies etc. If your project calls for a presentation, then Slidegeeks is your go-to partner because we have professionally designed, easy-to-edit templates that are perfect for any presentation. After downloading, you can easily edit Successful Risk Administration KPI Dashboard To Track Effectiveness Of Real Estate Business Template PDF and make the changes accordingly. You can rearrange slides or fill them with different images. Check out all the handy templates.
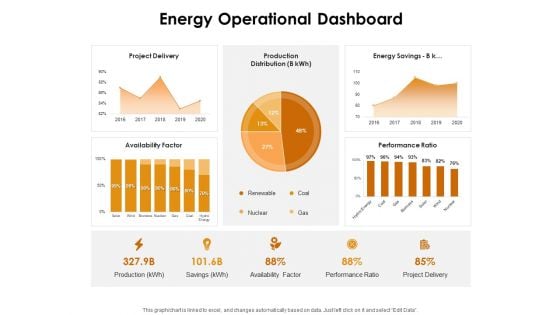
KPI Dashboards Per Industry Energy Operational Dashboard Ppt PowerPoint Presentation Outline Shapes PDF
Deliver and pitch your topic in the best possible manner with this kpi dashboards per industry energy operational dashboard ppt powerpoint presentation outline shapes pdf. Use them to share invaluable insights on project delivery, production distribution, energy savings, availability factor, coal, gas and impress your audience. This template can be altered and modified as per your expectations. So, grab it now.
Functional Analysis Of Business Operations Infrastructure KPI Dashboard Showing Resource Allocation Icons PDF
Presenting this set of slides with name functional analysis of business operations infrastructure kpi dashboard showing resource allocation icons pdf. The topics discussed in these slides are project financial, resource allocation, timeline. This is a completely editable PowerPoint presentation and is available for immediate download. Download now and impress your audience.
Energy Tracking Device KPI Dashboard Performance Ppt PowerPoint Presentation File Good PDF
Deliver an awe-inspiring pitch with this creative energy tracking device kpi dashboard performance ppt powerpoint presentation file good pdf bundle. Topics like project delivery, production distribution, energy savings, availability factor, performance ratio can be discussed with this completely editable template. It is available for immediate download depending on the needs and requirements of the user.
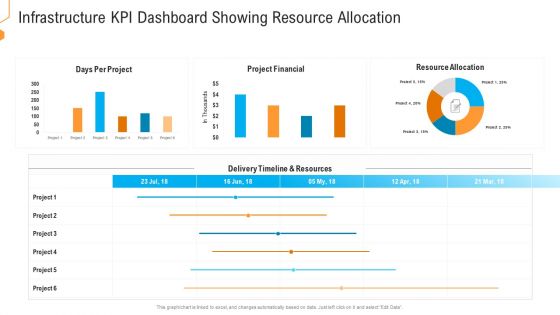
Civil Infrastructure Designing Services Management Infrastructure Kpi Dashboard Showing Resource Allocation Diagrams PDF
Deliver and pitch your topic in the best possible manner with this civil infrastructure designing services management infrastructure kpi dashboard showing resource allocation diagrams pdf. Use them to share invaluable insights on project financial, resource allocation, resources and impress your audience. This template can be altered and modified as per your expectations. So, grab it now.
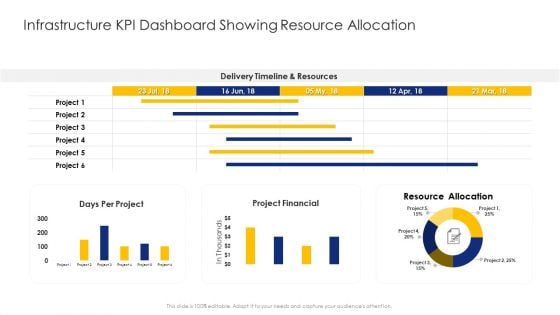
Construction Engineering And Industrial Facility Management Infrastructure KPI Dashboard Showing Resource Allocation Sample PDF
Deliver an awe-inspiring pitch with this creative construction engineering and industrial facility management infrastructure kpi dashboard showing resource allocation sample pdf bundle. Topics like delivery timeline and resources, resource allocation, project financial can be discussed with this completely editable template. It is available for immediate download depending on the needs and requirements of the user.
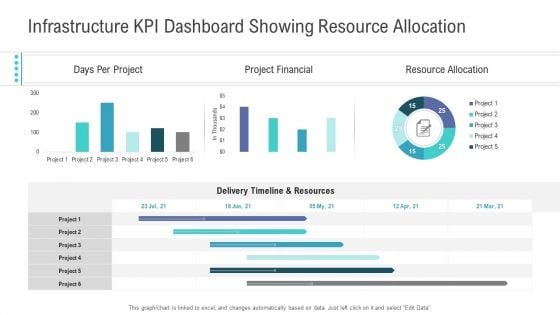
Financial Functional Assessment Infrastructure KPI Dashboard Showing Resource Allocation Ideas PDF
Deliver an awe-inspiring pitch with this creative financial functional assessment infrastructure kpi dashboard showing resource allocation ideas pdf bundle. Topics like resource allocation, project financial, delivery timeline, resources can be discussed with this completely editable template. It is available for immediate download depending on the needs and requirements of the user.
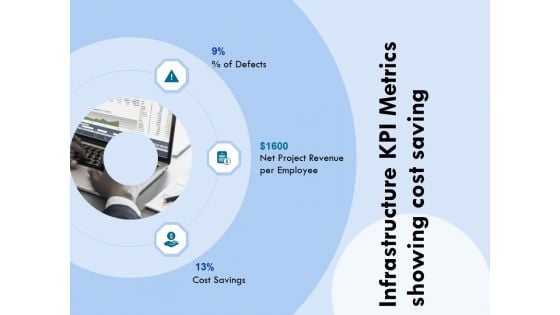
Functional Analysis Of Business Operations Infrastructure KPI Metrics Showing Cost Saving Demonstration PDF
Presenting this set of slides with name functional analysis of business operations infrastructure kpi metrics showing cost saving demonstration pdf. This is a three stage process. The stages in this process are project revenue, employee, cost savings. This is a completely editable PowerPoint presentation and is available for immediate download. Download now and impress your audience.

Facility Operations Contol Infrastructure Kpi Metrics Showing Cost Saving Information PDF
Presenting this set of slides with name facility operations contol infrastructure kpi metrics showing cost saving information pdf. This is a three stage process. The stages in this process are net project revenue per employee, cost savings, defects. This is a completely editable PowerPoint presentation and is available for immediate download. Download now and impress your audience.
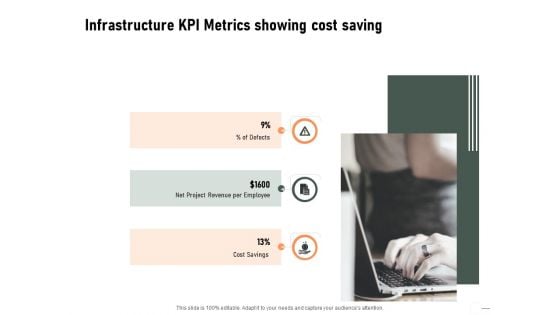
Construction Production Facilities Infrastructure KPI Metrics Showing Cost Saving Background PDF
Presenting this set of slides with name construction production facilities infrastructure kpi metrics showing cost saving background pdf. This is a three stage process. The stages in this process are net project revenue per employee, cost savings, defects. This is a completely editable PowerPoint presentation and is available for immediate download. Download now and impress your audience.
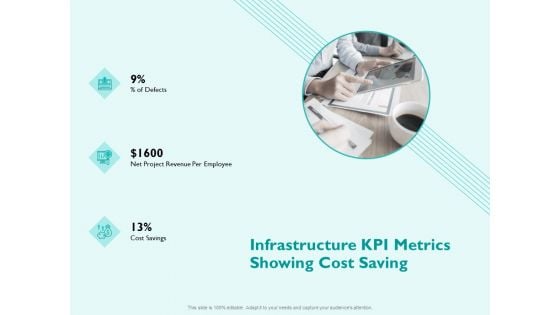
Managing IT Operating System Infrastructure KPI Metrics Showing Cost Saving Slides PDF
Presenting this set of slides with name managing it operating system infrastructure kpi metrics showing cost saving slides pdf. This is a three stage process. The stages in this process are defects, net project revenue per employee, cost savings. This is a completely editable PowerPoint presentation and is available for immediate download. Download now and impress your audience.

Firm KPI Dashboard With Schedule Performance Index Ppt Visual Aids PDF
This graph or chart is linked to excel, and changes automatically based on data. Just left click on it and select Edit Data. Pitch your topic with ease and precision using this Firm KPI Dashboard With Schedule Performance Index Ppt Visual Aids PDF. This layout presents information on Project Cost Performance, Project Planning Stage, Monitor And Control. It is also available for immediate download and adjustment. So, changes can be made in the color, design, graphics or any other component to create a unique layout.
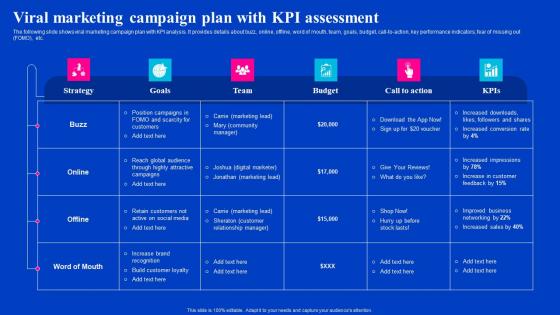
Viral Marketing Campaign Plan With KPI Assessment Viral Video Outreach Plan Template Pdf
The following slide shows viral marketing campaign plan with KPI analysis. It provides details about buzz, online, offline, word of mouth, team, goals, budget, call-to-action, key performance indicators, fear of missing out FOMO, etc. If your project calls for a presentation, then Slidegeeks is your go-to partner because we have professionally designed, easy-to-edit templates that are perfect for any presentation. After downloading, you can easily edit Viral Marketing Campaign Plan With KPI Assessment Viral Video Outreach Plan Template Pdf and make the changes accordingly. You can rearrange slides or fill them with different images. Check out all the handy templates
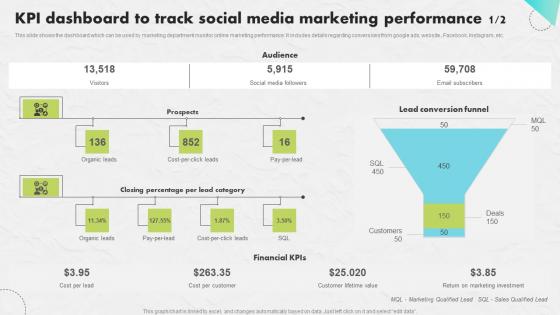
KPI Dashboard Track Social Developing An Impactful SEO Marketing Plan Graphics Pdf
This slide shows the dashboard which can be used by marketing department monitor online marketing performance. It includes details regarding conversions from google ads, website , Facebook, Instagram, etc. If your project calls for a presentation, then Slidegeeks is your go to partner because we have professionally designed, easy to edit templates that are perfect for any presentation. After downloading, you can easily edit KPI Dashboard Track Social Developing An Impactful SEO Marketing Plan Graphics Pdf and make the changes accordingly. You can rearrange slides or fill them with different images. Check out all the handy templates
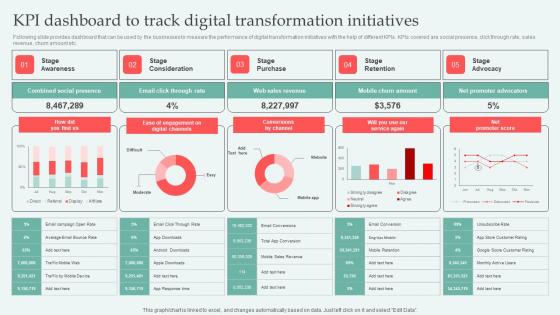
KPI Dashboard To Track Digital Approaches To Increase Business Growth Professional Pdf
Following slide provides dashboard that can be used by the businesses to measure the performance of digital transformation initiatives with the help of different KPIs. KPIs covered are social presence, click through rate, sales revenue, churn amount etc. If your project calls for a presentation, then Slidegeeks is your go to partner because we have professionally designed, easy to edit templates that are perfect for any presentation. After downloading, you can easily edit KPI Dashboard To Track Digital Approaches To Increase Business Growth Professional Pdf and make the changes accordingly. You can rearrange slides or fill them with different images. Check out all the handy templates
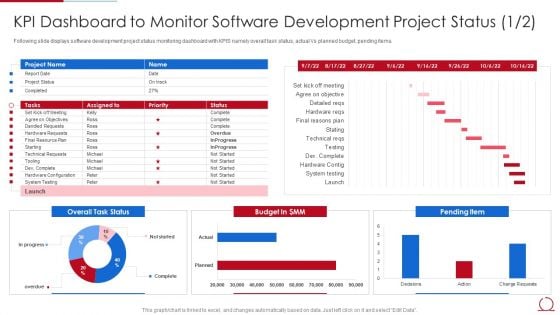
Quality Assurance Model For Agile IT KPI Dashboard To Monitor Software Development Elements PDF
Following slide displays software development project status monitoring dashboard with KPIS namely overall task status, actual Vs planned budget, pending items. Deliver an awe inspiring pitch with this creative quality assurance model for agile it kpi dashboard to monitor software development elements pdf bundle. Topics like overall task status, budget in dollar mm, pending item, technical requests can be discussed with this completely editable template. It is available for immediate download depending on the needs and requirements of the user.
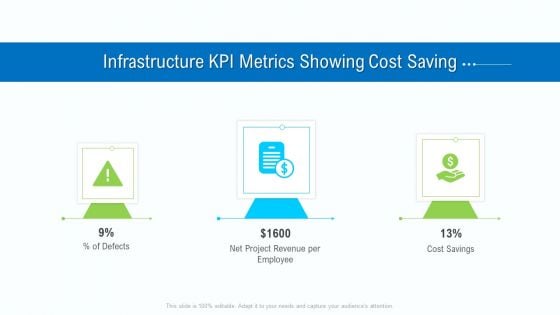
Business Activities Assessment Examples Infrastructure KPI Metrics Showing Cost Saving Infographics PDF
Presenting business activities assessment examples infrastructure kpi metrics showing cost saving infographics pdf to provide visual cues and insights. Share and navigate important information on three stages that need your due attention. This template can be used to pitch topics like net project revenue per employee, cost savings . In addtion, this PPT design contains high resolution images, graphics, etc, that are easily editable and available for immediate download.
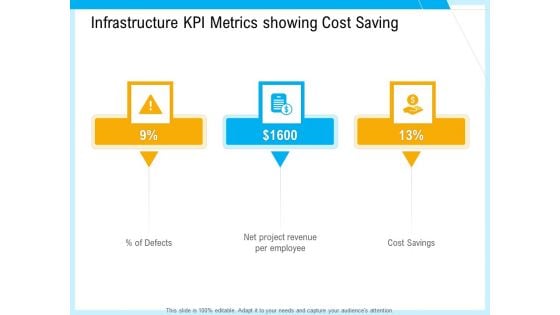
IT And Cloud Facilities Management Infrastructure KPI Metrics Showing Cost Saving Information PDF
This is a it and cloud facilities management infrastructure kpi metrics showing cost saving information pdf template with various stages. Focus and dispense information on three stages using this creative set, that comes with editable features. It contains large content boxes to add your information on topics like defects, net project revenue per employee, cost savings. You can also showcase facts, figures, and other relevant content using this PPT layout. Grab it now.
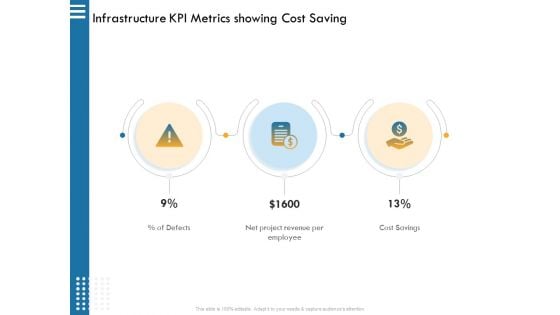
IT Infrastructure Governance Infrastructure KPI Metrics Showing Cost Saving Ppt Infographic Template Graphic Images PDF
This is a it infrastructure governance infrastructure kpi metrics showing cost saving ppt infographic template graphic images pdf. template with various stages. Focus and dispense information on three stages using this creative set, that comes with editable features. It contains large content boxes to add your information on topics like defects, net project revenue per employee, cost savings. You can also showcase facts, figures, and other relevant content using this PPT layout. Grab it now

Framework Administration Infrastructure Kpi Metrics Showing Cost Saving Ppt Styles Master Slide PDF
This is a framework administration infrastructure kpi metrics showing cost saving ppt styles master slide pdf template with various stages. Focus and dispense information on three stages using this creative set, that comes with editable features. It contains large content boxes to add your information on topics like net project revenue per employee, cost savings, defects. You can also showcase facts, figures, and other relevant content using this PPT layout. Grab it now.
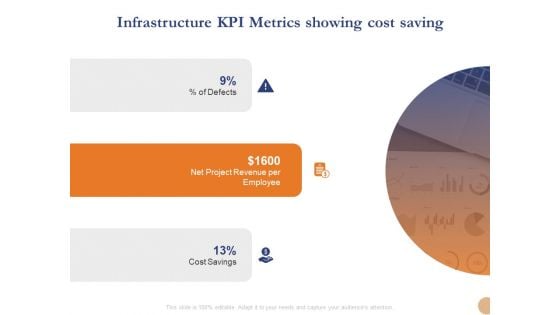
Substructure Segment Analysis Infrastructure KPI Metrics Showing Cost Saving Ppt Ideas Background Designs PDF
Presenting substructure segment analysis infrastructure kpi metrics showing cost saving ppt ideas background designs pdf to provide visual cues and insights. Share and navigate important information on three stages that need your due attention. This template can be used to pitch topics like cost savings, net project revenue per employee, defects. In addition, this PPT design contains high-resolution images, graphics, etc, that are easily editable and available for immediate download.
Facility Management Infrastructure KPI Metrics Showing Cost Saving Ppt Icon Skills PDF
This is a facility management infrastructure kpi metrics showing cost saving ppt icon skills pdf template with various stages. Focus and dispense information on three stages using this creative set, that comes with editable features. It contains large content boxes to add your information on topics like percent of defects, net project revenue per employee, cost savings. You can also showcase facts, figures, and other relevant content using this PPT layout. Grab it now.
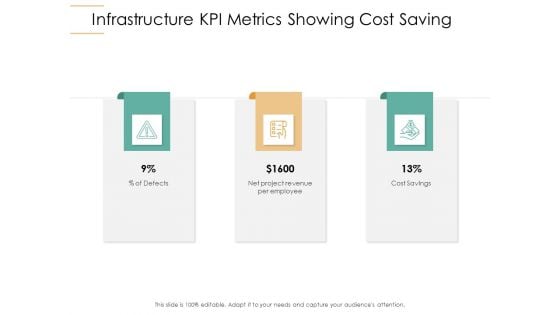
Infrastructure Strategies Infrastructure KPI Metrics Showing Cost Saving Ppt Ideas Maker PDF
This is a infrastructure strategies infrastructure kpi metrics showing cost saving ppt ideas maker pdf template with various stages. Focus and dispense information on three stages using this creative set, that comes with editable features. It contains large content boxes to add your information on topics like percent of defects, net project revenue per employee, cost savings. You can also showcase facts, figures, and other relevant content using this PPT layout. Grab it now.
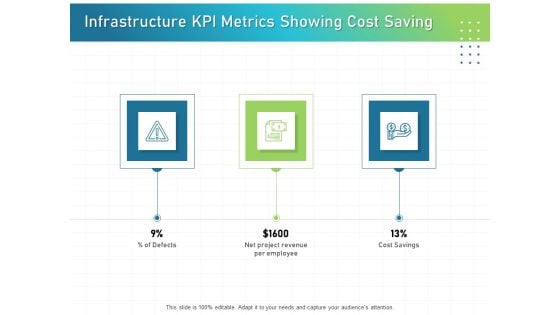
IT Infrastructure Administration Infrastructure KPI Metrics Showing Cost Saving Graphics PDF
This is a it infrastructure administration infrastructure kpi metrics showing cost saving graphics pdf template with various stages. Focus and dispense information on three stages using this creative set, that comes with editable features. It contains large content boxes to add your information on topics like percent of defects, net project revenue per employee, cost savings. You can also showcase facts, figures, and other relevant content using this PPT layout. Grab it now.
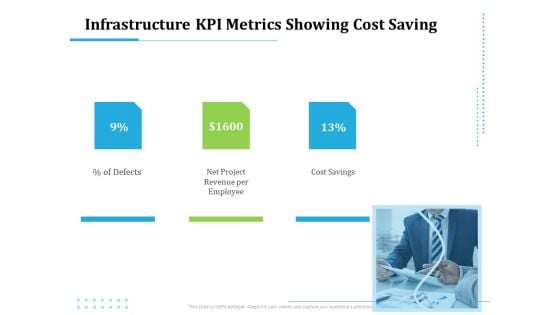
Information Technology Functions Management Infrastructure KPI Metrics Showing Cost Saving Ppt File Topics PDF
This is a information technology functions management infrastructure kpi metrics showing cost saving ppt file topics pdf template with various stages. Focus and dispense information on three stages using this creative set, that comes with editable features. It contains large content boxes to add your information on topics like percent defects, net project revenue per employee, cost savings. You can also showcase facts, figures, and other relevant content using this PPT layout. Grab it now.

Utilizing Infrastructure Management Using Latest Methods Infrastructure KPI Metrics Showing Cost Saving Background PDF
This is a utilizing infrastructure management using latest methods infrastructure kpi metrics showing cost saving background pdf template with various stages. Focus and dispense information on three stages using this creative set, that comes with editable features. It contains large content boxes to add your information on topics like percent defects, net project revenue per employee, cost savings. You can also showcase facts, figures, and other relevant content using this PPT layout. Grab it now.
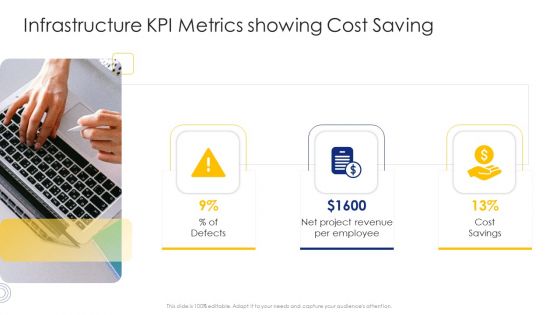
Construction Engineering And Industrial Facility Management Infrastructure KPI Metrics Showing Cost Saving Demonstration PDF
This is a construction engineering and industrial facility management infrastructure kpi metrics showing cost saving demonstration pdf template with various stages. Focus and dispense information on three stages using this creative set, that comes with editable features. It contains large content boxes to add your information on topics like net project revenue per employee, cost savings, defects. You can also showcase facts, figures, and other relevant content using this PPT layout. Grab it now.
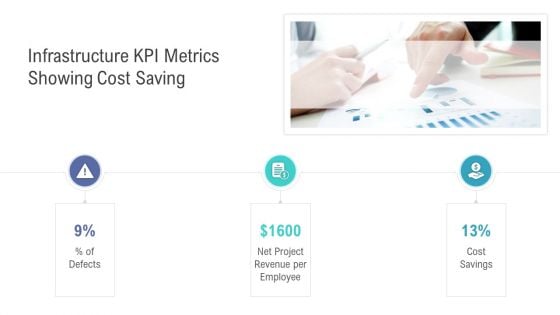
Financial Functional Assessment Infrastructure KPI Metrics Showing Cost Saving Professional PDF
This is a financial functional assessment infrastructure kpi metrics showing cost saving professional pdf template with various stages. Focus and dispense information on three stages using this creative set, that comes with editable features. It contains large content boxes to add your information on topics like cost savings, net project revenue, defects. You can also showcase facts, figures, and other relevant content using this PPT layout. Grab it now.
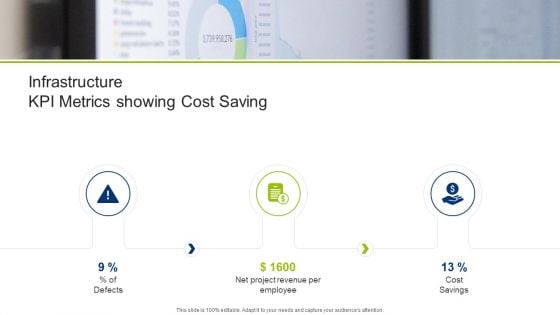
Infrastructure Building Administration Infrastructure KPI Metrics Showing Cost Saving Demonstration PDF
This is a infrastructure building administration infrastructure kpi metrics showing cost saving demonstration pdf template with various stages. Focus and dispense information on three stages using this creative set, that comes with editable features. It contains large content boxes to add your information on topics like project revenue per employee, savings, cost defects. You can also showcase facts, figures, and other relevant content using this PPT layout. Grab it now.
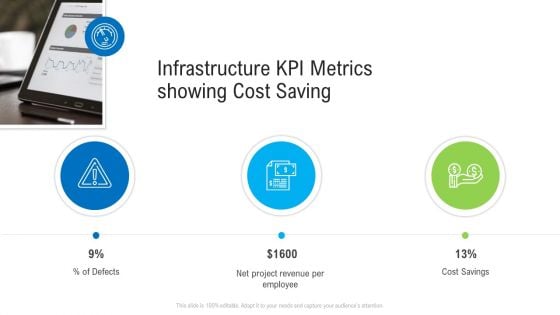
Construction Management Services Infrastructure KPI Metrics Showing Cost Saving Elements PDF
This is a construction management services infrastructure kpi metrics showing cost saving elements pdf template with various stages. Focus and dispense information on three stages using this creative set, that comes with editable features. It contains large content boxes to add your information on topics like defects, project revenue, cost savings. You can also showcase facts, figures, and other relevant content using this PPT layout. Grab it now.

Infrastructure Designing And Administration Infrastructure KPI Metrics Showing Cost Saving Download PDF
This is a infrastructure designing and administration infrastructure kpi metrics showing cost saving download pdf template with various stages. Focus and dispense information on three stages using this creative set, that comes with editable features. It contains large content boxes to add your information on topics like percent of defects, net project revenue per employee, cost savings. You can also showcase facts, figures, and other relevant content using this PPT layout. Grab it now.
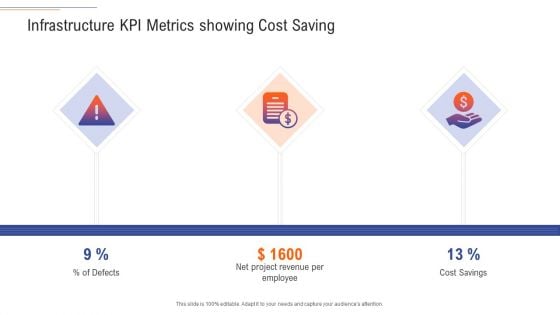
Support Services Management Infrastructure KPI Metrics Showing Cost Saving Diagrams PDF
This is a support services management infrastructure kpi metrics showing cost saving diagrams pdf template with various stages. Focus and dispense information on three stages using this creative set, that comes with editable features. It contains large content boxes to add your information on topics like percent of defects, net project revenue per employee, cost savings. You can also showcase facts, figures, and other relevant content using this PPT layout. Grab it now.
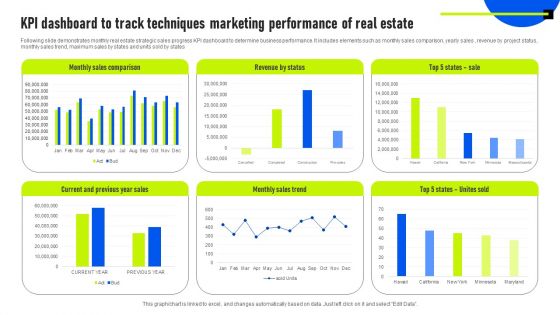
KPI Dashboard To Track Techniques Marketing Performance Of Real Estate Information PDF
Following slide demonstrates monthly real estate strategic sales progress KPI dashboard to determine business performance. It includes elements such as monthly sales comparison, yearly sales , revenue by project status, monthly sales trend, maximum sales by states and units sold by states. Showcasing this set of slides titled KPI Dashboard To Track Techniques Marketing Performance Of Real Estate Information PDF. The topics addressed in these templates are Revenue By Status, Monthly Sales Comparison, Monthly Sales Trend. All the content presented in this PPT design is completely editable. Download it and make adjustments in color, background, font etc. as per your unique business setting.
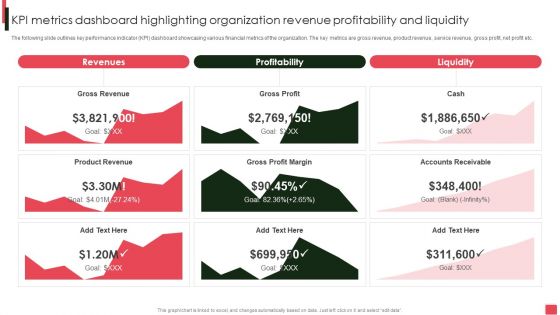
Overview Of Organizational Kpi Metrics Dashboard Highlighting Organization Revenue Brochure PDF
The following slide outlines key performance indicator KPI dashboard showcasing various financial metrics of the organization. The key metrics are gross revenue, product revenue, service revenue, gross profit, net profit etc. If your project calls for a presentation, then Slidegeeks is your go-to partner because we have professionally designed, easy-to-edit templates that are perfect for any presentation. After downloading, you can easily edit Overview Of Organizational Kpi Metrics Dashboard Highlighting Organization Revenue Brochure PDF and make the changes accordingly. You can rearrange slides or fill them with different images. Check out all the handy templates.
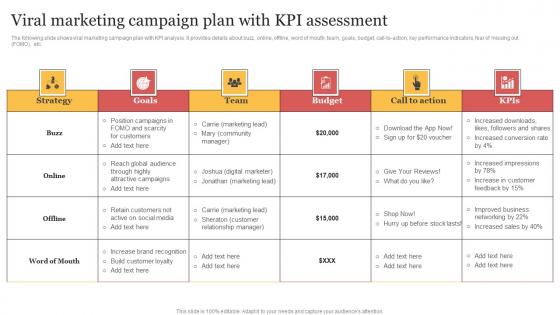
Viral Marketing Campaign Plan With KPI Assessment Organizing Buzzworthy Social Structure Pdf
The following slide shows viral marketing campaign plan with KPI analysis. It provides details about buzz, online, offline, word of mouth, team, goals, budget, call-to-action, key performance indicators, fear of missing out FOMO, etc. Take your projects to the next level with our ultimate collection of Viral Marketing Campaign Plan With KPI Assessment Organizing Buzzworthy Social Structure Pdf Slidegeeks has designed a range of layouts that are perfect for representing task or activity duration, keeping track of all your deadlines at a glance. Tailor these designs to your exact needs and give them a truly corporate look with your own brand colors they well make your projects stand out from the rest.
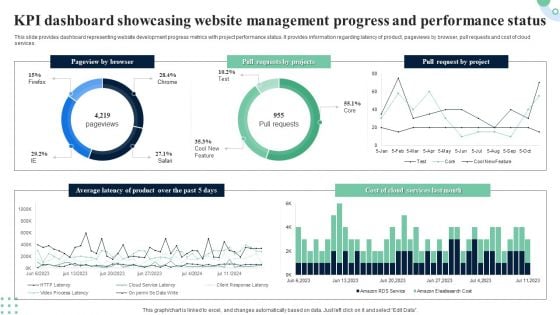
KPI Dashboard Showcasing Website Management Progress And Performance Status Structure PDF
This slide provides dashboard representing website development progress metrics with project performance status. It provides information regarding latency of product, pageviews by browser, pull requests and cost of cloud services. Showcasing this set of slides titled KPI Dashboard Showcasing Website Management Progress And Performance Status Structure PDF. The topics addressed in these templates are Pageview By Browser, Product, Average Latency. All the content presented in this PPT design is completely editable. Download it and make adjustments in color, background, font etc. as per your unique business setting.
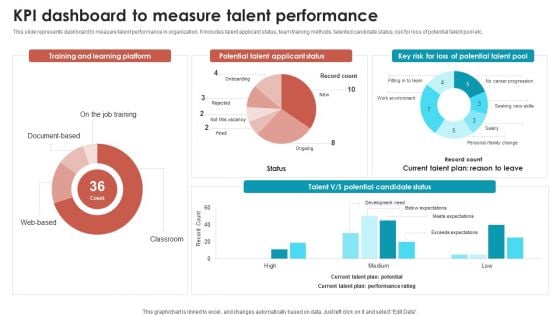
Talent Management Optimization With Workforce Staffing Kpi Dashboard To Measure Talent Performance Sample PDF
This slide represents dashboard to measure talent performance in organization. It includes talent applicant status, team training methods, talented candidate status, risk for loss of potential talent pool etc. If your project calls for a presentation, then Slidegeeks is your go to partner because we have professionally designed, easy to edit templates that are perfect for any presentation. After downloading, you can easily edit Talent Management Optimization With Workforce Staffing Kpi Dashboard To Measure Talent Performance Sample PDF and make the changes accordingly. You can rearrange slides or fill them with different images. Check out all the handy templates.
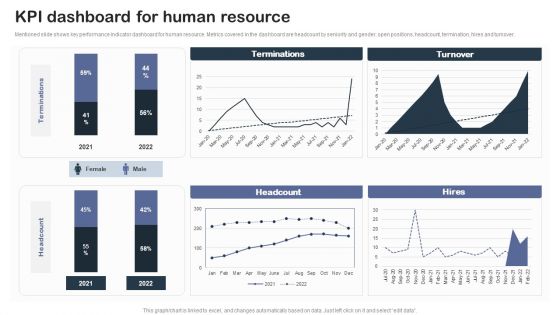
Staff Succession Planning And Development Strategy Kpi Dashboard For Human Clipart PDF
Mentioned slide shows key performance indicator dashboard for human resource. Metrics covered in the dashboard are headcount by seniority and gender, open positions, headcount, termination, hires and turnover.If your project calls for a presentation, then Slidegeeks is your go-to partner because we have professionally designed, easy-to-edit templates that are perfect for any presentation. After downloading, you can easily edit Staff Succession Planning And Development Strategy Kpi Dashboard For Human Clipart PDF and make the changes accordingly. You can rearrange slides or fill them with different images. Check out all the handy templates.
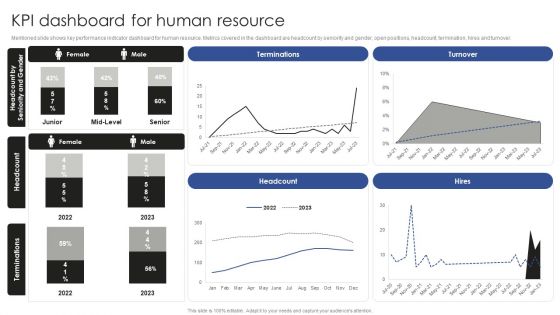
Talent Administration And Succession KPI Dashboard For Human Resource Rules PDF
Mentioned slide shows key performance indicator dashboard for human resource. Metrics covered in the dashboard are headcount by seniority and gender, open positions, headcount, termination, hires and turnover. If your project calls for a presentation, then Slidegeeks is your go-to partner because we have professionally designed, easy-to-edit templates that are perfect for any presentation. After downloading, you can easily edit Talent Administration And Succession KPI Dashboard For Human Resource Rules PDF and make the changes accordingly. You can rearrange slides or fill them with different images. Check out all the handy templates
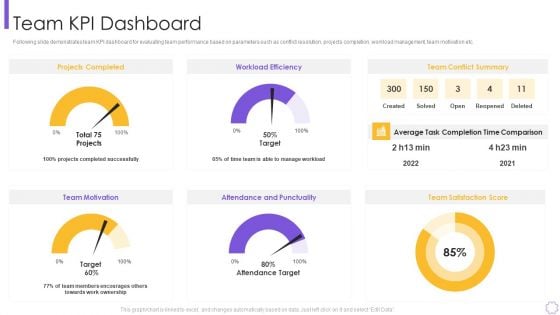
Organizational Program To Improve Team Productivity And Efficiency Team Kpi Dashboard Clipart PDF
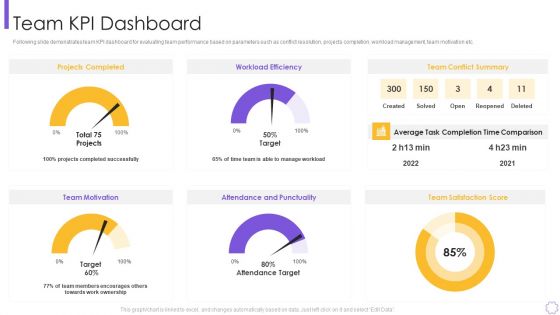
Following slide demonstrates team KPI dashboard for evaluating team performance based on parameters such as conflict resolution, projects completion, workload management, team motivation etc. Deliver and pitch your topic in the best possible manner with this organizational program to improve team productivity and efficiency team kpi dashboard clipart pdf Use them to share invaluable insights on projects completed, workload efficiency, attendance and punctualityand impress your audience. This template can be altered and modified as per your expectations. So, grab it now.
Process Optimization Through Product Life Process Management Techniques Team KPI Dashboard Mockup PDF
Following slide demonstrates team KPI dashboard for evaluating team performance based on parameters such as conflict resolution, projects completion, workload management, team motivation etc. Deliver and pitch your topic in the best possible manner with this process optimization through product life process management techniques team kpi dashboard mockup pdf Use them to share invaluable insights on projects completed, workload efficiency, team conflict summary and impress your audience. This template can be altered and modified as per your expectations. So, grab it now.
Online Marketing Analytics To Enhance Business Growth Website Landing Page KPI Tracking Dashboard Sample PDF
This slide covers a dashboard for analyzing the metrics of the website landing page. It includes KPIs such as conversions, conversion rate, sessions, bounce rate, engagement sickness, etc. If your project calls for a presentation, then Slidegeeks is your go to partner because we have professionally designed, easy to edit templates that are perfect for any presentation. After downloading, you can easily edit Online Marketing Analytics To Enhance Business Growth Website Landing Page KPI Tracking Dashboard Sample PDF and make the changes accordingly. You can rearrange slides or fill them with different images. Check out all the handy templates
Performance KPI Dashboard To Analyze Healthcare Marketing Strategies Performance Elements PDF
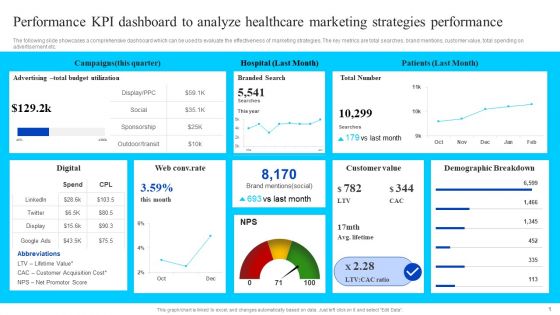
The following slide showcases a comprehensive dashboard which can be used to evaluate the effectiveness of marketing strategies. The key metrics are total searches, brand mentions, customer value, total spending on advertisement etc. If your project calls for a presentation, then Slidegeeks is your go to partner because we have professionally designed, easy to edit templates that are perfect for any presentation. After downloading, you can easily edit Performance KPI Dashboard To Analyze Healthcare Marketing Strategies Performance Elements PDF and make the changes accordingly. You can rearrange slides or fill them with different images. Check out all the handy templates.

Implementing An Effective Ecommerce Management Framework Email Campaign Performance KPI Dashboard Introduction PDF
This slide covers dashboard providing an insight related to how subscribers and resonating with email marketing campaign. It key performance metrics such as sessions from email, sessions from email by campaign, sessions by email by date etc. If your project calls for a presentation, then Slidegeeks is your go-to partner because we have professionally designed, easy-to-edit templates that are perfect for any presentation. After downloading, you can easily edit Implementing An Effective Ecommerce Management Framework Email Campaign Performance KPI Dashboard Introduction PDF and make the changes accordingly. You can rearrange slides or fill them with different images. Check out all the handy templates
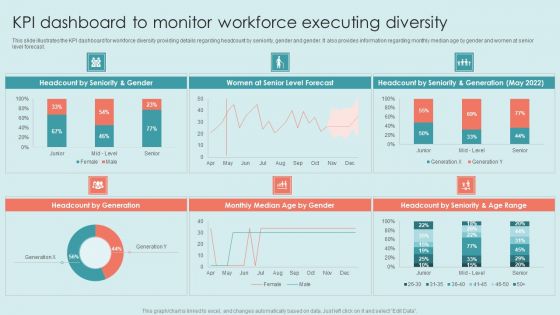
Executing Diversity KPI Dashboard To Monitor Workforce Executing Diversity Background PDF
This slide covers information regarding the key traits of inclusive leadership such as commitment, courage, cognize bias, curiosity etc. It also provides details about thinking to develop and behavior to adopt for becoming an effective inclusive leader. If your project calls for a presentation, then Slidegeeks is your go-to partner because we have professionally designed, easy-to-edit templates that are perfect for any presentation. After downloading, you can easily edit Executing Diversity KPI Dashboard To Monitor Workforce Executing Diversity Background PDF and make the changes accordingly. You can rearrange slides or fill them with different images. Check out all the handy templates.

KPI Framework For Measuring Organizational Growth Ppt PowerPoint Presentation Gallery Template PDF
This slide outlines major key performance indicator framework for measuring organization growth. It includes kips such as return on investment, customer churn rate, employee satisfaction index, project efficiency and client retention rate. Pitch your topic with ease and precision using this kpi framework for measuring organizational growth ppt powerpoint presentation gallery template pdf This layout presents information on customer, investment, rate It is also available for immediate download and adjustment. So, changes can be made in the color, design, graphics or any other component to create a unique layout.
Product Quality Assessment KPI Dashboard Automating Production Process Strategy SS V
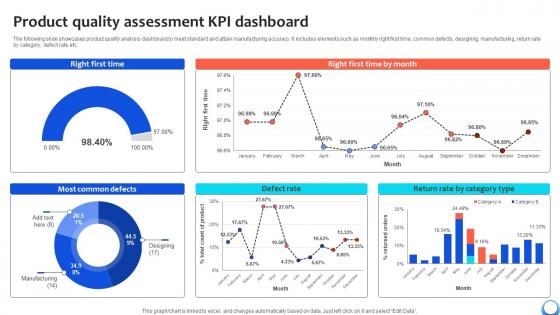
The following slide showcases product quality analysis dashboard to meet standard and attain manufacturing accuracy. It includes elements such as monthly right first time, common defects, designing, manufacturing, return rate by category, defect rate etc. Take your projects to the next level with our ultimate collection of Product Quality Assessment KPI Dashboard Automating Production Process Strategy SS V. Slidegeeks has designed a range of layouts that are perfect for representing task or activity duration, keeping track of all your deadlines at a glance. Tailor these designs to your exact needs and give them a truly corporate look with your own brand colors they will make your projects stand out from the rest
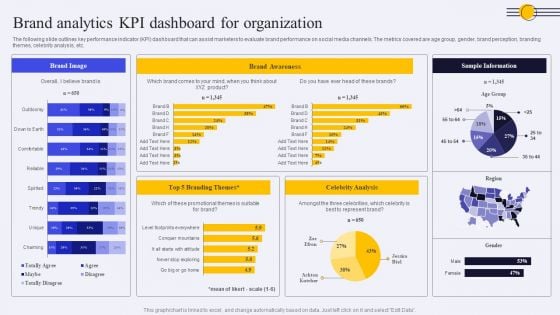
Brand Analytics KPI Dashboard For Organization Ppt PowerPoint Presentation Diagram PDF
The following slide outlines key performance indicator KPI dashboard that can assist marketers to evaluate brand performance on social media channels. The metrics covered are age group, gender, brand perception, branding themes, celebrity analysis, etc. Take your projects to the next level with our ultimate collection of Brand Analytics KPI Dashboard For Organization Ppt PowerPoint Presentation Diagram PDF. Slidegeeks has designed a range of layouts that are perfect for representing task or activity duration, keeping track of all your deadlines at a glance. Tailor these designs to your exact needs and give them a truly corporate look with your own brand colors they will make your projects stand out from the rest.
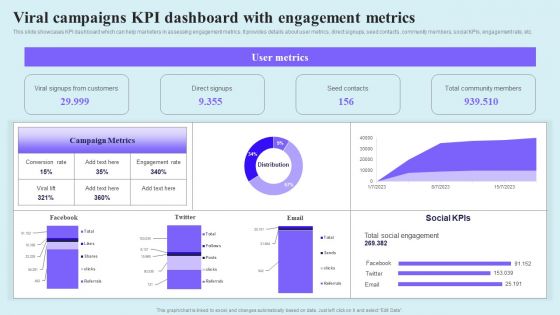
Go Viral Campaign Strategies To Increase Engagement Viral Campaigns KPI Dashboard With Engagement Demonstration PDF
This slide showcases KPI dashboard which can help marketers in assessing engagement metrics. It provides details about user metrics, direct signups, seed contacts, community members, social KPIs, engagement rate, etc. Take your projects to the next level with our ultimate collection of Go Viral Campaign Strategies To Increase Engagement Viral Campaigns KPI Dashboard With Engagement Demonstration PDF. Slidegeeks has designed a range of layouts that are perfect for representing task or activity duration, keeping track of all your deadlines at a glance. Tailor these designs to your exact needs and give them a truly corporate look with your own brand colors they will make your projects stand out from the rest.
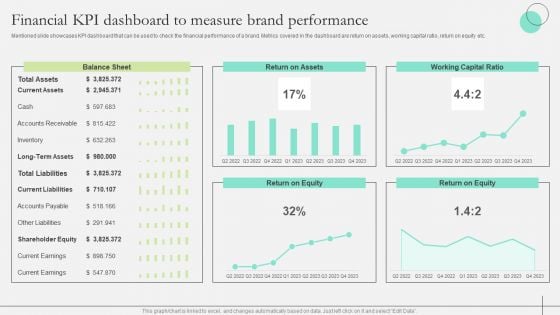
Comprehensive Guide To Strengthen Brand Equity Financial KPI Dashboard Measure Brand Structure PDF
Mentioned slide showcases KPI dashboard that can be used to check the financial performance of a brand. Metrics covered in the dashboard are return on assets, working capital ratio, return on equity etc. Take your projects to the next level with our ultimate collection of Comprehensive Guide To Strengthen Brand Equity Financial KPI Dashboard Measure Brand Structure PDF. Slidegeeks has designed a range of layouts that are perfect for representing task or activity duration, keeping track of all your deadlines at a glance. Tailor these designs to your exact needs and give them a truly corporate look with your own brand colors they will make your projects stand out from the rest
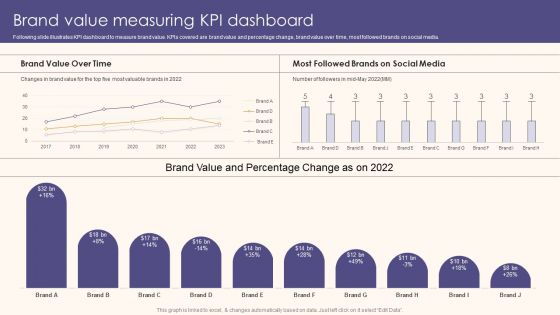
Brand Value Measuring KPI Dashboard Guide To Understand Evaluate And Enhance Brand Value Slides PDF
Following slide illustrates KPI dashboard to measure brand value. KPIs covered are brand value and percentage change, brand value over time, most followed brands on social media.Take your projects to the next level with our ultimate collection of Brand Value Measuring KPI Dashboard Guide To Understand Evaluate And Enhance Brand Value Slides PDF. Slidegeeks has designed a range of layouts that are perfect for representing task or activity duration, keeping track of all your deadlines at a glance. Tailor these designs to your exact needs and give them a truly corporate look with your own brand colors they all make your projects stand out from the rest
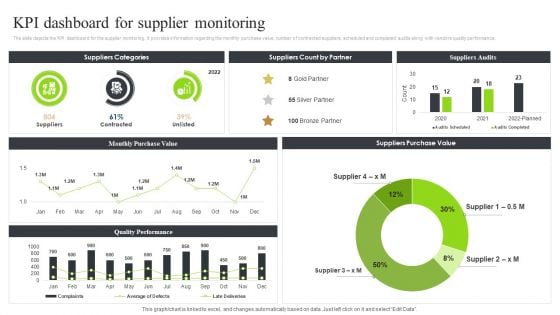
Strategic Sourcing And Supplier Quality Kpi Dashboard For Supplier Monitoring Graphics PDF
The slide depicts the KPI dashboard for the supplier monitoring. It provides information regarding the monthly purchase value, number of contracted suppliers, scheduled and completed audits along with vendors quality performance.Take your projects to the next level with our ultimate collection of Strategic Sourcing And Supplier Quality Kpi Dashboard For Supplier Monitoring Graphics PDF. Slidegeeks has designed a range of layouts that are perfect for representing task or activity duration, keeping track of all your deadlines at a glance. Tailor these designs to your exact needs and give them a truly corporate look with your own brand colors they all make your projects stand out from the rest.

IoT Solutions For Oil Oil And Gas Production Monitoring KPI Dashboard IoT SS V
This slide exhibits monthly performance of oil and gas production to track wellhead uptime and overall efficiency. It includes various elements such as production efficiency, well uptime, gas production rate, oil production rate, top performing gas producing wells, etc. Take your projects to the next level with our ultimate collection of IoT Solutions For Oil Oil And Gas Production Monitoring KPI Dashboard IoT SS V. Slidegeeks has designed a range of layouts that are perfect for representing task or activity duration, keeping track of all your deadlines at a glance. Tailor these designs to your exact needs and give them a truly corporate look with your own brand colors they will make your projects stand out from the rest
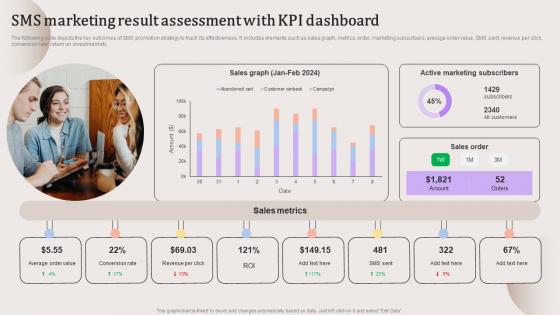
SMS Marketing Result Assessment With KPI Evaluating Strengths And Weaknesses Formats Pdf
The following slide depicts the key outcomes of SMS promotion strategy to track its effectiveness. It includes elements such as sales graph, metrics, order, marketing subscribers, average order value, SMS sent, revenue per click, conversion rate, return on investment etc. Take your projects to the next level with our ultimate collection of SMS Marketing Result Assessment With KPI Evaluating Strengths And Weaknesses Formats Pdf. Slidegeeks has designed a range of layouts that are perfect for representing task or activity duration, keeping track of all your deadlines at a glance. Tailor these designs to your exact needs and give them a truly corporate look with your own brand colors they all make your projects stand out from the rest.
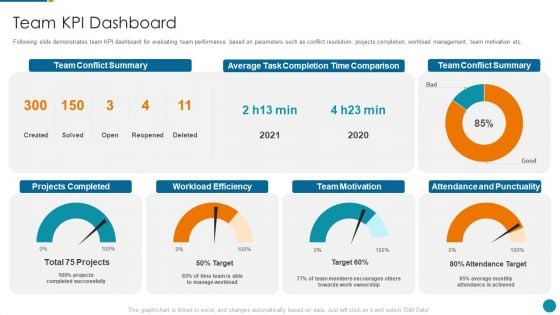
Strategic Procedure To Improve Employee Efficiency Team KPI Dashboard Topics PDF
Following slide demonstrates team KPI dashboard for evaluating team performance based on parameters such as conflict resolution, projects completion, workload management, team motivation etc. Deliver and pitch your topic in the best possible manner with this strategic procedure to improve employee efficiency team kpi dashboard topics pdf Use them to share invaluable insights on team conflict summary, workload efficiency, team motivation and impress your audience. This template can be altered and modified as per your expectations. So, grab it now.
Providing Efficient Client Services Kpi Dashboard For Tracking Customer Retention Diagrams PDF
This slide covers the dashboard for analyzing customer loyalty with metrics such as NPS, loyal customer rate, premium users, CLV, customer churn, revenue churn, net retention, MRR growth, etc. Take your projects to the next level with our ultimate collection of Providing Efficient Client Services Kpi Dashboard For Tracking Customer Retention Diagrams PDF. Slidegeeks has designed a range of layouts that are perfect for representing task or activity duration, keeping track of all your deadlines at a glance. Tailor these designs to your exact needs and give them a truly corporate look with your own brand colors they will make your projects stand out from the rest.
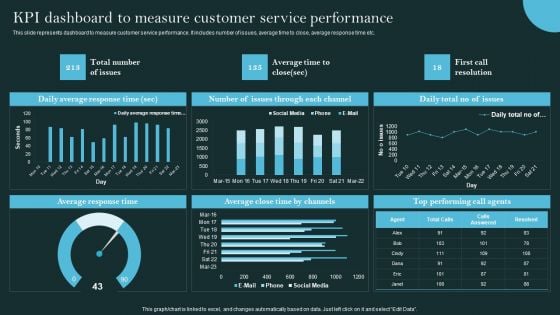
Revolutionizing Customer Support Through Digital Transformation KPI Dashboard To Measure Customer Elements PDF
This slide represents dashboard to measure customer service performance. It includes number of issues, average time to close, average response time etc. Take your projects to the next level with our ultimate collection of Revolutionizing Customer Support Through Digital Transformation KPI Dashboard To Measure Customer Elements PDF. Slidegeeks has designed a range of layouts that are perfect for representing task or activity duration, keeping track of all your deadlines at a glance. Tailor these designs to your exact needs and give them a truly corporate look with your own brand colors they will make your projects stand out from the rest.

Introduction To Mobile SEM KPI Metrics Dashboard To Monitor Mobile SEO Performance Diagrams PDF
The purpose of this slide is to outline key performance indicator KPI dashboard which will assist the marketer to analyze mobile search engine optimization SEO performance. The key metrics mentioned in the slide are total sessions, search engine rankings etc. Take your projects to the next level with our ultimate collection of Introduction To Mobile SEM KPI Metrics Dashboard To Monitor Mobile SEO Performance Diagrams PDF. Slidegeeks has designed a range of layouts that are perfect for representing task or activity duration, keeping track of all your deadlines at a glance. Tailor these designs to your exact needs and give them a truly corporate look with your own brand colors they will make your projects stand out from the rest.
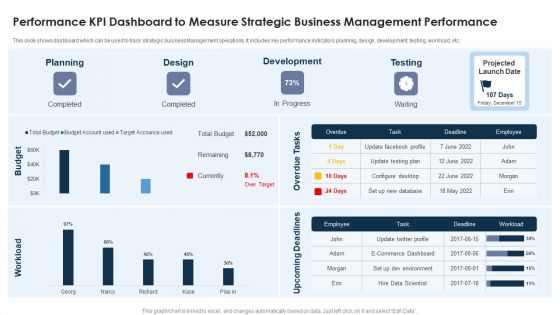
Performance KPI Dashboard To Measure Strategic Business Management Performance Pictures PDF
This slide shows dashboard which can be used to track strategic business Management operations. It includes key performance indicators planning, design, development, testing, workload, etc.Showcasing this set of slides titled Performance KPI Dashboard To Measure Strategic Business Management Performance Pictures PDF The topics addressed in these templates are Development, Projected Launch, Planning All the content presented in this PPT design is completely editable. Download it and make adjustments in color, background, font etc. as per your unique business setting.
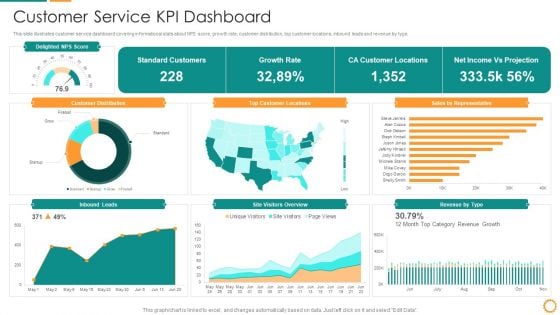
IT Consolidation Post Mergers And Acquisition Customer Service KPI Dashboard Brochure PDF
This slide illustrates customer service dashboard covering informational stats about NPS score, growth rate, customer distribution, top customer locations, inbound leads and revenue by type. Deliver an awe inspiring pitch with this creative IT Consolidation Post Mergers And Acquisition Customer Service KPI Dashboard Brochure PDF bundle. Topics like Customer Locations, Growth Rate, Standard Customers, Net Income, Projection can be discussed with this completely editable template. It is available for immediate download depending on the needs and requirements of the user.

 Home
Home