Project Dashboard
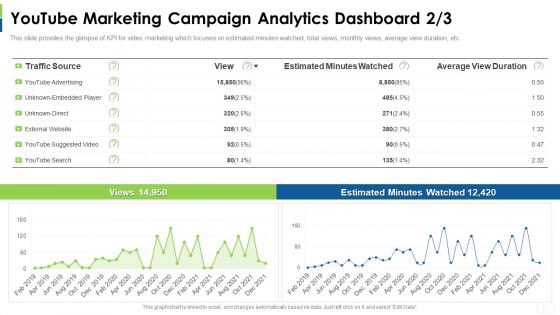
Social Platform As Profession Youtube Marketing Campaign Analytics Dashboard Direct Rules PDF
This slide provides the glimpse of KPI for video marketing which focuses on estimated minutes watched, total views, monthly views, average view duration, etc. Deliver and pitch your topic in the best possible manner with this social platform as profession youtube marketing campaign analytics dashboard direct rules pdf. Use them to share invaluable insights on youtube marketing campaign analytics dashboard and impress your audience. This template can be altered and modified as per your expectations. So, grab it now.
Sales Funnel Management For Revenue Generation Tracking Sales Pipeline And Lead Activity Dashboard Background PDF
This slide covers information regarding dashboard associated to tracking lead activity across sales pipeline. Deliver and pitch your topic in the best possible manner with this sales funnel management for revenue generation tracking sales pipeline and lead activity dashboard background pdf. Use them to share invaluable insights on team matterhorn, expansion opportunity, estimated value and impress your audience. This template can be altered and modified as per your expectations. So, grab it now.

Customer Rapport Strategy To Build Loyal Client Base Business Revenue Dashboard Elements PDF
This slide highlights business dashboard with multiple statistics to estimate the revenue and profitability of company as a result of new customer intimacy strategy. Deliver and pitch your topic in the best possible manner with this customer rapport strategy to build loyal client base business revenue dashboard elements pdf. Use them to share invaluable insights on revenue, previous year, customer and impress your audience. This template can be altered and modified as per your expectations. So, grab it now.
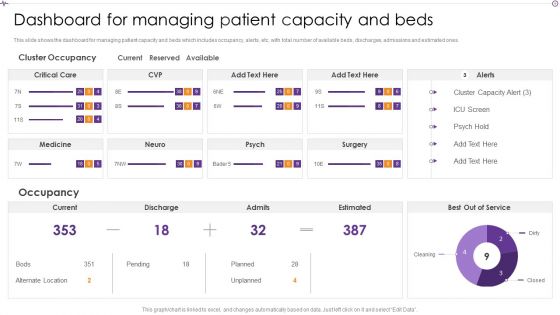
Advances In Healthcare Management System Dashboard For Managing Patient Capacity And Beds Mockup PDF
This slide shows the dashboard for managing patient capacity and beds which includes occupancy, alerts, etc, with total number of available beds, discharges, admissions and estimated ones. Deliver an awe inspiring pitch with this creative Advances In Healthcare Management System Dashboard For Managing Patient Capacity And Beds Mockup PDF bundle. Topics like Cluster Occupancy, Best Out Of Service, Cluster Capacity can be discussed with this completely editable template. It is available for immediate download depending on the needs and requirements of the user.
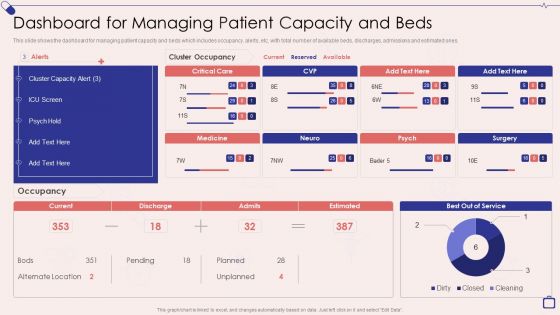
Implementing Integrated Software Dashboard For Managing Patient Capacity And Beds Download PDF
This slide shows the dashboard for managing patient capacity and beds which includes occupancy, alerts, etc, with total number of available beds, discharges, admissions and estimated ones.Deliver and pitch your topic in the best possible manner with this Implementing Integrated Software Dashboard For Managing Patient Capacity And Beds Download PDF. Use them to share invaluable insights on Alternate Location, Cluster Occupancy, Cluster Capacity and impress your audience. This template can be altered and modified as per your expectations. So, grab it now.
Predictive Analytics Model Performance Tracking Dashboard Forward Looking Analysis IT Introduction PDF
This slide represents the predictive analytics model performance tracking dashboard, and it covers the details of total visitors, total buyers, total products added to the cart, filters by date and category, visitors to clients conversion rate, and so on.The Predictive Analytics Model Performance Tracking Dashboard Forward Looking Analysis IT Introduction PDF is a compilation of the most recent design trends as a series of slides. It is suitable for any subject or industry presentation, containing attractive visuals and photo spots for businesses to clearly express their messages. This template contains a variety of slides for the user to input data, such as structures to contrast two elements, bullet points, and slides for written information. Slidegeeks is prepared to create an impression.
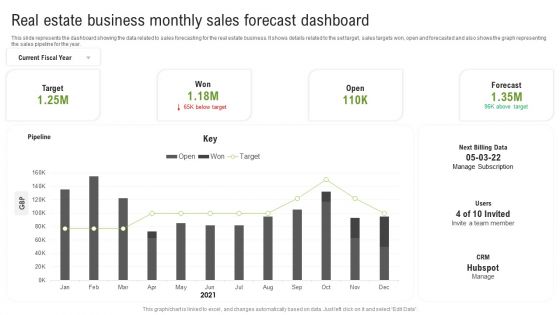
Real Estate Business Monthly Sales Forecast Dashboard Ppt Layouts Grid PDF
This slide represents the dashboard showing the data related to sales forecasting for the real estate business. It shows details related to the set target, sales targets won, open and forecasted and also shows the graph representing the sales pipeline for the year. Showcasing this set of slides titled Real Estate Business Monthly Sales Forecast Dashboard Ppt Layouts Grid PDF. The topics addressed in these templates are Next Billing Data, Pipeline, Current Fiscal Year. All the content presented in this PPT design is completely editable. Download it and make adjustments in color, background, font etc. as per your unique business setting.

KPI Dashboard To Track Progress Of Law Firm Development Strategic Plan Infographics PDF
Following slide demonstrates dashboard for tracking law firm development plan progress to determine key practice areas. It includes elements such as number of won ,lost and decline cases, opportunity sources, proposal type and proportion of practice areas. Showcasing this set of slides titled KPI Dashboard To Track Progress Of Law Firm Development Strategic Plan Infographics PDF. The topics addressed in these templates are Opportunities, Cases, Practice Areas. All the content presented in this PPT design is completely editable. Download it and make adjustments in color, background, font etc. as per your unique business setting.
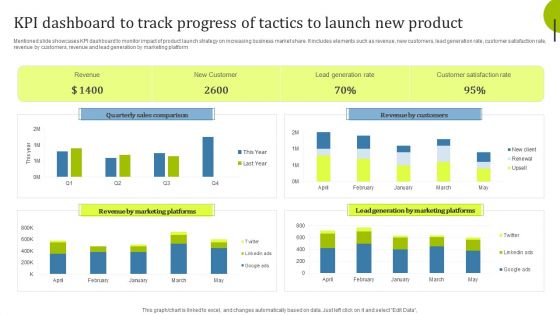
Kpi Dashboard To Track Progress Of Tactics To Launch New Product Infographics PDF
Mentioned slide showcases KPI dashboard to monitor impact of product launch strategy on increasing business market share. It includes elements such as revenue, new customers, lead generation rate, customer satisfaction rate, revenue by customers, revenue and lead generation by marketing platform. Showcasing this set of slides titled Kpi Dashboard To Track Progress Of Tactics To Launch New Product Infographics PDF. The topics addressed in these templates are Quarterly Sales Comparison, Revenue Marketing, Revenue Customers. All the content presented in this PPT design is completely editable. Download it and make adjustments in color, background, font etc. as per your unique business setting.

Automobile Company Actual And Forecasted Monthly Sales Dashboard Ppt Infographic Template Aids PDF
This slide shows the dashboard for forecasting the sales of an automobile company for the current month. It represents details related to revenue by pipeline, new deals, sales forecast, revenue goal attainment by owner for the current month and pipeline coverage by next month. Showcasing this set of slides titled Automobile Company Actual And Forecasted Monthly Sales Dashboard Ppt Infographic Template Aids PDF. The topics addressed in these templates are Forecast Month, Revenue Goal Attainment, Revenue Goal Attainment. All the content presented in this PPT design is completely editable. Download it and make adjustments in color, background, font etc. as per your unique business setting.

KPI Dashboard To Forecast Smart Production Market Ppt PowerPoint Presentation Gallery Visual Aids PDF
This slide signifies the key performance indicator dashboard to evaluate smart production market. It covers information about major market players, market end users, top companies and components. Pitch your topic with ease and precision using this KPI Dashboard To Forecast Smart Production Market Ppt PowerPoint Presentation Gallery Visual Aids PDF. This layout presents information on Global Smart Manufacturing, Market Forecast, 2019 To 2023. It is also available for immediate download and adjustment. So, changes can be made in the color, design, graphics or any other component to create a unique layout.

Linkedin Marketing For New Ventures Campaign Performance Evaluation Dashboard Themes PDF
This slide depicts the dashboard for LinkedIn marketing campaign providing information regarding impressions, clicks, engagement rate, CTR monthly trend, budget etc.Deliver and pitch your topic in the best possible manner with this Linkedin Marketing For New Ventures Campaign Performance Evaluation Dashboard Themes PDF Use them to share invaluable insights on Impressions, Engagement Rate, Total Engagements and impress your audience. This template can be altered and modified as per your expectations. So, grab it now.
Forecasting And Managing Consumer Attrition For Business Advantage Dashboard Customer Purchase Tracking Repeat Structure PDF
The firm is looking forward to track customer experience by tracking various touchpoints in order to handle issues such customer churn. KPIs mentioned in the dashboard are measured regularly across the organization. Deliver and pitch your topic in the best possible manner with this forecasting and managing consumer attrition for business advantage dashboard customer purchase tracking repeat structure pdf. Use them to share invaluable insights on total repeat sales after coupon, total repeat sales after reward, total cart value per month and impress your audience. This template can be altered and modified as per your expectations. So, grab it now.
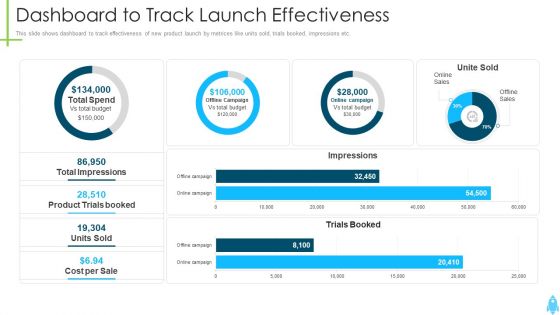
Product Kick Off Strategy Dashboard To Track Launch Effectiveness Clipart PDF
This slide shows dashboard to track effectiveness of new product launch by metrices like units sold, trials booked, impressions etc. Deliver and pitch your topic in the best possible manner with this product kick off strategy dashboard to track launch effectiveness clipart pdf. Use them to share invaluable insights on campaign, budget, sale, cost and impress your audience. This template can be altered and modified as per your expectations. So, grab it now.
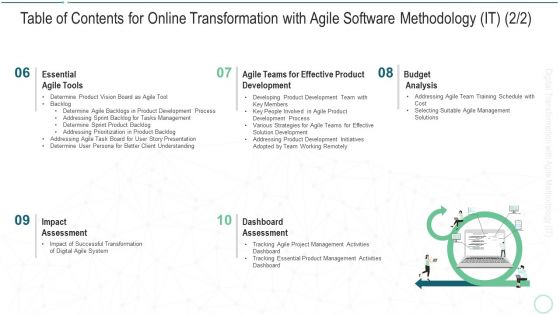
Table Of Contents For Online Transformation With Agile Software Methodology It Dashboard Template PDF
Presenting table of contents for online transformation with agile software methodology it dashboard template pdf to provide visual cues and insights. Share and navigate important information on five stages that need your due attention. This template can be used to pitch topics like dashboard, management, development, budget analysis. In addtion, this PPT design contains high resolution images, graphics, etc, that are easily editable and available for immediate download.

Establishing Successful Brand Strategy To Captivate Consumers Campaign Performance Dashboard Background PDF
Following slide covers campaign performance dashboard of the firm. It includes metrics such as total spend, total impressions, total clicks, total acquisitions and cost per acquisition. Deliver and pitch your topic in the best possible manner with this establishing successful brand strategy to captivate consumers campaign performance dashboard background pdf. Use them to share invaluable insights on campaign, acquisitions, budget, cost and impress your audience. This template can be altered and modified as per your expectations. So, grab it now.
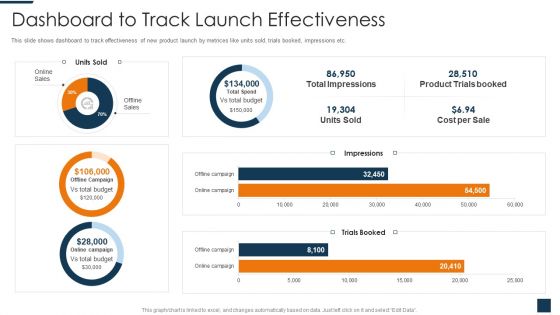
Go To Market Strategy For New Product Dashboard To Track Launch Effectiveness Template PDF
This slide shows dashboard to track effectiveness of new product launch by metrices like units sold, trials booked, impressions etc. Deliver and pitch your topic in the best possible manner with this go to market strategy for new product dashboard to track launch effectiveness template pdf. Use them to share invaluable insights on budget, campaign, cost, sales and impress your audience. This template can be altered and modified as per your expectations. So, grab it now.
Sales Training Playbook Determine Workforce Training Performance Tracking Dashboard Pictures PDF
This slide provides information regarding workforce training performance tracking dashboard with training cost, number of participants, hours of training, etc. Deliver an awe inspiring pitch with this creative sales training playbook determine workforce training performance tracking dashboard pictures pdf bundle. Topics like budget, cost can be discussed with this completely editable template. It is available for immediate download depending on the needs and requirements of the user.
Determine Workforce Training Performance Tracking Dashboard Personnel Training Playbook Template PDF
This slide provides information regarding workforce training performance tracking dashboard with training cost, number of participants, hours of training, etc. Deliver an awe inspiring pitch with this creative Determine Workforce Training Performance Tracking Dashboard Personnel Training Playbook Template PDF bundle. Topics like Training Cost Actual, Training Cost Budget, Cost Per Participant, Cost Per Hour can be discussed with this completely editable template. It is available for immediate download depending on the needs and requirements of the user.

Revolution In Online Business Business Transformation Dashboard Ppt PowerPoint Presentation Gallery Structure PDF
This slide covers transformation dashboard covering various stages of a business along with the budget and risks involved at every stage. Deliver an awe inspiring pitch with this creative Revolution In Online Business Business Transformation Dashboard Ppt PowerPoint Presentation Gallery Structure PDF bundle. Topics like Discovery Visioning Plan, Design Execute Monitor can be discussed with this completely editable template. It is available for immediate download depending on the needs and requirements of the user.
Integration Of Digital Technology In Organization Business Transformation Dashboard Icons PDF
This slide covers transformation dashboard covering various stages of a business along with the budget and risks involved at every stage.Deliver and pitch your topic in the best possible manner with this Integration Of Digital Technology In Organization Business Transformation Dashboard Icons PDF Use them to share invaluable insights on Discovery Or Visioning, Resources Availability, Mobilization Of Resources and impress your audience. This template can be altered and modified as per your expectations. So, grab it now.

Integration Of Digital Technology In Organization Digital Finance Dashboard Themes PDF
This slide covers transformation dashboard covering various stages of a business along with the budget and risks involved at every stage.Deliver and pitch your topic in the best possible manner with this Integration Of Digital Technology In Organization Digital Finance Dashboard Themes PDF Use them to share invaluable insights on Total Revenue, Benefit Realization, Operating Cost and impress your audience. This template can be altered and modified as per your expectations. So, grab it now.
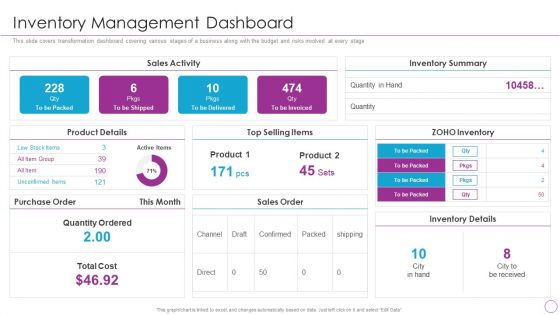
Integration Of Digital Technology In Organization Inventory Management Dashboard Ideas PDF
This slide covers transformation dashboard covering various stages of a business along with the budget and risks involved at every stage Deliver and pitch your topic in the best possible manner with this Integration Of Digital Technology In Organization Inventory Management Dashboard Ideas PDF Use them to share invaluable insights on Product Details, Inventory Summary, Sales Activity and impress your audience. This template can be altered and modified as per your expectations. So, grab it now.
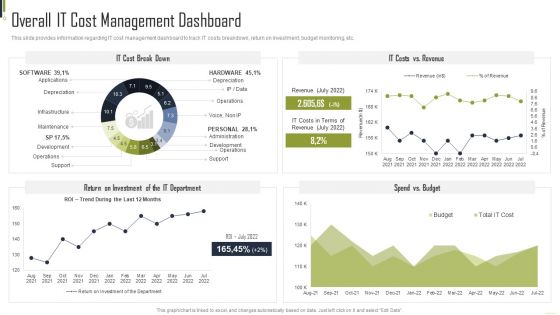
Playbook For Information Technology Structure Overall IT Cost Management Dashboard Brochure PDF
This slide provides information regarding IT cost management dashboard to track IT costs breakdown, return on investment, budget monitoring, etc. Deliver and pitch your topic in the best possible manner with this Playbook For Information Technology Structure Overall IT Cost Management Dashboard Brochure PDF. Use them to share invaluable insights on Cost Break, Infrastructure, Development and impress your audience. This template can be altered and modified as per your expectations. So, grab it now.

Organization Transition Business Transformation Dashboard Ppt PowerPoint Presentation Gallery Slide PDF
This slide covers transformation dashboard covering various stages of a business along with the budget and risks involved at every stage. Deliver an awe inspiring pitch with this creative Organization Transition Business Transformation Dashboard Ppt PowerPoint Presentation Gallery Slide PDF bundle. Topics like Plan, Design, Execute, Monitor can be discussed with this completely editable template. It is available for immediate download depending on the needs and requirements of the user.

Optimizing IT Infrastructure Playbook Overall IT Cost Management Dashboard Summary PDF
This slide provides information regarding IT cost management dashboard to track IT costs breakdown, return on investment, budget monitoring, etc.Deliver an awe inspiring pitch with this creative Optimizing IT Infrastructure Playbook Overall IT Cost Management Dashboard Summary PDF bundle. Topics like Return Investment, IT Department, Costs Revenue can be discussed with this completely editable template. It is available for immediate download depending on the needs and requirements of the user.
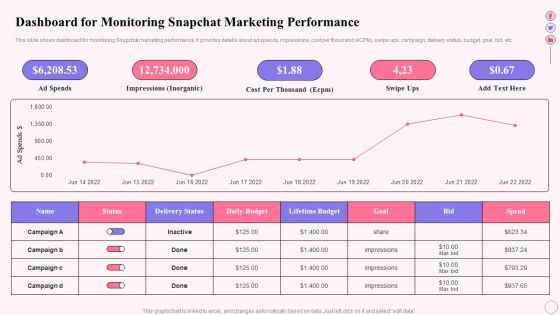
Integrating Social Media Tactics Dashboard For Monitoring Snapchat Marketing Elements PDF
This slide shows dashboard for monitoring Snapchat marketing performance. It provides details about ad spends, impressions, cost per thousand eCPM, swipe ups, campaign, delivery status, budget, goal, bid, etc. Deliver an awe inspiring pitch with this creative Integrating Social Media Tactics Dashboard For Monitoring Snapchat Marketing Elements PDF bundle. Topics like Cost Per Thousand, Swipe Ups, Ad Spends can be discussed with this completely editable template. It is available for immediate download depending on the needs and requirements of the user.
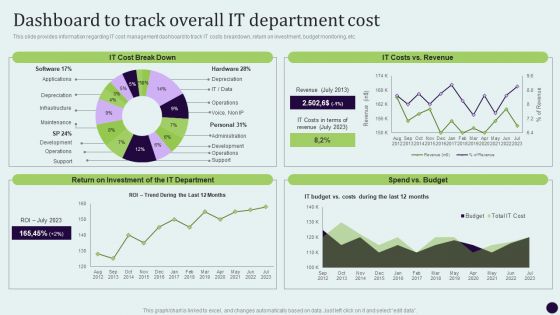
Critical Measures For Ensuring Dashboard To Track Overall IT Department Cost Template PDF
This slide provides information regarding IT cost management dashboard to track IT costs breakdown, return on investment, budget monitoring, etc. There are so many reasons you need a Critical Measures For Ensuring Dashboard To Track Overall IT Department Cost Template PDF. The first reason is you cant spend time making everything from scratch, Thus, Slidegeeks has made presentation templates for you too. You can easily download these templates from our website easily.

Sap Analytics Cloud Dashboard For Income Analysis And Forecasting Formats PDF
This slide illustrates the SAP Analytics Cloud dashboard for organization income analysis and forecasting. It provides information regarding multiple incomes such as interest, operating and trading income. It also contains details of operating expenses. The best PPT templates are a great way to save time, energy, and resources. Slidegeeks have 100 percent editable powerpoint slides making them incredibly versatile. With these quality presentation templates, you can create a captivating and memorable presentation by combining visually appealing slides and effectively communicating your message. Download Sap Analytics Cloud Dashboard To Asses Digital Marketing Campaigns Performance Ideas PDF from Slidegeeks and deliver a wonderful presentation.

Strategic Talent Development Dashboard To Track Training And Coaching Progress Information PDF
This slide highlights dashboard that can help organization to track the training progress of candidates. Its key elements are number of participants, training cost, participants by training type etc. Find highly impressive Strategic Talent Development Dashboard To Track Training And Coaching Progress Information PDF on Slidegeeks to deliver a meaningful presentation. You can save an ample amount of time using these presentation templates. No need to worry to prepare everything from scratch because Slidegeeks experts have already done a huge research and work for you. You need to download Strategic Talent Development Dashboard To Track Training And Coaching Progress Information PDF for your upcoming presentation. All the presentation templates are 100 percent editable and you can change the color and personalize the content accordingly. Download now.
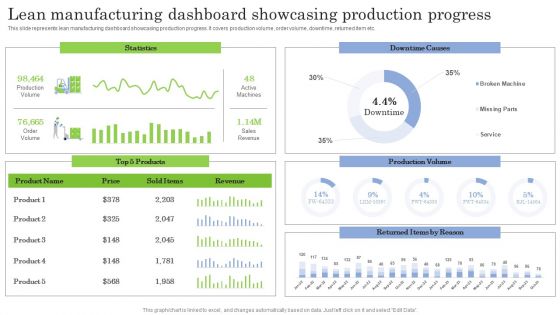
Lean Manufacturing Dashboard Showcasing Production Progress Ppt PowerPoint Presentation File Model PDF
This slide represents lean manufacturing dashboard showcasing production progress. It covers production volume, order volume, downtime, returned item etc. Formulating a presentation can take up a lot of effort and time, so the content and message should always be the primary focus. The visuals of the PowerPoint can enhance the presenters message, so our Lean Manufacturing Dashboard Showcasing Production Progress Ppt PowerPoint Presentation File Model PDF was created to help save time. Instead of worrying about the design, the presenter can concentrate on the message while our designers work on creating the ideal templates for whatever situation is needed. Slidegeeks has experts for everything from amazing designs to valuable content, we have put everything into Lean Manufacturing Dashboard Showcasing Production Progress Ppt PowerPoint Presentation File Model PDF
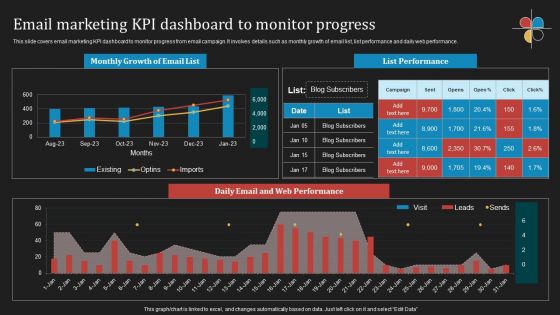
Deploying B2B Advertising Techniques For Lead Generation Email Marketing Kpi Dashboard To Monitor Progress Designs PDF
This slide covers email marketing KPI dashboard to monitor progress from email campaign. It involves details such as monthly growth of email list, list performance and daily web performance. Formulating a presentation can take up a lot of effort and time, so the content and message should always be the primary focus. The visuals of the PowerPoint can enhance the presenters message, so our Deploying B2B Advertising Techniques For Lead Generation Email Marketing Kpi Dashboard To Monitor Progress Designs PDF was created to help save time. Instead of worrying about the design, the presenter can concentrate on the message while our designers work on creating the ideal templates for whatever situation is needed. Slidegeeks has experts for everything from amazing designs to valuable content, we have put everything into Deploying B2B Advertising Techniques For Lead Generation Email Marketing Kpi Dashboard To Monitor Progress Designs PDF

SMS Based Marketing Campaign Progress Monitoring Dashboard Ppt PowerPoint Presentation File Background Images PDF
The following slide showcases dashboard assisting marketers in measuring progress of SMS marketing campaigns and making final decisions. It provides information about messaging contacts, reachable opted, promotions, events, etc. Whether you have daily or monthly meetings, a brilliant presentation is necessary. SMS Based Marketing Campaign Progress Monitoring Dashboard Ppt PowerPoint Presentation File Background Images PDF can be your best option for delivering a presentation. Represent everything in detail using SMS Based Marketing Campaign Progress Monitoring Dashboard Ppt PowerPoint Presentation File Background Images PDF and make yourself stand out in meetings. The template is versatile and follows a structure that will cater to your requirements. All the templates prepared by Slidegeeks are easy to download and edit. Our research experts have taken care of the corporate themes as well. So, give it a try and see the results.

Dashboard To Track Progress Post Implementing Drug Launch Strategy Slides PDF
Following dashboard provides a brief overview of progress post implementing drug launch strategy which can be used by medical representatives to monitor the effectiveness. The key performance indicators are units sold, target, revenue, units unsold etc. Showcasing this set of slides titled Dashboard To Track Progress Post Implementing Drug Launch Strategy Slides PDF. The topics addressed in these templates are Planning, Design, Development, Testing, Launch. All the content presented in this PPT design is completely editable. Download it and make adjustments in color, background, font etc. as per your unique business setting.
Monthly Sales KPI Dashboard For Tracking Brand Recommendation Progress Background PDF
Following slide demonstrates key performance indicator dashboard for tracking monthly sales to monitor business performance. It includes components such as monthly execution cost, sales, state wise events, Brand market, and programs. Showcasing this set of slides titled Monthly Sales KPI Dashboard For Tracking Brand Recommendation Progress Background PDF. The topics addressed in these templates are Products Sold, Engagements, Events, Active Markets, Sampled, Attendance. All the content presented in this PPT design is completely editable. Download it and make adjustments in color, background, font etc. as per your unique business setting.
Why Is Agile Cost Effective IT Agile Dashboard For Tracking Sprint Progress Designs PDF
Mentioned slide displays agile dashboard that can be used by organization to track sprint progress. KPIs covered here are overall sprint progress, statistics by priority and statistics by status. Deliver an awe inspiring pitch with this creative Why Is Agile Cost Effective IT Agile Dashboard For Tracking Sprint Progress Designs PDF bundle. Topics like Assignee, Statistics By Priority, Progress, Contract Review can be discussed with this completely editable template. It is available for immediate download depending on the needs and requirements of the user.

Direct Response Marketing Guide Ultimate Success Dashboard To Track Progress Diagrams PDF
This slide provides an overview of the dashboard depicting the status of the digital marketing campaign with the help of performance metrics. The dashboard includes ad spend, return on ad spend, purchase rate and cost per order. Are you in need of a template that can accommodate all of your creative concepts This one is crafted professionally and can be altered to fit any style. Use it with Google Slides or PowerPoint. Include striking photographs, symbols, depictions, and other visuals. Fill, move around, or remove text boxes as desired. Test out color palettes and font mixtures. Edit and save your work, or work with colleagues. Download Direct Response Marketing Guide Ultimate Success Dashboard To Track Progress Diagrams PDF and observe how to make your presentation outstanding. Give an impeccable presentation to your group and make your presentation unforgettable.
Cost Saving With Agile Methodology IT Agile Dashboard For Tracking Sprint Progress Mockup PDF
Mentioned slide displays agile dashboard that can be used by organization to track sprint progress. KPIs covered here are overall sprint progress, statistics by priority and statistics by status.Deliver an awe inspiring pitch with this creative cost saving with agile methodology it agile dashboard for tracking sprint progress mockup pdf bundle. Topics like statistics by priority, contract review, statistics by status can be discussed with this completely editable template. It is available for immediate download depending on the needs and requirements of the user.

Predictive Data Model Predictive Analytics Model Performance Tracking Dashboard Themes PDF
This slide represents the predictive analytics model performance tracking dashboard, and it covers the details of total visitors, total buyers, total products added to the cart, filters by date and category, visitors to clients conversion rate, and so on. Find a pre-designed and impeccable Predictive Data Model Predictive Analytics Model Performance Tracking Dashboard Themes PDF. The templates can ace your presentation without additional effort. You can download these easy-to-edit presentation templates to make your presentation stand out from others. So, what are you waiting for Download the template from Slidegeeks today and give a unique touch to your presentation.
Virtual WAN Architecture SD WAN Network Performance Tracking Dashboard Designs PDF
This slide represents the SD-WAN network performance tracking dashboard. The purpose of this slide is to demonstrate the performance of the SD-WAN network. The main components include control status, site health, transport interface distribution, WAN edge inventory, edge health, and so on. Crafting an eye-catching presentation has never been more straightforward. Let your presentation shine with this tasteful yet straightforward Virtual WAN Architecture SD WAN Network Performance Tracking Dashboard Designs PDF template. It offers a minimalistic and classy look that is great for making a statement. The colors have been employed intelligently to add a bit of playfulness while still remaining professional. Construct the ideal Virtual WAN Architecture SD WAN Network Performance Tracking Dashboard Designs PDF that effortlessly grabs the attention of your audience Begin now and be certain to wow your customers.
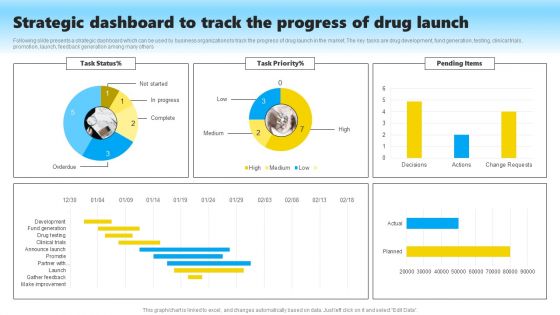
Strategic Dashboard To Track The Progress Of Drug Launch Structure PDF
Following slide presents a strategic dashboard which can be used by business organizations to track the progress of drug launch in the market. The key tasks are drug development, fund generation, testing, clinical trials, promotion, launch, feedback generation among many others. Pitch your topic with ease and precision using this Strategic Dashboard To Track The Progress Of Drug Launch Structure PDF. This layout presents information on Drug Development, Fund Generation, Testing, Clinical Trials, Promotion, Launch, Feedback Generation. It is also available for immediate download and adjustment. So, changes can be made in the color, design, graphics or any other component to create a unique layout.

Dashboard For Daily Operational Progress Summary With Tickets Resolved Background PDF
This slide showcases analytics to track everyday tickets solved and escalated to ensure its timely completion of business operations. It further includes details about first response and full resolution time. Pitch your topic with ease and precision using this Dashboard For Daily Operational Progress Summary With Tickets Resolved Background PDF. This layout presents information on Dashboard For Daily Operational, Progress Summary, Tickets Resolved. It is also available for immediate download and adjustment. So, changes can be made in the color, design, graphics or any other component to create a unique layout.
Marketers Guide To Data Analysis Optimization KPI Dashboard For Tracking Paid Ad Campaign Performance Clipart PDF
This slide covers the dashboard for analyzing paid search metrics such as ad cost, clicks, impressions, click-through rate, cost per conversion, conversion rate, cost per click, etc. Here you can discover an assortment of the finest PowerPoint and Google Slides templates. With these templates, you can create presentations for a variety of purposes while simultaneously providing your audience with an eye catching visual experience. Download Marketers Guide To Data Analysis Optimization KPI Dashboard For Tracking Paid Ad Campaign Performance Clipart PDF to deliver an impeccable presentation. These templates will make your job of preparing presentations much quicker, yet still, maintain a high level of quality. Slidegeeks has experienced researchers who prepare these templates and write high quality content for you. Later on, you can personalize the content by editing the Marketers Guide To Data Analysis Optimization KPI Dashboard For Tracking Paid Ad Campaign Performance Clipart PDF.

Guide For Effective Brand Performance Monitoring Dashboard To Track Brand Progress Ideas PDF
This slide provides information regarding monitoring dashboard to track brand performance through monitoring of session, new users, bounce rate, etc. Want to ace your presentation in front of a live audience Our Guide For Effective Brand Performance Monitoring Dashboard To Track Brand Progress Ideas PDF can help you do that by engaging all the users towards you. Slidegeeks experts have put their efforts and expertise into creating these impeccable powerpoint presentations so that you can communicate your ideas clearly. Moreover, all the templates are customizable, and easy-to-edit and downloadable. Use these for both personal and commercial use.

Key Elements Of Strategic Brand Administration Performance Monitoring Dashboard To Track Brand Progress Demonstration PDF
This slide provides information regarding monitoring dashboard to track brand performance through monitoring of session, new users, bounce rate, etc. Boost your pitch with our creative Key Elements Of Strategic Brand Administration Performance Monitoring Dashboard To Track Brand Progress Demonstration PDF. Deliver an awe-inspiring pitch that will mesmerize everyone. Using these presentation templates you will surely catch everyones attention. You can browse the ppts collection on our website. We have researchers who are experts at creating the right content for the templates. So you do not have to invest time in any additional work. Just grab the template now and use them.
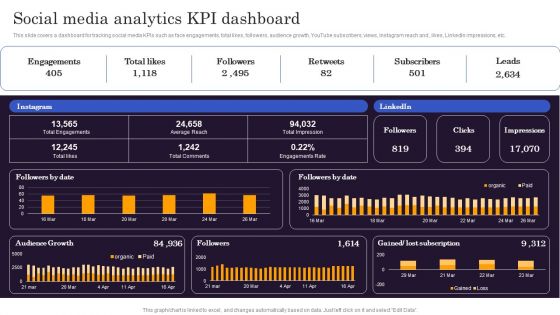
Marketers Guide To Data Analysis Optimization Social Media Analytics KPI Dashboard Clipart PDF
This slide covers a dashboard for tracking social media KPIs such as face engagements, total likes, followers, audience growth, YouTube subscribers, views, Instagram reach and , likes, LinkedIn impressions, etc. Find a pre designed and impeccable Marketers Guide To Data Analysis Optimization Social Media Analytics KPI Dashboard Clipart PDF. The templates can ace your presentation without additional effort. You can download these easy to edit presentation templates to make your presentation stand out from others. So, what are you waiting for Download the template from Slidegeeks today and give a unique touch to your presentation.
Reinforcement Learning Techniques And Applications Performance Tracking Dashboard Reinforcement Diagrams PDF
This slide shows the roadmap for the reinforcement learning project, including the list of tasks to be performed from March 2023 to February 2024. The tasks include initializing the values table, observing the current state, choosing an action for that state, and so on. Formulating a presentation can take up a lot of effort and time, so the content and message should always be the primary focus. The visuals of the PowerPoint can enhance the presenters message, so our Reinforcement Learning Techniques And Applications Performance Tracking Dashboard Reinforcement Diagrams PDF was created to help save time. Instead of worrying about the design, the presenter can concentrate on the message while our designers work on creating the ideal templates for whatever situation is needed. Slidegeeks has experts for everything from amazing designs to valuable content, we have put everything into Reinforcement Learning Techniques And Applications Performance Tracking Dashboard Reinforcement Diagrams PDF
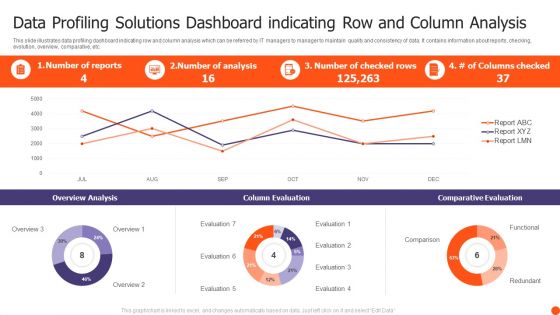
Data Profiling Solutions Dashboard Indicating Row And Column Analysis Summary PDF
This slide illustrates data profiling dashboard indicating row and column analysis which can be referred by IT managers to manager to maintain quality and consistency of data. It contains information about reports, checking, evolution, overview, comparative, etc. Showcasing this set of slides titled Data Profiling Solutions Dashboard Indicating Row And Column Analysis Summary PDF. The topics addressed in these templates are Overview Analysis, Column Evaluation, Comparative Evaluation. All the content presented in this PPT design is completely editable. Download it and make adjustments in color, background, font etc. as per your unique business setting.

Information Systems Security And Risk Management Plan Dashboard For Data Security Risk Management Information PDF
This slide showcases dashboard that can help organization in managing the data security risks. Its key elements are enterprise risk, risk by objectives, data protection finding and overdue actions by status. If you are looking for a format to display your unique thoughts, then the professionally designed Information Systems Security And Risk Management Plan Dashboard For Data Security Risk Management Information PDF is the one for you. You can use it as a Google Slides template or a PowerPoint template. Incorporate impressive visuals, symbols, images, and other charts. Modify or reorganize the text boxes as you desire. Experiment with shade schemes and font pairings. Alter, share or cooperate with other people on your work. Download Information Systems Security And Risk Management Plan Dashboard For Data Security Risk Management Information PDF and find out how to give a successful presentation. Present a perfect display to your team and make your presentation unforgettable.

Leveraging Predictive Maintenance To Enhance Production Process Dashboard To Track Production Plant Machines Efficiency Template PDF
Do you have to make sure that everyone on your team knows about any specific topic I yes, then you should give Leveraging Predictive Maintenance To Enhance Production This slide presents a dashboard to showcase the existing operational efficiency of production plant by covering multiple KPIs such as throughput, inventory turns, scarp rate and production target attainment Process Dashboard To Track Production Plant Machines Efficiency Template PDF a try. Our experts have put a lot of knowledge and effort into creating this impeccable Leveraging Predictive Maintenance To Enhance Production Process Dashboard To Track Production Plant Machines Efficiency Template PDF. You can use this template for your upcoming presentations, as the slides are perfect to represent even the tiniest detail. You can download these templates from the Slidegeeks website and these are easy to edit. So grab these today.

Intelligent Manufacturing Predictive Analytics Dashboard To Track Manufacturing Operations Information PDF
This slide depicts the predictive analytics dashboard to track manufacturing operations, including production volume, order volume, active machines, sales revenue, top five products, downtime causes, production volume by top five machines, and so on. If you are looking for a format to display your unique thoughts, then the professionally designed Intelligent Manufacturing Predictive Analytics Dashboard To Track Manufacturing Operations Information PDF is the one for you. You can use it as a Google Slides template or a PowerPoint template. Incorporate impressive visuals, symbols, images, and other charts. Modify or reorganize the text boxes as you desire. Experiment with shade schemes and font pairings. Alter, share or cooperate with other people on your work. Download Intelligent Manufacturing Predictive Analytics Dashboard To Track Manufacturing Operations Information PDF and find out how to give a successful presentation. Present a perfect display to your team and make your presentation unforgettable.

Iot Integration In Manufacturing Predictive Analytics Dashboard To Track Manufacturing Operations Background PDF
This slide depicts the predictive analytics dashboard to track manufacturing operations, including production volume, order volume, active machines, sales revenue, top five products, downtime causes, production volume by top five machines, and so on. If you are looking for a format to display your unique thoughts, then the professionally designed Iot Integration In Manufacturing Predictive Analytics Dashboard To Track Manufacturing Operations Background PDF is the one for you. You can use it as a Google Slides template or a PowerPoint template. Incorporate impressive visuals, symbols, images, and other charts. Modify or reorganize the text boxes as you desire. Experiment with shade schemes and font pairings. Alter, share or cooperate with other people on your work. Download Iot Integration In Manufacturing Predictive Analytics Dashboard To Track Manufacturing Operations Background PDF and find out how to give a successful presentation. Present a perfect display to your team and make your presentation unforgettable.

Transforming Manufacturing With Automation Predictive Analytics Dashboard To Track Diagrams PDF
This slide depicts the predictive analytics dashboard to track manufacturing operations, including production volume, order volume, active machines, sales revenue, top five products, downtime causes, production volume by top five machines, and so on. Get a simple yet stunning designed Transforming Manufacturing With Automation Predictive Analytics Dashboard To Track Diagrams PDF. It is the best one to establish the tone in your meetings. It is an excellent way to make your presentations highly effective. So, download this PPT today from Slidegeeks and see the positive impacts. Our easy to edit Transforming Manufacturing With Automation Predictive Analytics Dashboard To Track Diagrams PDF can be your go to option for all upcoming conferences and meetings. So, what are you waiting for Grab this template today.
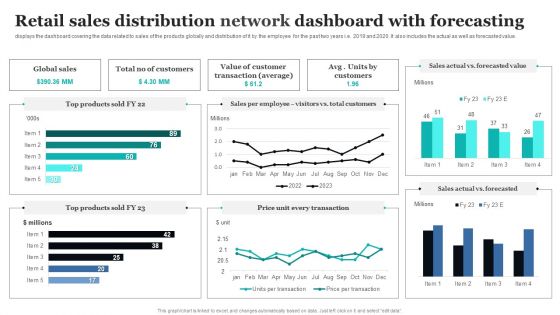
Retail Sales Distribution Network Dashboard With Forecasting Ppt PowerPoint Presentation File Design Templates PDF
Pitch your topic with ease and precision using this Retail Sales Distribution Network Dashboard With Forecasting Ppt PowerPoint Presentation File Design Templates PDF. This layout presents information on Global Sales, Value Customer, Total Customers. It is also available for immediate download and adjustment. So, changes can be made in the color, design, graphics or any other component to create a unique layout.

Client Acquisition Cost For Customer Retention Search Engine Marketing Dashboard For CAC Calculation Infographics PDF
This slide shows a Search Engine Marketing Dashboard with details such as lead form paid search, CAC, top performing campaigns, cost per conversion, cost per click etc. Deliver an awe inspiring pitch with this creative client acquisition cost for customer retention search engine marketing dashboard for cac calculation infographics pdf bundle. Topics like performing, campaign, social media, marketing, customer acquisition cost can be discussed with this completely editable template. It is available for immediate download depending on the needs and requirements of the user.

Estimating Business Overall Kpi Metrics Dashboard Highlighting Organization Revenue Clipart PDF
The following slide outlines key performance indicator KPI dashboard showcasing various financial metrics of the organization. The key metrics are gross revenue, product revenue, service revenue, gross profit, net profit etc. Formulating a presentation can take up a lot of effort and time, so the content and message should always be the primary focus. The visuals of the PowerPoint can enhance the presenters message, so our Estimating Business Overall Kpi Metrics Dashboard Highlighting Organization Revenue Clipart PDF was created to help save time. Instead of worrying about the design, the presenter can concentrate on the message while our designers work on creating the ideal templates for whatever situation is needed. Slidegeeks has experts for everything from amazing designs to valuable content, we have put everything into Estimating Business Overall Kpi Metrics Dashboard Highlighting Organization Revenue Clipart PDF.
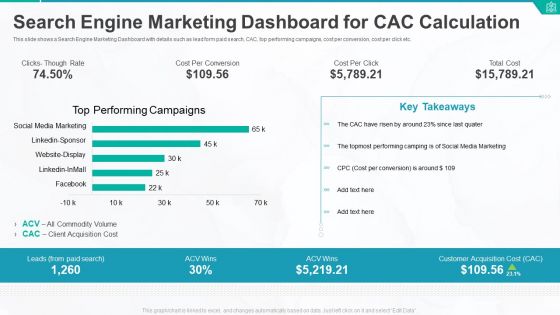
Search Engine Marketing Dashboard For CAC Calculation Ppt Styles Portrait PDF
This slide shows a Search Engine Marketing Dashboard with details such as lead form paid search, CAC, top performing campaigns, cost per conversion, cost per click etc. Deliver and pitch your topic in the best possible manner with this search engine marketing dashboard for cac calculation ppt styles portrait pdf. Use them to share invaluable insights on cost per conversion, cost per click, key takeaways, performing campaigns, client acquisition cost and impress your audience. This template can be altered and modified as per your expectations. So, grab it now.
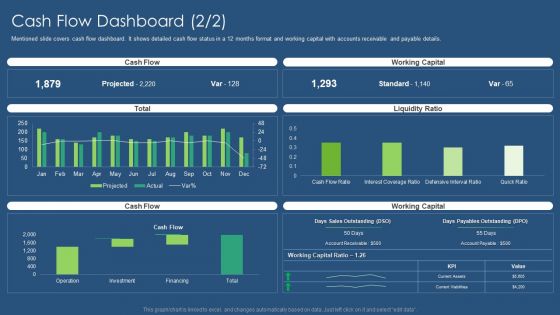
Sustainability Calculation With KPI Cash Flow Dashboard Liquidity Ratio Inspiration PDF Introduction PDF
Following slide covers cash flow dashboard covering details like beginning cash on hand, cash going in, cash going out, profit loss and ending cash on hand. It also includes detail of accounts receivable and payable. Deliver an awe inspiring pitch with this creative sustainability calculation with kpi cash flow dashboard cash designs pdf bundle. Topics like beginning cash on hand, cash going out, profit and loss, ending cash on hand can be discussed with this completely editable template. It is available for immediate download depending on the needs and requirements of the user.

Sustainability Calculation With KPI Customer Service Dashboard Revenue Ideas PDF Graphics PDF
Following slide illustrates customer service dashboard covering details such as request answered, total requests, total revenue and support cost revenue. It also includes customer satisfaction score, customer retention in a 12 months format. Deliver and pitch your topic in the best possible manner with this sustainability calculation with kpi customer service dashboard microsoft pdf. Use them to share invaluable insights on customer satisfaction, revenue, customer retention and impress your audience. This template can be altered and modified as per your expectations. So, grab it now.
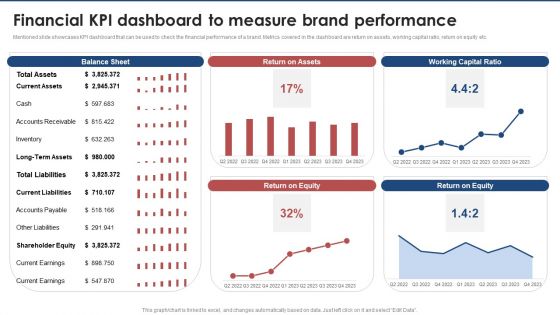
Financial Kpi Dashboard To Measure Brand Performance Brand Value Estimation Guide Inspiration PDF
Mentioned slide showcases KPI dashboard that can be used to check the financial performance of a brand. Metrics covered in the dashboard are return on assets, working capital ratio, return on equity etc.Are you in need of a template that can accommodate all of your creative concepts This one is crafted professionally and can be altered to fit any style. Use it with Google Slides or PowerPoint. Include striking photographs, symbols, depictions, and other visuals. Fill, move around, or remove text boxes as desired. Test out color palettes and font mixtures. Edit and save your work, or work with colleagues. Download Financial Kpi Dashboard To Measure Brand Performance Brand Value Estimation Guide Inspiration PDF and observe how to make your presentation outstanding. Give an impeccable presentation to your group and make your presentation unforgettable.

 Home
Home