Progress Infographic

Quarterly Sales Growth Chart For Financial Report Ppt PowerPoint Presentation Ideas Infographics
Presenting this set of slides with name quarterly sales growth chart for financial report ppt powerpoint presentation ideas infographics. The topics discussed in these slides are revenue trend, bar chart, financial. This is a completely editable PowerPoint presentation and is available for immediate download. Download now and impress your audience.

Quality Cost Report Comparison Template 1 Ppt PowerPoint Presentation Pictures Infographics
This is a quality cost report comparison template 1 ppt powerpoint presentation pictures infographics. This is a five stage process. The stages in this process are amount, percent, year, appraisal cost, prevention cost.
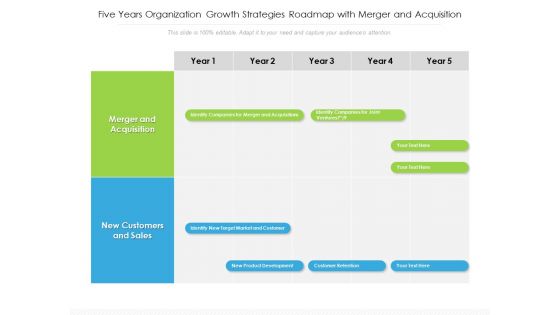
Five Years Organization Growth Strategies Roadmap With Merger And Acquisition Infographics
Presenting the five years organization growth strategies roadmap with merger and acquisition infographics. The template includes a roadmap that can be used to initiate a strategic plan. Not only this, the PowerPoint slideshow is completely editable and you can effortlessly modify the font size, font type, and shapes according to your needs. This PPT slide can be easily reached in standard screen and widescreen aspect ratios. The set is also available in various formats like PDF, PNG, and JPG. So download and use it multiple times as per your knowledge.
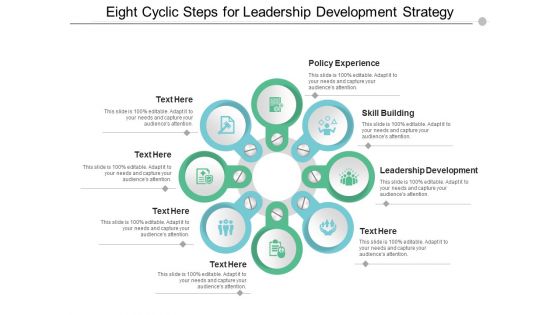
eight cyclic steps for leadership development strategy ppt powerpoint presentation styles infographics
This is a eight cyclic steps for leadership development strategy ppt powerpoint presentation styles infographics. This is a eight stage process. The stages in this process are cycle diagram, circular process, cyclical process.
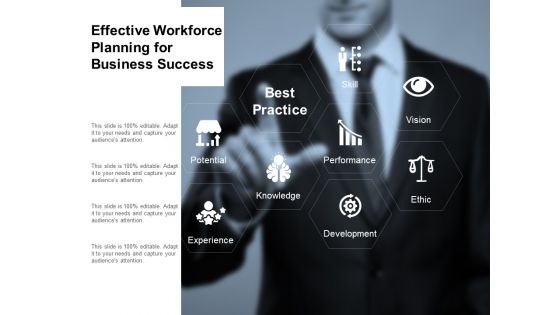
Effective Workforce Planning For Business Success Ppt Powerpoint Presentation Ideas Infographics
This is a effective workforce planning for business success ppt powerpoint presentation ideas infographics. This is a four stage process. The stages in this process are best practice, best technique, best procedure.

Image Of A Man Standing Different Direction Ppt PowerPoint Presentation Slides Infographics
Presenting this set of slides with name image of a man standing different direction ppt powerpoint presentation slides infographics. The topics discussed in these slides are arrow large, arrow showing, goals. This is a completely editable PowerPoint presentation and is available for immediate download. Download now and impress your audience.
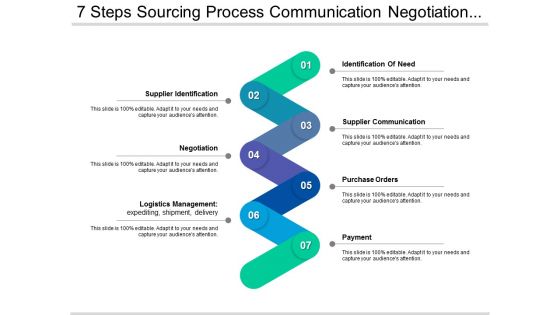
7 Steps Sourcing Process Communication Negotiation And Payment Ppt PowerPoint Presentation Visual Aids Infographics
This is a 7 Steps Sourcing Process Communication Negotiation And Payment Ppt PowerPoint Presentation Visual Aids Infographics. This is a seven stage process. The stages in this process are purchasing, procurement, bidding.
Three Steps Of Product Distribution Management With Icons Ppt PowerPoint Presentation Outline Infographics
Presenting this set of slides with name three steps of product distribution management with icons ppt powerpoint presentation outline infographics. This is a three stage process. The stages in this process are supply chain infographics, logistics management, product distribution management. This is a completely editable PowerPoint presentation and is available for immediate download. Download now and impress your audience.

Strategic Management Process Vision Goals And Action Plan Ppt PowerPoint Presentation Visual Aids Infographics
This is a strategic management process vision goals and action plan ppt powerpoint presentation visual aids infographics. This is a eight stage process. The stages in this process are business marketing plan, business marketing strategies, business marketing approach.
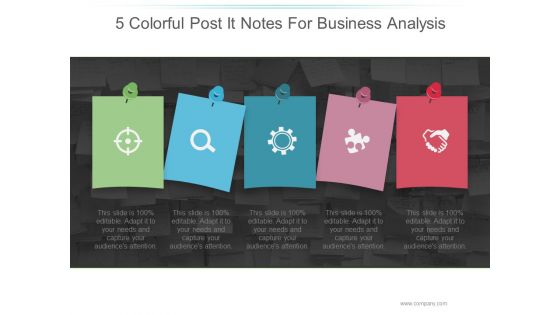
5 Colorful Post It Notes For Business Analysis Ppt PowerPoint Presentation Infographics
This is a 5 colorful post it notes for business analysis ppt powerpoint presentation infographics. This is a five stage process. The stages in this process are business, marketing, icons, post it, analysis.
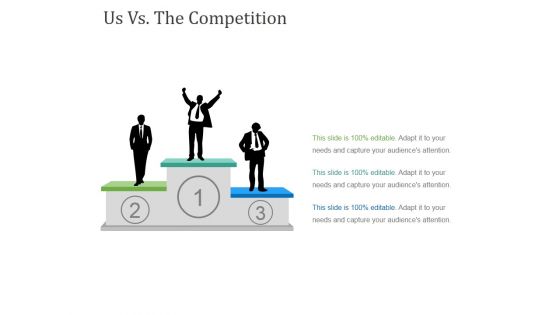
Us Vs The Competition Template 1 Ppt PowerPoint Presentation Slides Infographics
This is a us vs the competition template 1 ppt powerpoint presentation slides infographics. This is a three stage process. The stages in this process are competition, business, marketing, success, presentation.
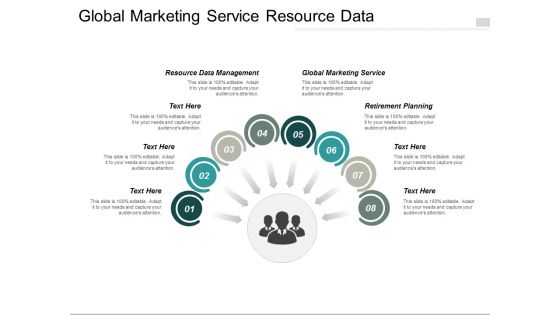
Global Marketing Service Resource Data Management Retirement Planning Ppt PowerPoint Presentation Layouts Infographics
This is a global marketing service resource data management retirement planning ppt powerpoint presentation layouts infographics. This is a four stage process. The stages in this process are global marketing service, resource data management, retirement planning.

Retail Loss Prevention Plan Employee Engagement Initiatives Examples Ppt PowerPoint Presentation Layouts Infographics
This is a retail loss prevention plan employee engagement initiatives examples ppt powerpoint presentation layouts infographics. This is a seven stage process. The stages in this process are retail loss prevention plan, employee engagement initiatives examples.
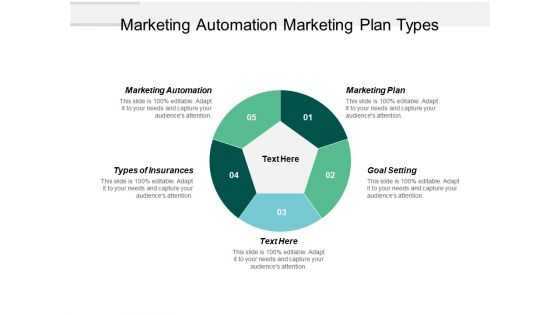
Marketing Automation Marketing Plan Types Of Insurances Goal Setting Ppt PowerPoint Presentation Professional Infographics
This is a marketing automation marketing plan types of insurances goal setting ppt powerpoint presentation professional infographics. This is a five stage process. The stages in this process are marketing automation, marketing plan, types of insurances, goal setting.
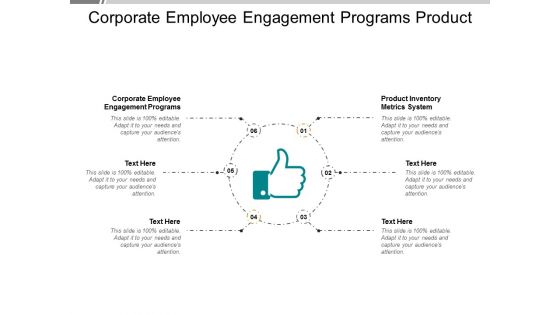
Corporate Employee Engagement Programs Product Inventory Metrics System Ppt PowerPoint Presentation Infographics
This is a corporate employee engagement programs product inventory metrics system ppt powerpoint presentation infographics. This is a six stage process. The stages in this process are corporate employee engagement programs, product inventory metrics system.
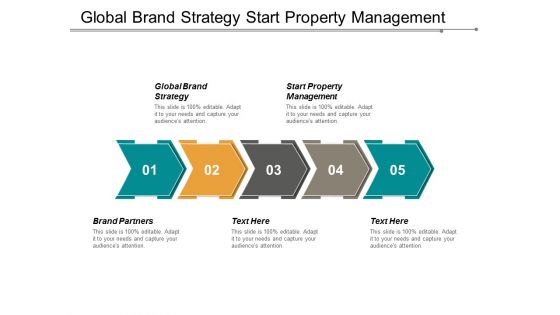
Global Brand Strategy Start Property Management Brand Partners Ppt PowerPoint Presentation Infographics Master Slide
This is a global brand strategy start property management brand partners ppt powerpoint presentation infographics. This is a five stage process. The stages in this process are global brand strategy, start property management, brand partners.

Qualitative Description Of Human Experience Task Time Distance Ppt PowerPoint Presentation Visual Aids Infographics
This is a qualitative description of human experience task time distance ppt powerpoint presentation visual aids infographics. This is a five stage process. The stages in this process are analysis, observation, qualitative.
Eight Steps Circular Process Flow With Icons Ppt PowerPoint Presentation Model Infographics
This is a eight steps circular process flow with icons ppt powerpoint presentation model infographics. This is a eight stage process. The stages in this process are 10 circle, 10 circular diagram, 10 cycle.
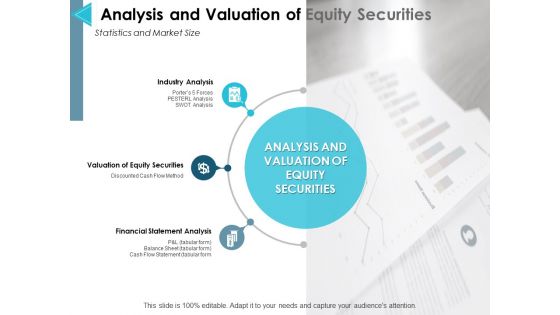
Analysis And Valuation Of Equity Securities Ppt PowerPoint Presentation Show Infographics
This is a analysis and valuation of equity securities ppt powerpoint presentation show infographics. This is a three stage process. The stages in this process are industry analysis, financial statement analysis, management, marketing, business, strategy.
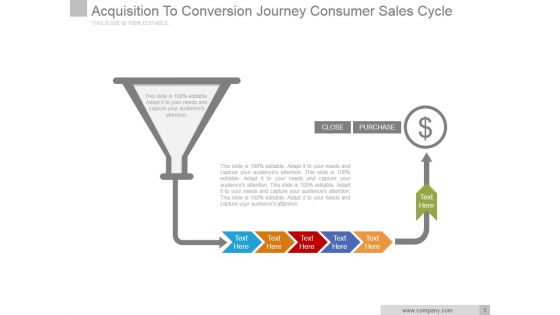
Acquisition To Conversion Journey Consumer Sales Cycle Ppt PowerPoint Presentation Infographics
This is a acquisition to conversion journey consumer sales cycle ppt powerpoint presentation infographics. This is a one stage process. The stages in this process are business, marketing, management, symbol, arrow, funnel.

What Do I Bring To The Table Ppt PowerPoint Presentation Show Infographics
This is a what do i bring to the table ppt powerpoint presentation show infographics. This is a eight stage process. The stages in this process are business, strategy, marketing, analysis.
Product Positioning And Branding Process With Icons Ppt PowerPoint Presentation Layouts Infographics
Presenting this set of slides with name product positioning and branding process with icons ppt powerpoint presentation layouts infographics. This is a four stage process. The stages in this process are brand positioning, brand name selection, brand sponsorship, brand development. This is a completely editable PowerPoint presentation and is available for immediate download. Download now and impress your audience.
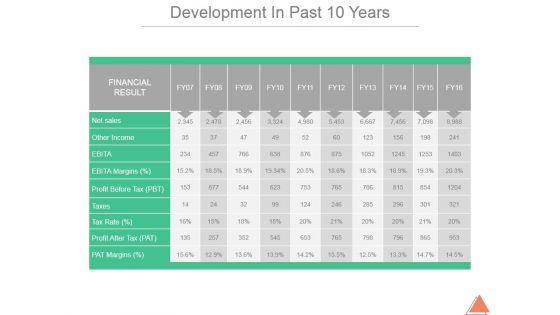
Development In Past 10 Years Template 1 Ppt PowerPoint Presentation Infographics
This is a development in past 10 years template 1 ppt powerpoint presentation infographics. This is a ten stage process. The stages in this process are net sales, other income, ebita margins, profit before tax, taxes.
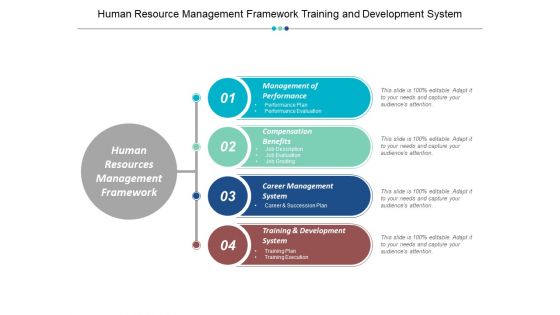
Human Resource Management Framework Training And Development System Ppt Powerpoint Presentation Gallery Infographics
This is a human resource management framework training and development system ppt powerpoint presentation gallery infographics. This is a four stage process. The stages in this process are policy framework, policy model, policy structure.
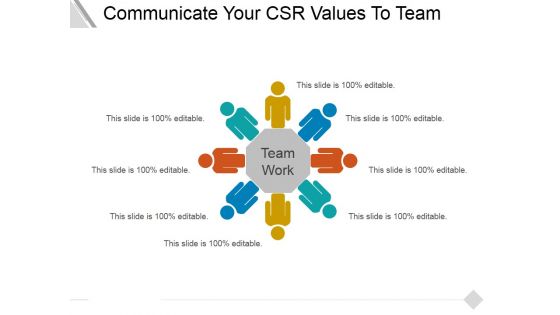
Communicate Your Csr Values To Team Ppt PowerPoint Presentation Layouts Infographics
This is a communicate your csr values to team ppt powerpoint presentation layouts infographics. This is a eight stage process. The stages in this process are communicate, team, values, planning, strategy.
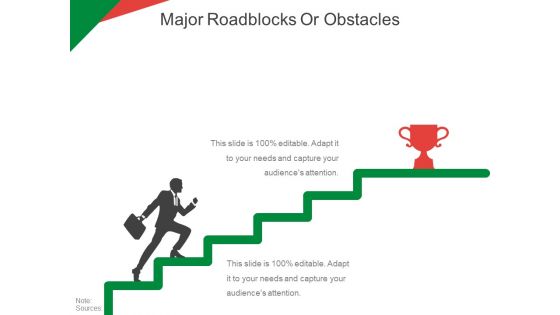
Major Roadblocks Or Obstacles Template 1 Ppt PowerPoint Presentation Pictures Infographics
This is a major roadblocks or obstacles template 1 ppt powerpoint presentation pictures infographics. This is a two stage process. The stages in this process are business, marketing, strategy, silhouettes, management.
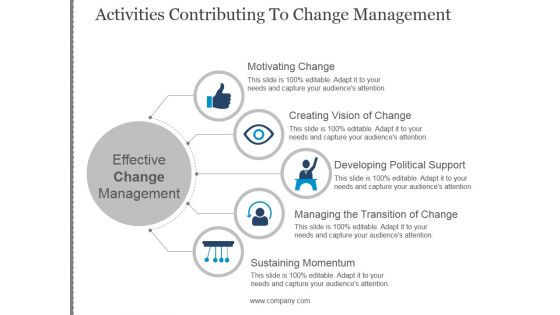
Activities Contributing To Change Management Template 2 Ppt PowerPoint Presentation Infographics
This is a activities contributing to change management template 2 ppt powerpoint presentation infographics. This is a five stage process. The stages in this process are sustaining momentum, managing the transition of change, developing political support, motivating change, creating vision of change, effective change management.
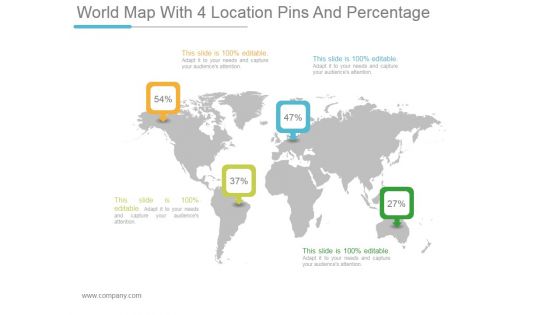
World Map With 4 Location Pins And Percentage Ppt PowerPoint Presentation Infographics
This is a world map with 4 location pins and percentage ppt powerpoint presentation infographics. This is a four stage process. The stages in this process are business, marketing, success, planning, map.
Resolution Of Conflict In Round Puzzle Ppt PowerPoint Presentation Icon Infographics
Presenting this set of slides with name resolution of conflict in round puzzle ppt powerpoint presentation icon infographics. This is a five stage process. The stages in this process are process, round puzzle, circle puzzle. This is a completely editable PowerPoint presentation and is available for immediate download. Download now and impress your audience.
Challenges Of Consumer Engagement With Icons Ppt PowerPoint Presentation Portfolio Infographics
Presenting this set of slides with name challenges of consumer engagement with icons ppt powerpoint presentation portfolio infographics. This is a four stage process. The stages in this process are customer engagement, consumer retention, satisfaction process. This is a completely editable PowerPoint presentation and is available for immediate download. Download now and impress your audience.
Three Key Features Of Brand With Icons Ppt PowerPoint Presentation Summary Infographics
Presenting this set of slides with name three key features of brand with icons ppt powerpoint presentation summary infographics. This is a three stage process. The stages in this process are brand attributes, core values, branding and market. This is a completely editable PowerPoint presentation and is available for immediate download. Download now and impress your audience.

Urban Development Rapid Rail Transit System Ppt PowerPoint Presentation Slides Infographics
Presenting this set of slides with name urban development rapid rail transit system ppt powerpoint presentation slides infographics. The topics discussed in these slides are infrastructure icon, organizational structures icon, physical systems icon. This is a completely editable PowerPoint presentation and is available for immediate download. Download now and impress your audience.
New Product Development Cost Assessment Icons Slide Ppt PowerPoint Presentation Model Infographics
Presenting this set of slides containing editable icons for topic new product development cost assessment icons slide ppt powerpoint presentation model infographics. All icons in this slide are 100 percent editable. You can replace icons in your deck with any of these icons. Download now and impress your audience.

Target Customer Analysis Evaluating Target Market Size For Global Expansion Infographics PDF
This slide showcases evaluation of target market size for expanding globally into foreign market. It can help to identify the potential of target market for launching new product or service. Do you have to make sure that everyone on your team knows about any specific topic I yes, then you should give Target Market, Expected To Grow, 2023 To 2026 a try. Our experts have put a lot of knowledge and effort into creating this impeccable Target Market, Expected To Grow, 2023 To 2026. You can use this template for your upcoming presentations, as the slides are perfect to represent even the tiniest detail. You can download these templates from the Slidegeeks website and these are easy to edit. So grab these today.
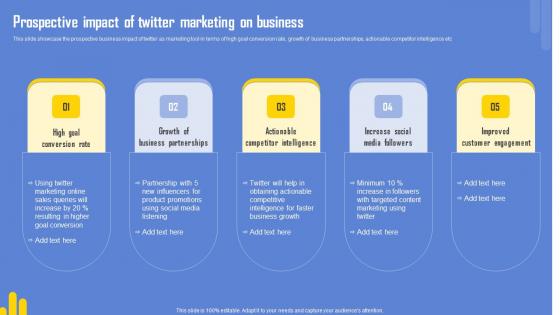
Optimizing Twitter For Online Prospective Impact Of Twitter Marketing On Business Infographics Pdf
This slide showcase the prospective business impact of twitter as marketing tool in terms of high goal conversion rate, growth of business partnerships, actionable competitor intelligence etc Coming up with a presentation necessitates that the majority of the effort goes into the content and the message you intend to convey. The visuals of a PowerPoint presentation can only be effective if it supplements and supports the story that is being told. Keeping this in mind our experts created Optimizing Twitter For Online Popular Time To Post Marketing Content On Twitter Structure Pdf to reduce the time that goes into designing the presentation. This way, you can concentrate on the message while our designers take care of providing you with the right template for the situation.
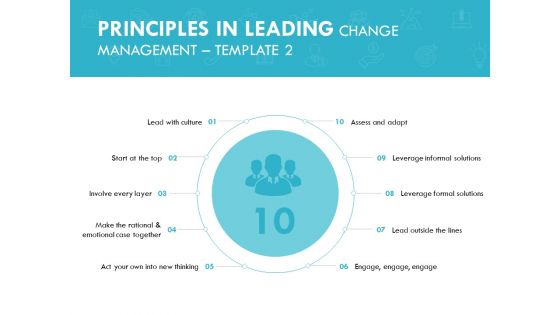
Principles In Leading Change Management Engage Ppt PowerPoint Presentation Summary Infographics
Presenting this set of slides with name principles in leading change management engage ppt powerpoint presentation summary infographics. This is a ten stage process. The stages in this process are culture, involve every layer, make the rational, engage, leverage formal solutions, leverage informal solutions, assess and adapt. This is a completely editable PowerPoint presentation and is available for immediate download. Download now and impress your audience.

Half Yearly Roadmap For Affordable Community Home Development With Timeline Infographics
Presenting the half yearly roadmap for affordable community home development with timeline infographics. The template includes a roadmap that can be used to initiate a strategic plan. Not only this, the PowerPoint slideshow is completely editable and you can effortlessly modify the font size, font type, and shapes according to your needs. This PPT slide can be easily reached in standard screen and widescreen aspect ratios. The set is also available in various formats like PDF, PNG, and JPG. So download and use it multiple times as per your knowledge.
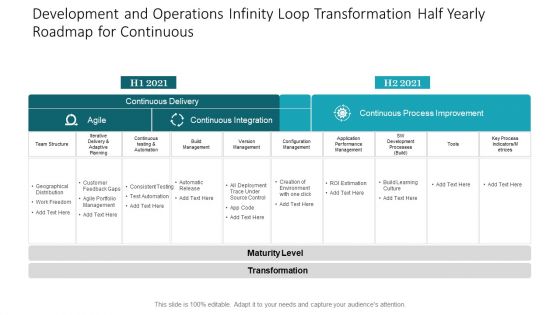
Development And Operations Infinity Loop Transformation Half Yearly Roadmap For Continuous Infographics
Presenting our jaw dropping development and operations infinity loop transformation half yearly roadmap for continuous infographics. You can alternate the color, font size, font type, and shapes of this PPT layout according to your strategic process. This PPT presentation is compatible with Google Slides and is available in both standard screen and widescreen aspect ratios. You can also download this well researched PowerPoint template design in different formats like PDF, JPG, and PNG. So utilize this visually appealing design by clicking the download button given below.

Half Yearly Training Roadmap For New Commodity Development By Supervisor Infographics
Presenting our jaw dropping half yearly training roadmap for new commodity development by supervisor infographics. You can alternate the color, font size, font type, and shapes of this PPT layout according to your strategic process. This PPT presentation is compatible with Google Slides and is available in both standard screen and widescreen aspect ratios. You can also download this well researched PowerPoint template design in different formats like PDF, JPG, and PNG. So utilize this visually appealing design by clicking the download button given below.

Six Months Software Development Service Roadmap For Optimal Commodity Process Infographics
Presenting our jaw dropping six months software development service roadmap for optimal commodity process infographics. You can alternate the color, font size, font type, and shapes of this PPT layout according to your strategic process. This PPT presentation is compatible with Google Slides and is available in both standard screen and widescreen aspect ratios. You can also download this well researched PowerPoint template design in different formats like PDF, JPG, and PNG. So utilize this visually appealing design by clicking the download button given below.
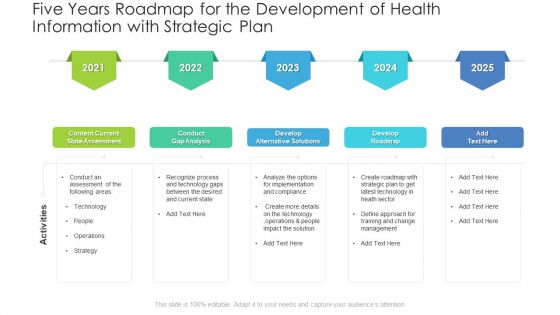
Five Years Roadmap For The Development Of Health Information With Strategic Plan Infographics
Presenting the five years roadmap for the development of health information with strategic plan infographics. The template includes a roadmap that can be used to initiate a strategic plan. Not only this, the PowerPoint slideshow is completely editable and you can effortlessly modify the font size, font type, and shapes according to your needs. This PPT slide can be easily reached in standard screen and widescreen aspect ratios. The set is also available in various formats like PDF, PNG, and JPG. So download and use it multiple times as per your knowledge.
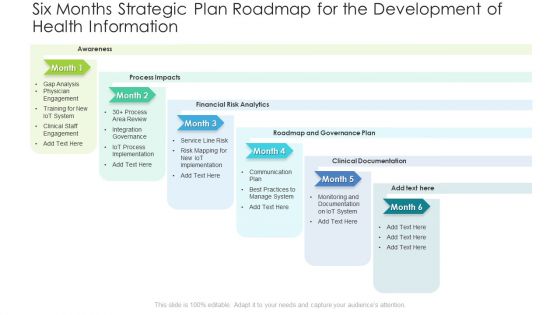
Six Months Strategic Plan Roadmap For The Development Of Health Information Infographics
Presenting our jaw dropping six months strategic plan roadmap for the development of health information infographics. You can alternate the color, font size, font type, and shapes of this PPT layout according to your strategic process. This PPT presentation is compatible with Google Slides and is available in both standard screen and widescreen aspect ratios. You can also download this well researched PowerPoint template design in different formats like PDF, JPG, and PNG. So utilize this visually appealing design by clicking the download button given below.

Six Methods Of System Execution Process Ppt PowerPoint Presentation Show Infographics
Presenting this set of slides with name six methods of system execution process ppt powerpoint presentation show infographics. This is a six stage process. The stages in this process are software implementation, application development, implementation develop. This is a completely editable PowerPoint presentation and is available for immediate download. Download now and impress your audience.
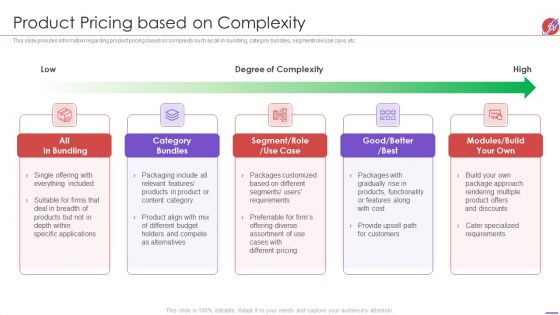
New Product Development And Launch To Market Product Pricing Based On Complexity Infographics PDF
This slide provides information regarding product pricing based on complexity such as all in bundling, category bundles, segmen role use case, etc. Presenting new product development and launch to market product pricing based on complexity elements pdf to provide visual cues and insights. Share and navigate important information on five stages that need your due attention. This template can be used to pitch topics like bundling, category, segment, modules . In addtion, this PPT design contains high resolution images, graphics, etc, that are easily editable and available for immediate download.
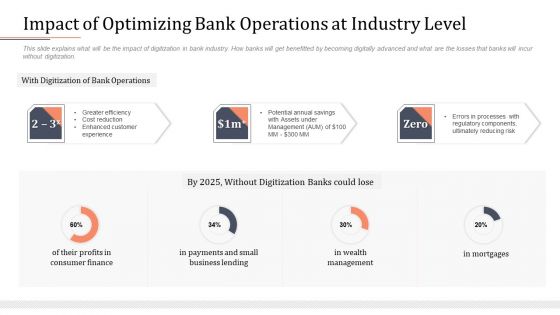
Modifying Banking Functionalities Impact Of Optimizing Bank Operations At Industry Level Infographics PDF
This slide explains what will be the impact of digitization in bank industry. How banks will get benefitted by becoming digitally advanced and what are the losses that banks will incur without digitization. Deliver and pitch your topic in the best possible manner with this enhancing financial institution operations impact of optimizing bank operations at industry level guidelines pdf. Use them to share invaluable insights on management, business, consumer, finance and impress your audience. This template can be altered and modified as per your expectations. So, grab it now.

Business Diagram Four Staged Modern Infographics For Team Success Presentation Template
Four staged modern info graphics has been used to design this power point template. This PPT contains the concept of team success. Use this PPT for management related presentations.
Business Daigram Five Staged Infographics And Icons For Business Presentation Templets
This business diagram displays five staged info graphics and icons. Download this diagram to represent business activities. We have used icons in this diagram to give it professional look.
Business Diagram Infographics With Multiple Icons For Data Representation Presentation Template
This business diagram has been designed with graphic of multiple icons info graphics. Download this diagram to analyze the key points. This diagram offers a way for your audience to visually conceptualize the process.

Business Diagram Four Staged Pencil Infographics For Data Representation PowerPoint Template
Four staged pencil info graphics has been used to design this power point template. This diagram template contains the concept of data representations. Use this PPT for your business and marketing presentations.

Business Diagram Four Staged Text Infographics For Data Representation Presentation Template
Four staged info graphics has been used to design this PowerPoint template. This slide can be used for text representation. Present your views using this innovative slide and be assured of leaving a lasting impression.
Business Diagram Three Staged Business Infographics For Data Representation Presentation Template
Three staged info graphics has been used to design this PowerPoint template. This slide can be used for text representation. Present your views using this innovative slide and be assured of leaving a lasting impression.

Business Diagram Five Staged Colored Infographics For Business Data Presentation Template
Five staged colored info graphics has been used to design this PowerPoint template. Download our above diagram to express information in a visual way. This diagram offers a way for your audience to visually conceptualize the process.
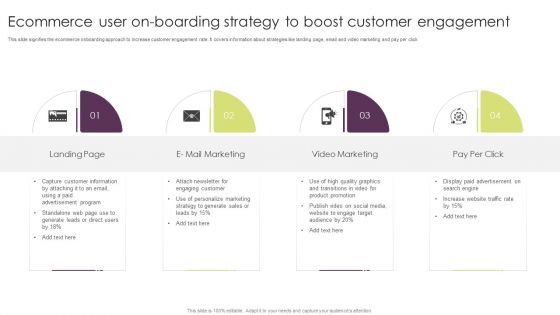
Ecommerce User On Boarding Strategy To Boost Customer Engagement Infographics PDF
This slide signifies the ecommerce onboarding approach to increase customer engagement rate. It covers information about strategies like landing page, email and video marketing and pay per click. Persuade your audience using this Landing Page, Video Marketing, Pay Per Click. This PPT design covers Four stages, thus making it a great tool to use. It also caters to a variety of topics including Landing Page, Video Marketing, Pay Per Click. Download this PPT design now to present a convincing pitch that not only emphasizes the topic but also showcases your presentation skills.
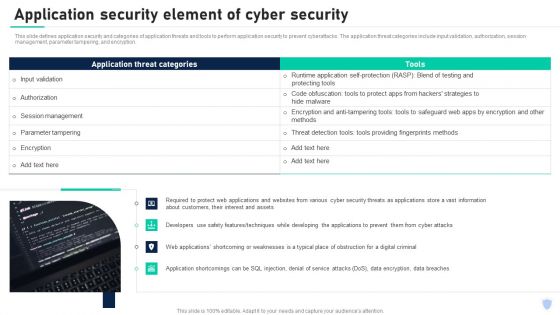
Cyber Security Components To Enhance Processes Application Security Element Of Cyber Security Infographics PDF
This slide defines application security and categories of application threats and tools to perform application security to prevent cyberattacks. The application threat categories include input validation, authorization, session management, parameter tampering, and encryption. Boost your pitch with our creative Cyber Security Components To Enhance Processes Career Opportunities In Cybersecurity Profession Sample PDF. Deliver an awe inspiring pitch that will mesmerize everyone. Using these presentation templates you will surely catch everyones attention. You can browse the ppts collection on our website. We have researchers who are experts at creating the right content for the templates. So you do not have to invest time in any additional work. Just grab the template now and use them.
Business Diagram Five Staged Linear Infographics With Icons For Data Representation Ppt Template
Five staged linear info graphics with icons has been used to craft this power point template. This diagram template contains the concept of data representation. Use this PPT for your business and marketing data related topics in any presentations.
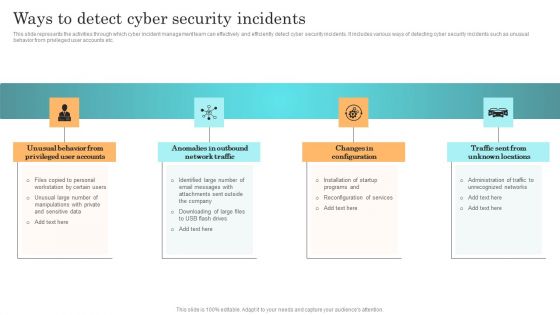
Incident Response Techniques Deployement Ways To Detect Cyber Security Incidents Infographics PDF
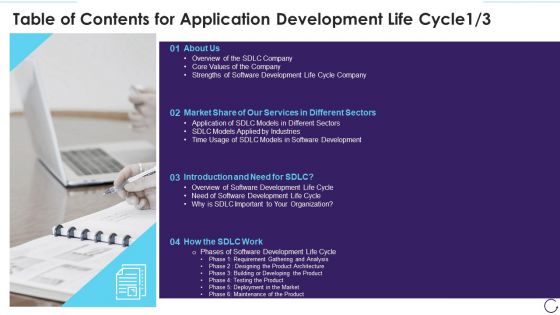
Table Of Contents For Application Development Life Cycle Market Infographics PDF
Presenting strengths of software development life cycle company topics pdf to provide visual cues and insights. Share and navigate important information on four stages that need your due attention. This template can be used to pitch topics like market, services, company, development, organization. In addtion, this PPT design contains high resolution images, graphics, etc, that are easily editable and available for immediate download.
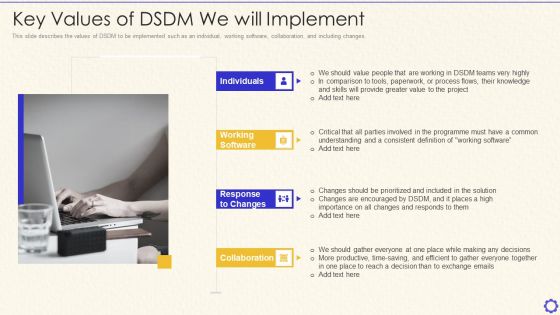
Dynamic System Development Method Tools And Techniques IT Key Values Of DSDM Infographics PDF
This slide describes the values of DSDM to be implemented such as an individual, working software, collaboration, and including changes. This is a dynamic system development method tools and techniques it key benefits of adopting dsdm elements pdf template with various stages. Focus and dispense information on four stages using this creative set, that comes with editable features. It contains large content boxes to add your information on topics like comparison, process, knowledge, value, project. You can also showcase facts, figures, and other relevant content using this PPT layout. Grab it now.

Application Development Life Cycle Advantage And Disadvantages Of Incremental Model Infographics PDF
This slide represents the advantages, and disadvantages of the incremental model, including easy error detection, accessibility to test and troubleshoot, adaptability, ease to manage risk, and so on. This is a 30 60 90 days plan for software development life cycle structure pdf template with various stages. Focus and dispense information on two stages using this creative set, that comes with editable features. It contains large content boxes to add your information on topics like advantage and disadvantages of incremental model. You can also showcase facts, figures, and other relevant content using this PPT layout. Grab it now.

Modifying Banking Functionalities Overall Impact Of Bank Operations Transformation Costs Infographics PDF
This slide depicts the impact of successful transformation in terms of bank operations which resulted in reduction of overall bank expenses. In house training of customers has lower down training costs by 21percent. Deliver an awe inspiring pitch with this creative enhancing financial institution operations overall impact of bank operations transformation costs formats pdf bundle. Topics like process, costs, training can be discussed with this completely editable template. It is available for immediate download depending on the needs and requirements of the user.

 Home
Home