Procurement Dashboard
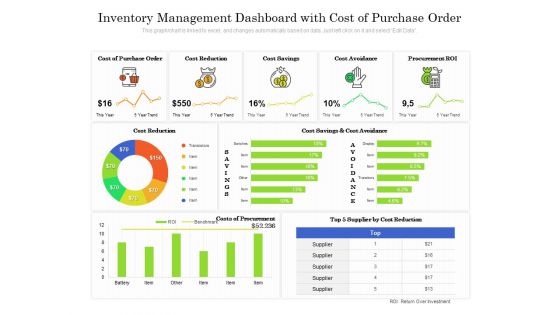
Inventory Management Dashboard With Cost Of Purchase Order Ppt PowerPoint Presentation Gallery Files PDF
Presenting this set of slides with name inventory management dashboard with cost of purchase order ppt powerpoint presentation gallery files pdf. The topics discussed in these slides are cost reduction, cost savings, cost avoidance. This is a completely editable PowerPoint presentation and is available for immediate download. Download now and impress your audience.

Sales Order Summary KPI Dashboard How To Improve Company PPT Sample Strategy SS V
The following slide showcases monthly and half-yearly order summary. It includes elements such as revenue days, refund, transaction status, paid, unpaid, subscriptions, current and previous details, etc. Do you know about Slidesgeeks Sales Order Summary KPI Dashboard How To Improve Company PPT Sample Strategy SS V These are perfect for delivering any kind od presentation. Using it, create PowerPoint presentations that communicate your ideas and engage audiences. Save time and effort by using our pre-designed presentation templates that are perfect for a wide range of topic. Our vast selection of designs covers a range of styles, from creative to business, and are all highly customizable and easy to edit. Download as a PowerPoint template or use them as Google Slides themes.
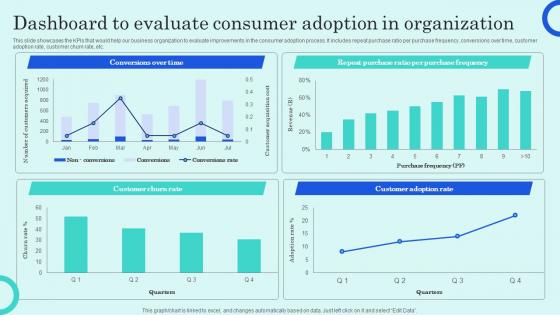
Dashboard To Evaluate Consumer Adoption In Overview Of Customer Adoption Process Microsoft Pdf
This slide showcases the KPIs that would help our business organization to evaluate improvements in the consumer adoption process. It includes repeat purchase ratio per purchase frequency, conversions over time, customer adoption rate, customer churn rate, etc. Present like a pro with Dashboard To Evaluate Consumer Adoption In Overview Of Customer Adoption Process Microsoft Pdf Create beautiful presentations together with your team, using our easy to use presentation slides. Share your ideas in real time and make changes on the fly by downloading our templates. So whether youre in the office, on the go, or in a remote location, you can stay in sync with your team and present your ideas with confidence. With Slidegeeks presentation got a whole lot easier. Grab these presentations today.
Monthly Sales Reporting And Projections Dashboard Icon Ppt Icon Clipart Images PDF
Persuade your audience using this Monthly Sales Reporting And Projections Dashboard Icon Ppt Icon Clipart Images PDF. This PPT design covers three stages, thus making it a great tool to use. It also caters to a variety of topics including Monthly Sale,s Reporting And Projections, Dashboard Icon. Download this PPT design now to present a convincing pitch that not only emphasizes the topic but also showcases your presentation skills.

Foreign Exchange Stock Trading Dashboard Showing Market Fluctuations Ppt PowerPoint Presentation Portfolio Mockup PDF
Persuade your audience using this foreign exchange stock trading dashboard showing market fluctuations ppt powerpoint presentation portfolio mockup pdf. This PPT design covers one stages, thus making it a great tool to use. It also caters to a variety of topics including foreign exchange stock trading dashboard showing market fluctuations. Download this PPT design now to present a convincing pitch that not only emphasizes the topic but also showcases your presentation skills.
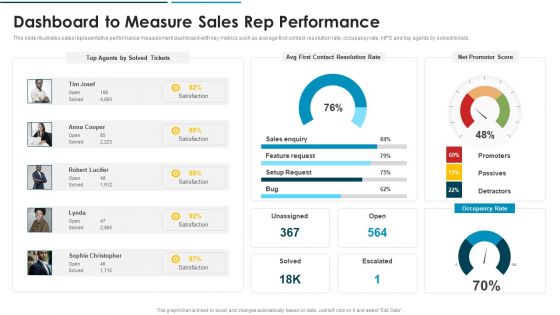
Go To Market Approach For New Product Dashboard To Measure Sales Rep Performance Formats PDF
This slide illustrates sales representative performance measurement dashboard with key metrics such as average first contact resolution rate, occupancy rate, NPS and top agents by solved tickets.Deliver and pitch your topic in the best possible manner with this Go To Market Approach For New Product Dashboard To Measure Sales Rep Performance Formats PDF Use them to share invaluable insights on Dashboard To Measure Sales Rep Performance and impress your audience. This template can be altered and modified as per your expectations. So, grab it now.

Maintaining Partner Relationships KPI Dashboard To Measure Sales Performance Rules PDF
Following slide illustrates sales performance monitoring dashboard. KPIs included in the dashboard are sales revenue, sales growth, average revenue per unit, customer lifetime value and customer acquisition cost. Deliver and pitch your topic in the best possible manner with this Maintaining Partner Relationships KPI Dashboard To Measure Sales Performance Rules PDF. Use them to share invaluable insights on Sales Country Performance, Above Sales Target, YTD, Customer Lifetime Value, Customer Acquisition Cost and impress your audience. This template can be altered and modified as per your expectations. So, grab it now.

Partnership Management Strategies Kpi Dashboard To Measure Sales Performance Introduction PDF
Following slide illustrates sales performance monitoring dashboard. KPIs included in the dashboard are sales revenue, sales growth, average revenue per unit, customer lifetime value and customer acquisition cost.Deliver and pitch your topic in the best possible manner with this partnership management strategies kpi dashboard to measure sales performance introduction pdf Use them to share invaluable insights on average revenue, monthly sales growth, customer acquisition cost and impress your audience. This template can be altered and modified as per your expectations. So, grab it now.
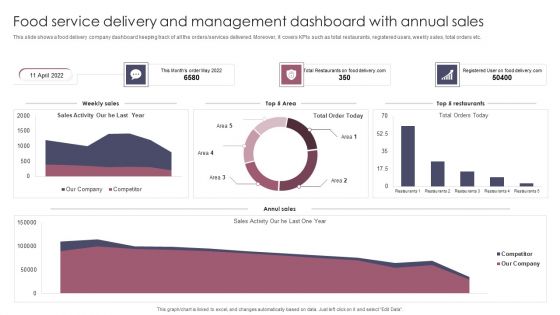
Food Service Delivery And Management Dashboard With Annual Sales Brochure PDF
This slide shows a food delivery company dashboard keeping track of all the orders or services delivered. Moreover, it covers KPIs such as total restaurants, registered users, weekly sales, total orders etc. Showcasing this set of slides titled Food Service Delivery And Management Dashboard With Annual Sales Brochure PDF. The topics addressed in these templates are Food Service Delivery, Management Dashboard, Annual Sales. All the content presented in this PPT design is completely editable. Download it and make adjustments in color, background, font etc. as per your unique business setting.
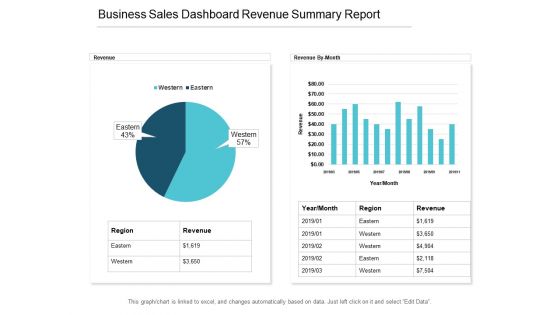
Business Sales Dashboard Revenue Summary Report Ppt PowerPoint Presentation Pictures Structure
This is a business sales dashboard revenue summary report ppt powerpoint presentation pictures structure. This is a two stage process. The stages in this process are business analytics, ba, organizations data.
Retail Shop Administration Essential Retail Store Activities Tracking Dashboard Portrait PDF
This slide provides details regarding the dashboard for tracking retail store activities in terms of sales, conversion rate, traffic, average transaction value, recommendations, etc. This Retail Shop Administration Essential Retail Store Activities Tracking Dashboard Portrait PDF from Slidegeeks makes it easy to present information on your topic with precision. It provides customization options, so you can make changes to the colors, design, graphics, or any other component to create a unique layout. It is also available for immediate download, so you can begin using it right away. Slidegeeks has done good research to ensure that you have everything you need to make your presentation stand out. Make a name out there for a brilliant performance.
Tracking Essential Retail Store Activities Dashboard Incorporation Of Experience Information PDF
This slide provides details regarding the dashboard for tracking retail store activities in terms of customer retention, rate of return, volume sales, etc. Deliver and pitch your topic in the best possible manner with this tracking essential retail store activities dashboard incorporation of experience information pdf. Use them to share invaluable insights on total volume sales, rate of return, customer retention, number of new and returning customers and impress your audience. This template can be altered and modified as per your expectations. So, grab it now.

Retail Store Data Map Dashboard Ppt PowerPoint Presentation Gallery Display PDF
This slide shows retail store data inventory dashboard. It provides information such as units sold, on hand, stock availability, top selling items, average inventory value by product category, etc. Pitch your topic with ease and precision using this Retail Store Data Map Dashboard Ppt PowerPoint Presentation Gallery Display PDF. This layout presents information on Inventory Turn, Over Ratio, Gross Margin ROI. It is also available for immediate download and adjustment. So, changes can be made in the color, design, graphics or any other component to create a unique layout.

CRM Team Dashboard Highlighting Major Web Based Platform Kpis Template PDF
This slide showcases customer relationship management CRM team dashboard indicating web portal KPIs. It provides information about cost per acquisition CPA, signups, channel, spend, etc. Pitch your topic with ease and precision using this CRM Team Dashboard Highlighting Major Web Based Platform Kpis Template PDF. This layout presents information on CRM Team Dashboard Highlighting, Web Based Platform Kpis. It is also available for immediate download and adjustment. So, changes can be made in the color, design, graphics or any other component to create a unique layout.
Essential Retail Store Activities Tracking Dashboard Customer Engagement Administration Infographics PDF
This slide provides details regarding the dashboard for tracking retail store activities in terms of sales, conversion rate, traffic, average transaction value, recommendations, etc. This modern and well-arranged Essential Retail Store Activities Tracking Dashboard Customer Engagement Administration Infographics PDF provides lots of creative possibilities. It is very simple to customize and edit with the Powerpoint Software. Just drag and drop your pictures into the shapes. All facets of this template can be edited with Powerpoint no extra software is necessary. Add your own material, put your images in the places assigned for them, adjust the colors, and then you can show your slides to the world, with an animated slide included.
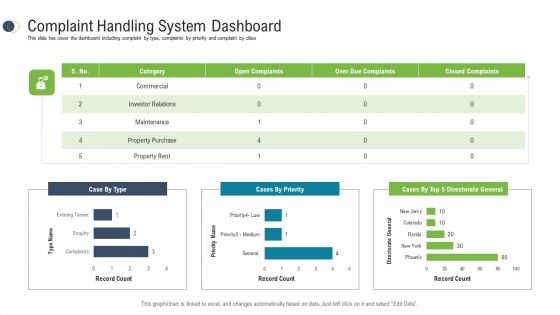
Consumer Complaint Procedure Complaint Handling System Dashboard Ppt Ideas Example File PDF
This slide has cover the dashboard including complaint by type, complaints by priority and complaint by cities. Deliver and pitch your topic in the best possible manner with this consumer complaint procedure complaint handling system dashboard ppt ideas example file pdf. Use them to share invaluable insights on commercial, investor relations, property purchase, cases by priority, property rent and impress your audience. This template can be altered and modified as per your expectations. So, grab it now.

Robotization In Issues Management Complaint Handling System Dashboard Ppt Infographics Slides PDF
This slide has cover the dashboard including complaint by type, complaints by priority and complaint by cities. Deliver and pitch your topic in the best possible manner with this robotization in issues management complaint handling system dashboard ppt infographics slides pdf. Use them to share invaluable insights on property purchase, cases by priority, category and impress your audience. This template can be altered and modified as per your expectations. So, grab it now.

Product Management Techniques Metric Dashboard To Track Product Success Ideas PDF
This slide represents dashboard for tracking product success. It covers new customer, total sessions, purchase, total inquires, total crashes etc. Deliver an awe inspiring pitch with this creative Product Management Techniques Metric Dashboard To Track Product Success Ideas PDF bundle. Topics like New Customer, Sessions, Total Signup can be discussed with this completely editable template. It is available for immediate download depending on the needs and requirements of the user.

Project Budget Management And Monitoring Dashboard Ppt Portfolio Infographic Template PDF
This slide showcases project budget management and controls dashboard. It provides information about project cost, revenue trend along with invoice status and purchase order. Showcasing this set of slides titled Project Budget Management And Monitoring Dashboard Ppt Portfolio Infographic Template PDF. The topics addressed in these templates are Project Cost Trend, Project Revenue Trend, Invoice Status. All the content presented in this PPT design is completely editable. Download it and make adjustments in color, background, font etc. as per your unique business setting.
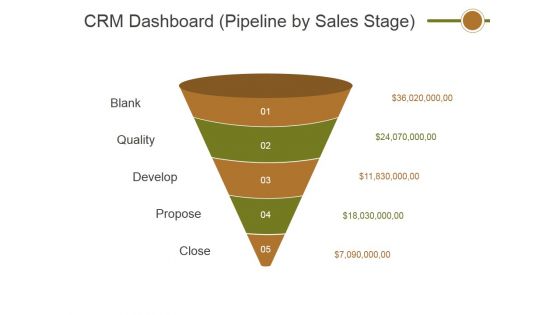
Crm Dashboard Pipeline By Sales Stage Ppt PowerPoint Presentation Outline Outfit
This is a crm dashboard pipeline by sales stage ppt powerpoint presentation outline outfit. This is a five stage process. The stages in this process are blank, quality, develop, propose, close.
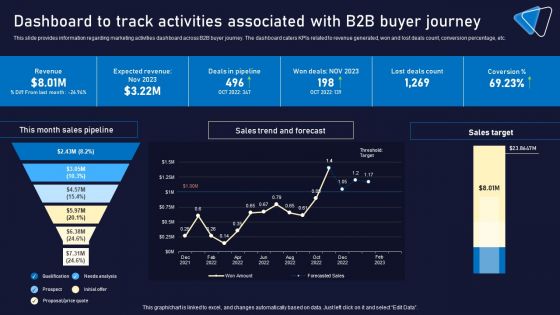
Dashboard To Track Activities Associated With B2B Buyer Journey Portrait PDF
This slide provides information regarding marketing activities dashboard across B2B buyer journey. The dashboard caters KPIs related to revenue generated, won and lost deals count, conversion percentage, etc. Make sure to capture your audiences attention in your business displays with our gratis customizable Dashboard To Track Activities Associated With B2B Buyer Journey Portrait PDF. These are great for business strategies, office conferences, capital raising or task suggestions. If you desire to acquire more customers for your tech business and ensure they stay satisfied, create your own sales presentation with these plain slides.
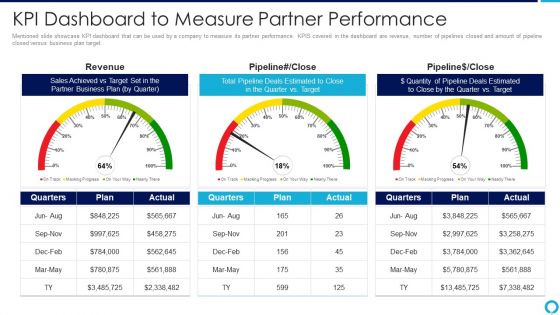
Partnership Management Strategies Kpi Dashboard To Measure Partner Performance Elements PDF
Mentioned slide showcase KPI dashboard that can be used by a company to measure its partner performance. KPIS covered in the dashboard are revenue, number of pipelines closed and amount of pipeline closed versus business plan target.Deliver an awe inspiring pitch with this creative partnership management strategies kpi dashboard to measure partner performance elements pdf bundle. Topics like sales achieved, partner business plan, total pipeline deals estimated can be discussed with this completely editable template. It is available for immediate download depending on the needs and requirements of the user.
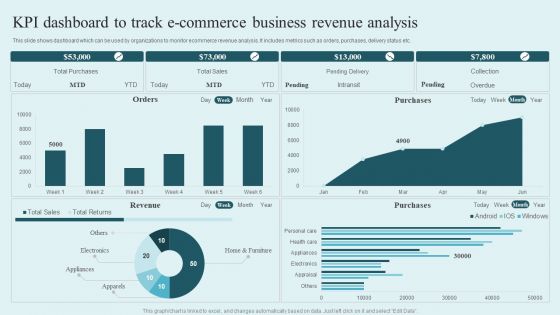
KPI Dashboard To Track E Commerce Business Revenue Analysis Rules PDF
This slide shows dashboard which can be used by organizations to monitor ecommerce revenue analysis. It includes metrics such as orders, purchases, delivery status etc. Pitch your topic with ease and precision using this KPI Dashboard To Track E Commerce Business Revenue Analysis Rules PDF. This layout presents information on Total Purchases, Total Sales, Pending Delivery, Collection. It is also available for immediate download and adjustment. So, changes can be made in the color, design, graphics or any other component to create a unique layout.
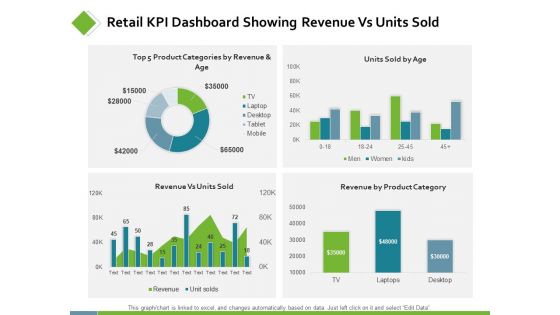
Retail KPI Dashboard Showing Revenue Vs Units Sold Ppt PowerPoint Presentation Professional Smartart
This is a retail kpi dashboard showing revenue vs units sold ppt powerpoint presentation professional smartart. This is a four stage process. The stages in this process are finance, analysis, business, investment, marketing.

Retail Kpi Dashboard Showing Revenue Vs Units Sold Ppt PowerPoint Presentation File Formats
This is a retail kpi dashboard showing revenue vs units sold ppt powerpoint presentation file formats. This is a three stage process. The stages in this process are finance, marketing, management, investment, analysis.
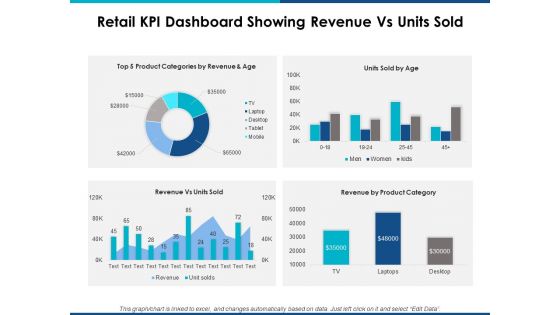
Retail Kpi Dashboard Showing Revenue Vs Units Sold Ppt Powerpoint Presentation Layouts Show
This is a retail kpi dashboard showing revenue vs units sold ppt powerpoint presentation layouts show. This is a four stage process. The stages in this process are finance, marketing, management, investment, analysis.
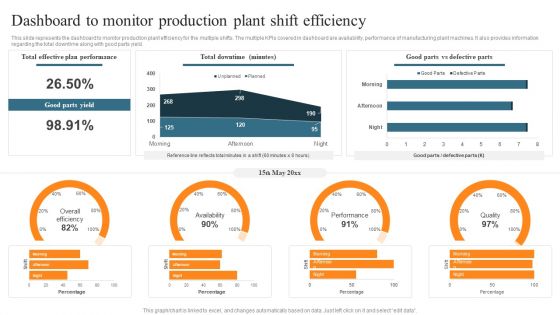
Leveraging Predictive Maintenance To Enhance Production Process Dashboard To Monitor Production Plant Shift Efficiency Structure PDF
This slide represents the dashboard to monitor production plant efficiency for the multiple shifts. The multiple KPIs covered in dashboard are availability, performance of manufacturing plant machines. It also provides information regarding the total downtime along with good parts yield. There are so many reasons you need a Leveraging Predictive Maintenance To Enhance Production Process Dashboard To Monitor Production Plant Shift Efficiency Structure PDF. The first reason is you cant spend time making everything from scratch, Thus, Slidegeeks has made presentation templates for you too. You can easily download these templates from our website easily.

B2B Sales Techniques Playbook B2B Prospects Performance Measurement Dashboard Guidelines PDF
This slide provides information regarding B2B performance tracking dashboard to measure leads, MQL, SQL, customers, revenue goals, total media spend.Deliver an awe inspiring pitch with this creative B2B Sales Techniques Playbook B2B Prospects Performance Measurement Dashboard Guidelines PDF bundle. Topics like Revenue Goal, Total Media, Spend Customers can be discussed with this completely editable template. It is available for immediate download depending on the needs and requirements of the user.

Kpi Dashboard To Monitor E Commerce Website Conversion Rate Clipart PDF
Following slide demonstrates KPI dashboard for tracking shopping website revenue with customer conversion rate to determine business growth. It includes key elements such as website revenue, new customer, repeated purchase rate, average order value, marketing channel, devices and product revenue and conversion rate. Showcasing this set of slides titled Kpi Dashboard To Monitor E Commerce Website Conversion Rate Clipart PDF. The topics addressed in these templates are Shopping Website Revenue, Conversion Rate, Website Revenue. All the content presented in this PPT design is completely editable. Download it and make adjustments in color, background, font etc. as per your unique business setting.

Deploying Corporate Aligned IT Strategy IT Performance Dashboard To Track Customer Satisfaction Clipart PDF
This slide provides information regarding the dashboard to monitor overall IT performance. The dashboard tracks occupancy rate, net promoter score, avg. first contact resolution rate, etc. Boost your pitch with our creative Deploying Corporate Aligned IT Strategy IT Performance Dashboard To Track Customer Satisfaction Clipart PDF. Deliver an awe inspiring pitch that will mesmerize everyone. Using these presentation templates you will surely catch everyones attention. You can browse the ppts collection on our website. We have researchers who are experts at creating the right content for the templates. So you do not have to invest time in any additional work. Just grab the template now and use them.
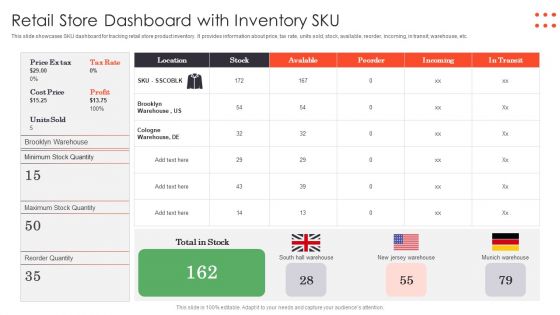
Retail Store Dashboard With Inventory SKU Ppt PowerPoint Presentation Gallery Graphics Template PDF
This slide showcases SKU dashboard for tracking retail store product inventory. It provides information about price, tax rate, units sold, stock, available, reorder, incoming, in transit, warehouse, etc. Showcasing this set of slides titled Retail Store Dashboard With Inventory SKU Ppt PowerPoint Presentation Gallery Graphics Template PDF. The topics addressed in these templates are South Hall Warehouse, New Jersey Warehouse, Munich Warehouse. All the content presented in this PPT design is completely editable. Download it and make adjustments in color, background, font etc. as per your unique business setting.
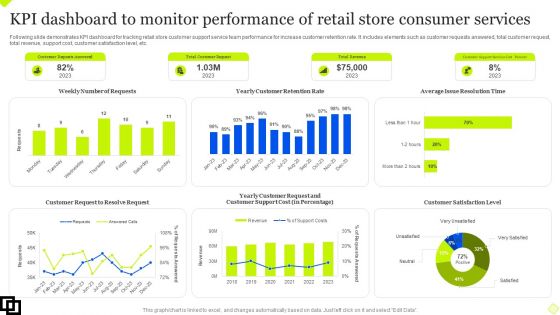
KPI Dashboard To Monitor Performance Of Retail Store Consumer Services Summary PDF
Following slide demonstrates KPI dashboard for tracking retail store customer support service team performance for increase customer retention rate. It includes elements such as customer requests answered, total customer request, total revenue, support cost, customer satisfaction level, etc. Showcasing this set of slides titled KPI Dashboard To Monitor Performance Of Retail Store Consumer Services Summary PDF. The topics addressed in these templates are Customer Request, Customer Retention Rate, Customer Satisfaction Level. All the content presented in this PPT design is completely editable. Download it and make adjustments in color, background, font etc. as per your unique business setting.

Real Time Analytics Dashboard To Measure Marketing Campaign Performance Information PDF
The purpose of this slide is to outline analytics dashboard to evaluate the success rate of marketing campaign performance. It provides information about metrics such as clicks, impressions, spend, conversions, site audit score, audience growth, etc. Pitch your topic with ease and precision using this Real Time Analytics Dashboard To Measure Marketing Campaign Performance Information PDF. This layout presents information on Real Time Analytics Dashboard To Measure Marketing Campaign Performance. It is also available for immediate download and adjustment. So, changes can be made in the color, design, graphics or any other component to create a unique layout.
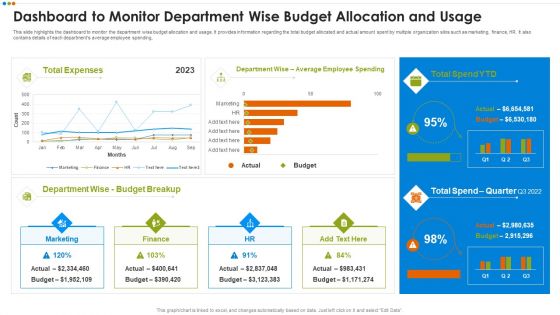
Quarterly Budget Analysis Of Business Organization Dashboard To Monitor Department Demonstration PDF
This slide highlights the dashboard to monitor the department wise budget allocation and usage. It provides information regarding the total budget allocated and actual amount spent by multiple organization silos such as marketing, finance, HR. It also contains details of each departments average employee spending,Deliver and pitch your topic in the best possible manner with this Quarterly Budget Analysis Of Business Organization Dashboard To Monitor Department Demonstration PDF Use them to share invaluable insights on Dashboard To Monitor Department Wise Budget Allocation And Usage and impress your audience. This template can be altered and modified as per your expectations. So, grab it now.

Building Market Brand Leadership Strategies Kpi Dashboard To Track Brand Performance Designs PDF
Mentioned slide showcases KPI dashboard that can be used to check the financial performance of a brand. Metrics covered in the dashboard are return on assets, working capital ratio, return on equity etc. There are so many reasons you need a Building Market Brand Leadership Strategies Kpi Dashboard To Track Brand Performance Designs PDF. The first reason is you cannot spend time making everything from scratch, Thus, Slidegeeks has made presentation templates for you too. You can easily download these templates from our website easily.
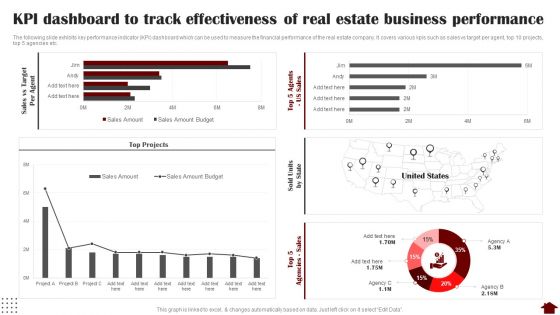
KPI Dashboard To Track Effectiveness Of Real Estate Business Performance Slides PDF
The following slide exhibits key performance indicator KPI dashboard which can be used to measure the financial performance of the real estate company. It covers various kpis such as sales vs target per agent, top 10 projects, top 5 agencies etc. Deliver an awe inspiring pitch with this creative KPI Dashboard To Track Effectiveness Of Real Estate Business Performance Slides PDF bundle. Topics like KPI Dashboard, Track Effectiveness, Real Estate Business Performance can be discussed with this completely editable template. It is available for immediate download depending on the needs and requirements of the user.
Comprehensive Promotion Guidelines To Administer Brand Overall Brand Performance Tracking Dashboard Mockup PDF
This slide provides information regarding brand performance tracking dashboard capturing KPIs such as brand metric, brand commitment, advertising metrics, and purchase metrics. Presenting this PowerPoint presentation, titled Comprehensive Promotion Guidelines To Administer Brand Overall Brand Performance Tracking Dashboard Mockup PDF, with topics curated by our researchers after extensive research. This editable presentation is available for immediate download and provides attractive features when used. Download now and captivate your audience. Presenting this Comprehensive Promotion Guidelines To Administer Brand Overall Brand Performance Tracking Dashboard Mockup PDF. Our researchers have carefully researched and created these slides with all aspects taken into consideration. This is a completely customizable Comprehensive Promotion Guidelines To Administer Brand Overall Brand Performance Tracking Dashboard Mockup PDF that is available for immediate downloading. Download now and make an impact on your audience. Highlight the attractive features available with our PPTs.
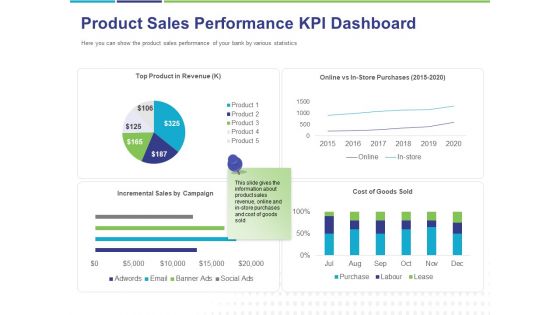
Commodity Up Selling Product Sales Performance KPI Dashboard Ppt Infographic Template Background PDF
Presenting this set of slides with name commodity up selling product sales performance kpi dashboard ppt infographic template background pdf. The topics discussed in these slides are incremental sales by campaign, cost of goods sold, top product in revenue, online vs in store purchases. This is a completely editable PowerPoint presentation and is available for immediate download. Download now and impress your audience.
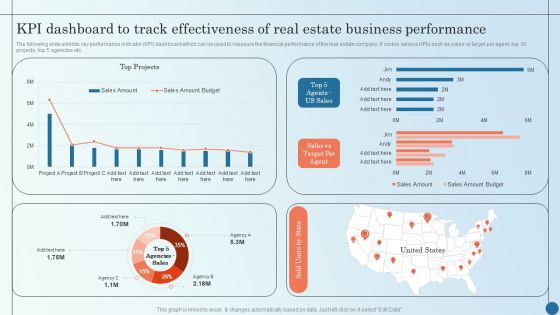
KPI Dashboard To Track Effectiveness Of Real Estate Business Managing Commercial Property Risks Demonstration PDF
The following slide exhibits key performance indicator KPI dashboard which can be used to measure the financial performance of the real estate company. It covers various KPIs such as sales vs target per agent, top 10 projects, top 5 agencies etc.Deliver an awe inspiring pitch with this creative KPI Dashboard To Track Effectiveness Of Real Estate Business Managing Commercial Property Risks Demonstration PDF bundle. Topics like Kpi Dashboard, Track Effectiveness, Estate Business can be discussed with this completely editable template. It is available for immediate download depending on the needs and requirements of the user.
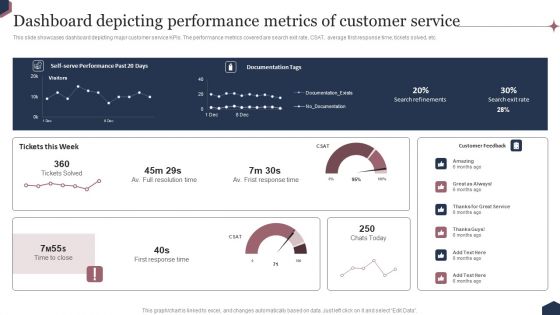
Enhance Customer Engagement Through After Sales Activities Dashboard Depicting Performance Metrics Formats PDF
This slide showcases dashboard depicting major customer service KPIs. The performance metrics covered are search exit rate, CSAT, average first response time, tickets solved, etc. There are so many reasons you need a Enhance Customer Engagement Through After Sales Activities Dashboard Depicting Performance Metrics Formats PDF. The first reason is you can not spend time making everything from scratch, Thus, Slidegeeks has made presentation templates for you too. You can easily download these templates from our website easily.
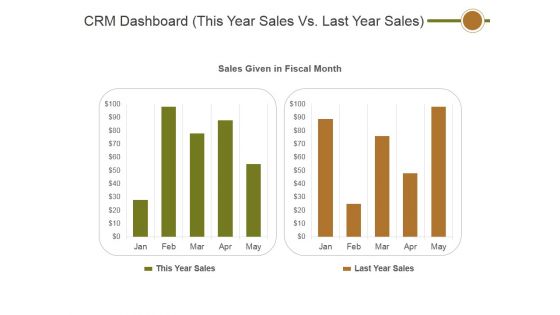
Crm Dashboard This Year Sales Vs Last Year Sales Ppt PowerPoint Presentation Layouts Outline
This is a crm dashboard this year sales vs last year sales ppt powerpoint presentation layouts outline. This is a two stage process. The stages in this process are sales given in fiscal month, this year sales, last year sales.
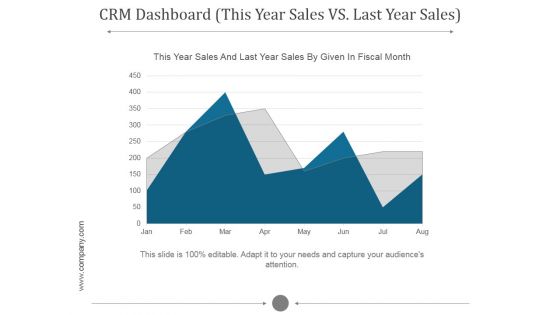
Crm Dashboard This Year Sales Vs Last Year Sales Ppt PowerPoint Presentation Information
This is a crm dashboard this year sales vs last year sales ppt powerpoint presentation information. This is a five stage process. The stages in this process are this year sales and last year sales by given in fiscal month.
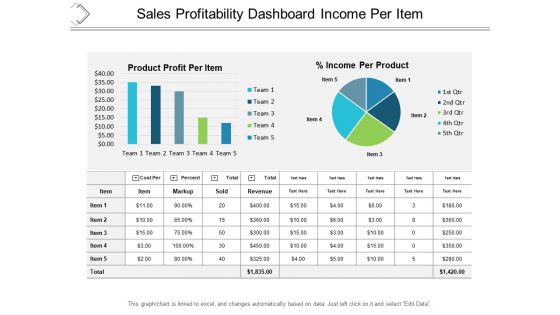
Sales Profitability Dashboard Income Per Item Ppt PowerPoint Presentation Professional Graphic Images
This is a sales profitability dashboard income per item ppt powerpoint presentation professional graphic images. This is a five stage process. The stages in this process are business analytics, ba, organizations data.

Enhancing B2B Demand Creation And Sales Growth Determine B2B Account Management Dashboard Template PDF
This slide provides information regarding B2B account management dashboard catering KPIs related to pipeline deals, landing page completion, email engagement, etc. Deliver and pitch your topic in the best possible manner with this enhancing b2b demand creation and sales growth determine b2b account management dashboard template pdf. Use them to share invaluable insights on pipeline deals, email engagement, revenue by campaign, landing page completion and impress your audience. This template can be altered and modified as per your expectations. So, grab it now.
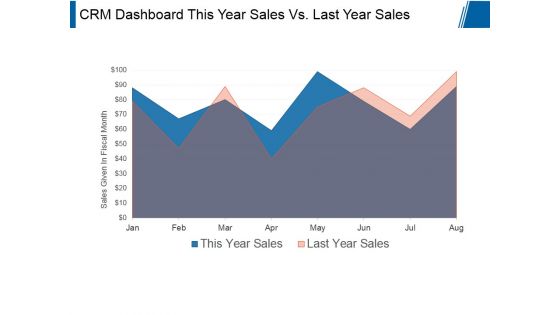
Crm Dashboard This Year Sales Vs Last Year Sales Ppt PowerPoint Presentation Styles
This is a crm dashboard this year sales vs last year sales ppt powerpoint presentation styles. This is a two stage process. The stages in this process are sales given in fiscal month, business, marketing, presentation, growth.
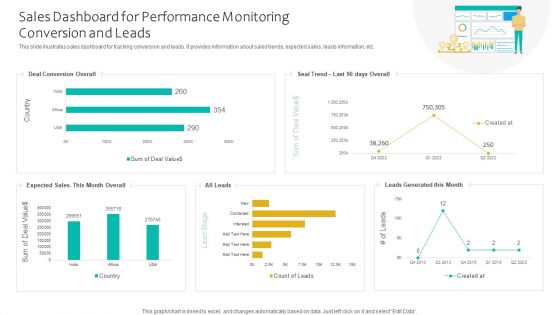
Sales Dashboard For Performance Monitoring Conversion And Leads Ppt Infographics Smartart PDF
This slide illustrates sales dashboard for tracking conversion and leads. It provides information about sales trends, expected sales, leads information, etc. Showcasing this set of slides titled Sales Dashboard For Performance Monitoring Conversion And Leads Ppt Infographics Smartart PDF. The topics addressed in these templates are Deal Conversion Overall, Expected Sales, Leads Generated. All the content presented in this PPT design is completely editable. Download it and make adjustments in color, background, font etc. as per your unique business setting.
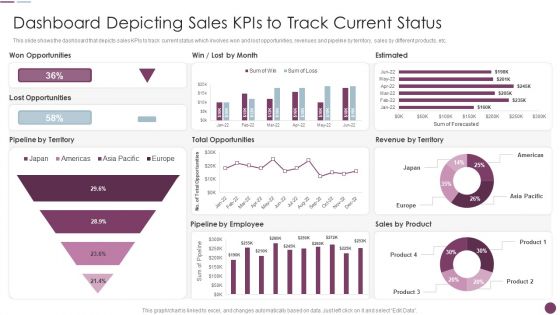
Sales Automation Procedure Dashboard Depicting Sales Kpis To Track Current Status Sample PDF
This slide shows the dashboard that depicts sales KPIs to track current status which involves won and lost opportunities, revenues and pipeline by territory, sales by different products, etc. Deliver an awe inspiring pitch with this creative Sales Automation Procedure Dashboard Depicting Sales Kpis To Track Current Status Sample PDF bundle. Topics like Estimated, Pipeline Employee, Pipeline Territory can be discussed with this completely editable template. It is available for immediate download depending on the needs and requirements of the user.
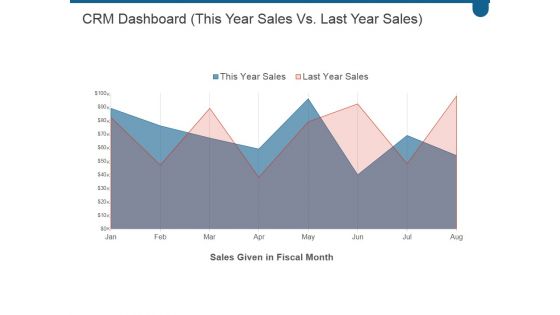
Crm Dashboard This Year Sales Vs Last Year Sales Ppt PowerPoint Presentation Deck
This is a crm dashboard this year sales vs last year sales ppt powerpoint presentation deck. This is a two stage process. The stages in this process are business, marketing, success, growth, finance.
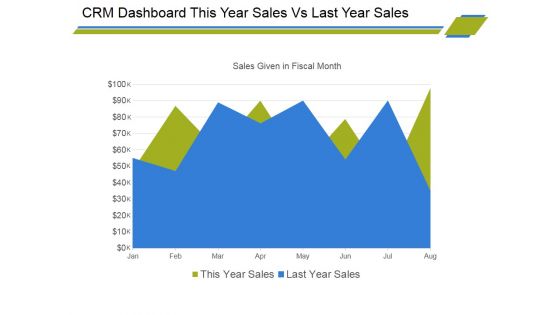
Crm Dashboard This Year Sales Vs Last Year Sales Ppt PowerPoint Presentation Professional Display
This is a crm dashboard this year sales vs last year sales ppt powerpoint presentation professional display. This is a two stage process. The stages in this process are area chart, growth, management, marketing, business, strategy.

B2B Sales Framework Playbook B2B Prospects Performance Measurement Dashboard Professional PDF
This slide provides information regarding B2B performance tracking dashboard to measure leads, MQL, SQL, customers, revenue goals, total media spend. Deliver an awe inspiring pitch with this creative B2B Sales Framework Playbook B2B Prospects Performance Measurement Dashboard Professional PDF bundle. Topics like Cost Per Lead, Customers, Revenue Goal can be discussed with this completely editable template. It is available for immediate download depending on the needs and requirements of the user.

Enhancing Stp Strategies For A Successful Market Promotion Kpi Dashboard To Monitor Diagrams PDF
Mentioned slide shows the KPI dashboard that can be used to track win and lost sales opportunities. It includes metrics namely won opportunities, lost opportunities, pipeline by territory, total opportunities. Deliver and pitch your topic in the best possible manner with this enhancing stp strategies for a successful market promotion kpi dashboard to monitor diagrams pdf. Use them to share invaluable insights on kpi dashboard to monitor sales opportunities and impress your audience. This template can be altered and modified as per your expectations. So, grab it now.
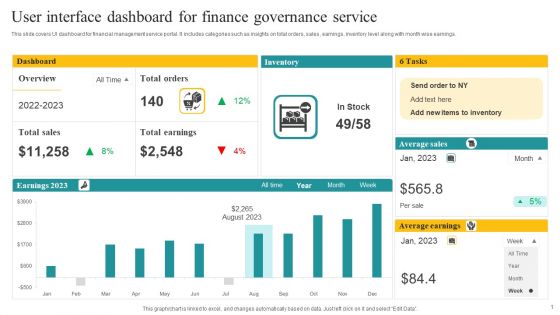
User Interface Dashboard For Finance Governance Service Ppt Outline Graphics Tutorials PDF
This slide covers UI dashboard for financial management service portal. It includes categories such as insights on total orders, sales , earnings, inventory level along with month wise earnings. Showcasing this set of slides titled User Interface Dashboard For Finance Governance Service Ppt Outline Graphics Tutorials PDF. The topics addressed in these templates are Dashboard, Inventory, Average Sales. All the content presented in this PPT design is completely editable. Download it and make adjustments in color, background, font etc. as per your unique business setting.
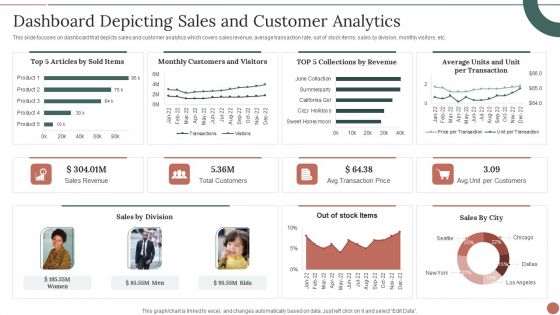
Retail Business Product Planning Procedure Dashboard Depicting Sales And Customer Analytics Themes PDF
This slide focuses on dashboard that depicts sales and customer analytics which covers sales revenue, average transaction rate, out of stock items, sales by division, monthly visitors, etc. Deliver and pitch your topic in the best possible manner with this Retail Business Product Planning Procedure Dashboard Depicting Sales And Customer Analytics Themes PDF. Use them to share invaluable insights on Sales Revenue, Total Customers, Sales By Division and impress your audience. This template can be altered and modified as per your expectations. So, grab it now.
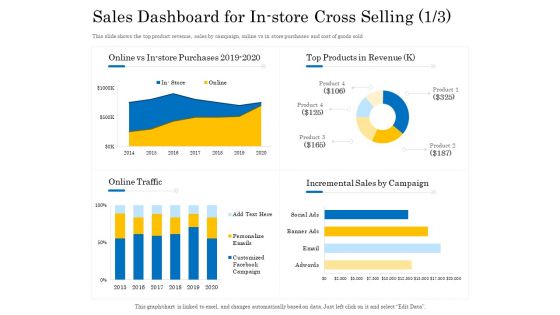
Retail Cross Selling Techniques Sales Dashboard For In Store Cross Selling Cost Rules PDF
Deliver and pitch your topic in the best possible manner with this retail cross selling techniques sales dashboard for in store cross selling cost rules pdf. Use them to share invaluable insights on traffic, revenue, incremental, sales, campaign and impress your audience. This template can be altered and modified as per your expectations. So, grab it now.
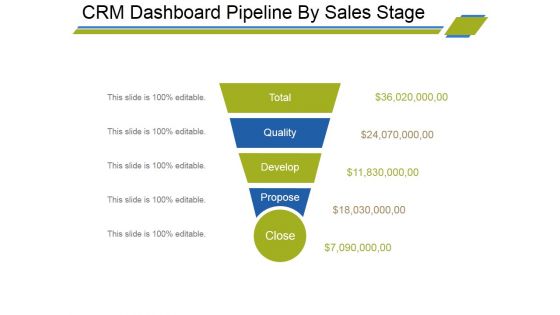
Crm Dashboard Pipeline By Sales Stage Ppt PowerPoint Presentation Infographic Template Slides
This is a crm dashboard pipeline by sales stage ppt powerpoint presentation infographic template slides. This is a five stage process. The stages in this process are total, quality, develop, propose, close.

Retail Cross Selling Techniques Sales Dashboard For In Store Cross Selling Trend Inspiration PDF
Deliver and pitch your topic in the best possible manner with this retail cross selling techniques sales dashboard for in store cross selling trend inspiration pdf. Use them to share invaluable insights on revenue, gross profit, customer satisfaction, new customer and impress your audience. This template can be altered and modified as per your expectations. So, grab it now.

Post Merger Information Technology Service Delivery Amalgamation KPI Dashboard To Measure Business Template PDF
Mentioned slide portrays a dashboard for measuring business performance. Performance metrics covered in the slide are average weekly sales revenue, average revenue per unit, customer lifetime value and customer acquisition cost. Deliver an awe inspiring pitch with this creative post merger information technology service delivery amalgamation kpi dashboard to measure business template pdf bundle. Topics like kpi dashboard to measure business performance can be discussed with this completely editable template. It is available for immediate download depending on the needs and requirements of the user.
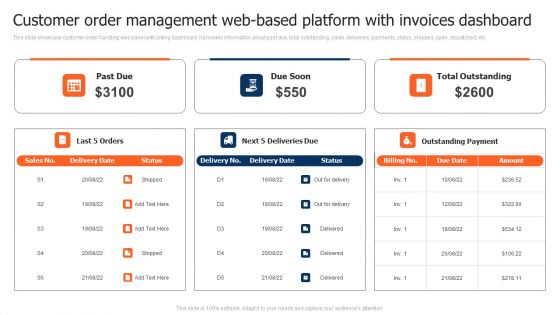
Customer Order Management Web Based Platform With Invoices Dashboard Clipart PDF
This slide showcase customer order handling web panel with billing dashboard. It provides information about past due, total outstanding, sales, deliveries, payments, status, shipped, open, dispatched, etc. Showcasing this set of slides titled Customer Order Management Web Based Platform With Invoices Dashboard Clipart PDF. The topics addressed in these templates are Customer Order Management, Web Based Platform, Invoices Dashboard. All the content presented in this PPT design is completely editable. Download it and make adjustments in color, background, font etc. as per your unique business setting.
Non Fungible Token Methodology IT NFT Transaction Analysis And Tracking Dashboard Brochure PDF
This slide demonstrates the dashboard for tracking NFT transactions and analysis based on daily sales, ETH volume collections, and so on. Create an editable Non Fungible Token Methodology IT NFT Transaction Analysis And Tracking Dashboard Brochure PDF that communicates your idea and engages your audience. Whether youre presenting a business or an educational presentation, pre-designed presentation templates help save time. Non Fungible Token Methodology IT NFT Transaction Analysis And Tracking Dashboard Brochure PDF is highly customizable and very easy to edit, covering many different styles from creative to business presentations. Slidegeeks has creative team members who have crafted amazing templates. So, go and get them without any delay.
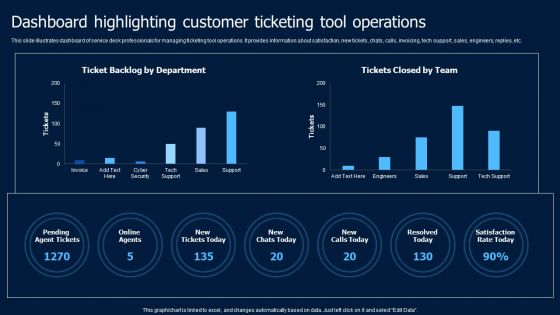
Help Desk Ticketing Dashboard Highlighting Customer Ticketing Tool Operations Introduction PDF
This slide illustrates dashboard of service desk professionals for managing ticketing tool operations. It provides information about satisfaction, new tickets, chats, calls, invoicing, tech support, sales, engineers, replies, etc. Crafting an eye-catching presentation has never been more straightforward. Let your presentation shine with this tasteful yet straightforward Help Desk Ticketing Dashboard Highlighting Customer Ticketing Tool Operations Introduction PDF maining professional. Construct the ideal Help Desk Ticketing Dashboard Highlighting Customer Ticketing Tool Operations Introduction PDF that effortlessly grabs the attention of your audience Begin now and be certain to wow your customers.

 Home
Home