Problem Solving Techniques

Root Cause Analysis Template 1 Ppt PowerPoint Presentation File Gallery
This is a root cause analysis template 1 ppt powerpoint presentation file gallery. This is a three stage process. The stages in this process are management, measurement, machine, man, method.
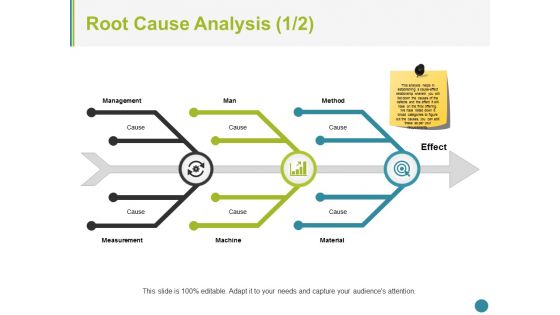
Root Cause Analysis Template 1 Ppt PowerPoint Presentation Slides Brochure
This is a root cause analysis template 1 ppt powerpoint presentation slides brochure. This is a three stage process. The stages in this process are management, man, method, measurement, machine, material.

Cause And Effect Analysis Fishbone Diagram Ppt PowerPoint Presentation Gallery Designs PDF
Presenting this set of slides with name cause and effect analysis fishbone diagram ppt powerpoint presentation gallery designs pdf. This is a five stage process. The stages in this process are communication, training, fixtures. This is a completely editable PowerPoint presentation and is available for immediate download. Download now and impress your audience.
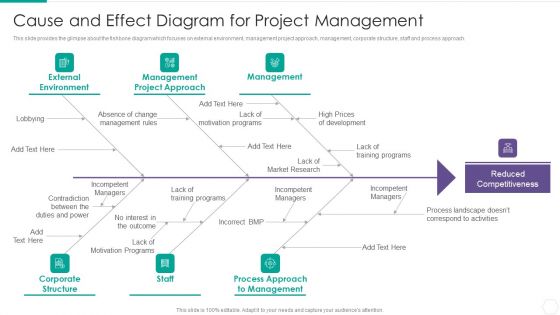
Quantitative Risk Assessment Cause And Effect Diagram For Project Management Rules PDF
This slide provides the glimpse about the fishbone diagram which focuses on external environment, management project approach, management, corporate structure, staff and process approach. This is a Quantitative Risk Assessment Cause And Effect Diagram For Project Management Rules PDF template with various stages. Focus and dispense information on six stages using this creative set, that comes with editable features. It contains large content boxes to add your information on topics like Management, External Environment, Corporate Structure, Market. You can also showcase facts, figures, and other relevant content using this PPT layout. Grab it now.
Fish Bone Cause And Effect Layout Ppt PowerPoint Presentation Icon Graphics Template PDF
Pitch your topic with ease and precision using this fish bone cause and effect layout ppt powerpoint presentation icon graphics template pdf. This layout presents information on fish bone cause, effect layout. It is also available for immediate download and adjustment. So, changes can be made in the color, design, graphics or any other component to create a unique layout.

Marketing Playbook To Maximize ROI Gap Selling Sales Methodology For Deal Closure Ideas PDF
Sales methodology caters guidelines that assist sales representatives in closing deal with clients. GAP selling sales methodology focus on highlighting gap among prospects business at present and desired level. It cater best way to position firms offerings most effective in filling existing gaps. This is a marketing playbook to maximize roi gap selling sales methodology for deal closure ideas pdf template with various stages. Focus and dispense information on seven stages using this creative set, that comes with editable features. It contains large content boxes to add your information on topics like facts, problems, impact, root causes, emotion. You can also showcase facts, figures, and other relevant content using this PPT layout. Grab it now.

root cause analysis ppt powerpoint presentation styles introduction
This is a root cause analysis ppt powerpoint presentation styles introduction. This is a one stage process. The stages in this process are business, management, analysis, success.
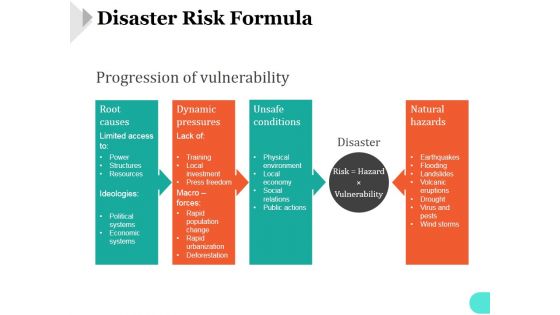
Disaster Risk Formula Template 1 Ppt PowerPoint Presentation Example 2015
This is a disaster risk formula template 1 ppt powerpoint presentation example 2015. This is a four stage process. The stages in this process are root causes, dynamic pressures, unsafe conditions, natural hazards.

Disaster Risk Formula Template 2 Ppt PowerPoint Presentation Themes
This is a disaster risk formula template 2 ppt powerpoint presentation themes. This is a four stage process. The stages in this process are root causes, dynamic pressures, unsafe conditions, natural hazards.
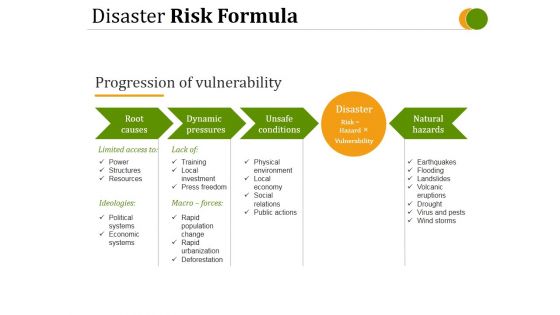
Disaster Risk Formula Ppt PowerPoint Presentation Outline Graphics Tutorials
This is a disaster risk formula ppt powerpoint presentation outline graphics tutorials. This is a four stage process. The stages in this process are progression of vulnerability, root causes, dynamic pressures, unsafe conditions, natural hazards.

Ppt Components Of Circular Process Cause And Effect Diagram PowerPoint Template Templates
PPT components of circular process cause and effect diagram powerpoint template Templates-This circular flow diagram illustrates the economic exchange that takes place in the building of wealth. Adjust the above image in your PPT presentations to visually support your content in your Business PPT slideshows-PPT components of circular process cause and effect diagram powerpoint template Templates-Arrow, Chart, Circular, Color, Colorful, Connect, Connection, Design, Diagram, Finance, Graphic, Group, Growth, Icon, Illustration, Marketing, Pieces, Process, Recycle, Recycling, Round, Set, Strategy, Symbol, Wheel
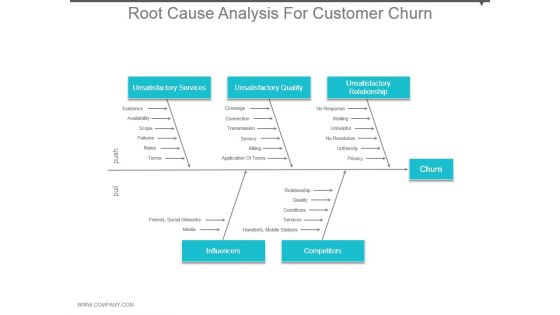
Root Cause Analysis For Customer Churn Ppt Examples Slides
This is a root cause analysis for customer churn ppt examples slides. This is a five stage process. The stages in this process are unsatisfactory services, unsatisfactory quality, unsatisfactory relationship, churn, influencers, competitors.

Comparative Assessment Of Lean Six Sigma In Manufacturing Ppt Slide
This slide shows comparative evaluation of tools used for identifying potential solutions for root cause problem. It include tools such as brainstorming, benchmarking and pilot studies, etc. Slidegeeks is here to make your presentations a breeze with Comparative Assessment Of Lean Six Sigma In Manufacturing Ppt Slide With our easy-to-use and customizable templates, you can focus on delivering your ideas rather than worrying about formatting. With a variety of designs to choose from, you are sure to find one that suits your needs. And with animations and unique photos, illustrations, and fonts, you can make your presentation pop. So whether you are giving a sales pitch or presenting to the board, make sure to check out Slidegeeks first
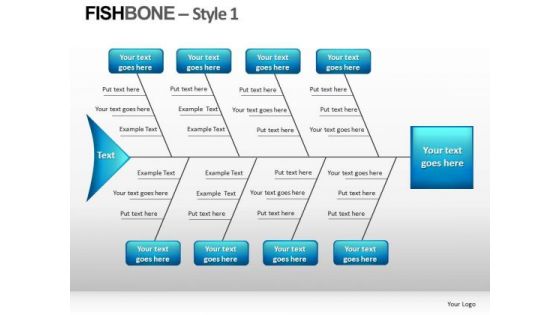
Fishbone Analysis PowerPoint Templates
FishBone Analysis PowerPoint templates-These high quality powerpoint pre-designed slides and powerpoint templates have been carefully created by our professional team to help you impress your audience. All slides have been created and are 100% editable in powerpoint. Each and every property of any graphic - color, size, orientation, shading, outline etc. can be modified to help you build an effective powerpoint presentation. Any text can be entered at any point in the powerpoint template or slide. Simply DOWNLOAD, TYPE and PRESENT!
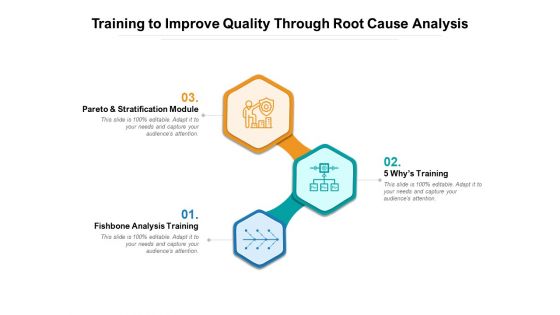
Training To Improve Quality Through Root Cause Analysis Ppt PowerPoint Presentation Outline Topics PDF
Presenting this set of slides with name training to improve quality through root cause analysis ppt powerpoint presentation outline topics pdf. This is a three stage process. The stages in this process are pareto And stratification module, fishbone analysis training, 5 whys training. This is a completely editable PowerPoint presentation and is available for immediate download. Download now and impress your audience.
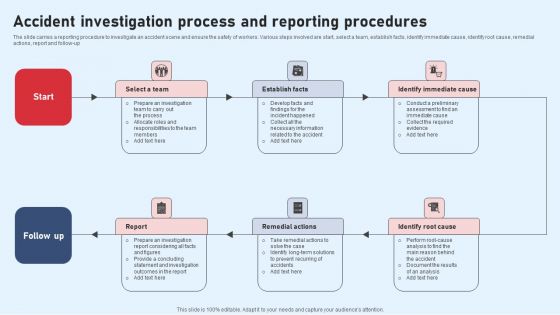
Accident Investigation Process And Reporting Procedures Elements PDF
The slide carries a reporting procedure to investigate an accident scene and ensure the safety of workers. Various steps involved are start, select a team, establish facts, identify immediate cause, identify root cause, remedial actions, report and follow-up Persuade your audience using this Accident Investigation Process And Reporting Procedures Elements PDF. This PPT design covers six stages, thus making it a great tool to use. It also caters to a variety of topics including Establish Facts, Remedial Actions, Report . Download this PPT design now to present a convincing pitch that not only emphasizes the topic but also showcases your presentation skills.

Root Cause Analysis Ppt PowerPoint Presentation Layouts Shapes
This is a root cause analysis ppt powerpoint presentation layouts shapes. This is a three stage process. The stages in this process are linear, business, marketing, management.

Ppt Cycle Process Cause And Effect Diagram PowerPoint Template 4 Stages Templates
PPT cycle process cause and effect diagram powerpoint template 4 stages Templates-Visually support your Microsoft office PPT Presentation with our above template. This diagram shows the flow of control between activities. You can model the sequential steps in a process with this diagram-PPT cycle process cause and effect diagram powerpoint template 4 stages Templates-Arrow, Chart, Circular Procedure, Color, Colorful, Connect, Connection, Design, Diagram, Finance, Graphic, Group, Growth, Icon, Illustration, Marketing, Pieces, Process, Recycle, Recycling, Round, Set, Strategy, Symbol, Wheel
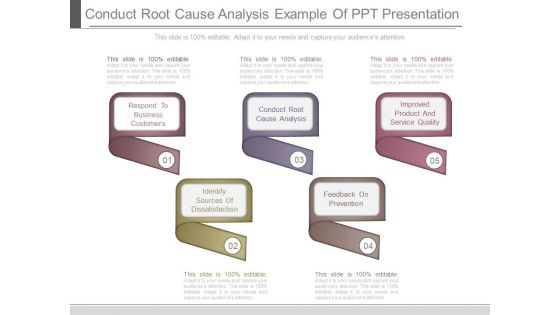
Conduct Root Cause Analysis Example Of Ppt Presentation
This is a conduct root cause analysis example of ppt presentation. This is a five stage process. The stages in this process are respond to business customers, conduct root cause analysis, improved product and service quality, identify sources of dissatisfaction, feedback on prevention.
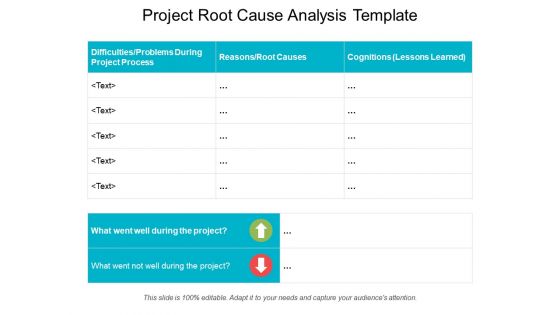
Project Root Cause Analysis Template Ppt PowerPoint Presentation Professional Show
This is a project root cause analysis template ppt powerpoint presentation professional show. This is a three stage process. The stages in this process are project analysis, project review, project performance management.
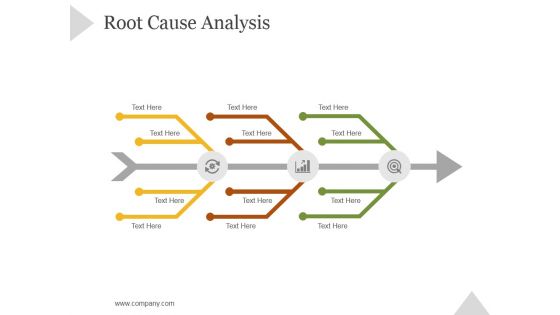
Root Cause Analysis Ppt PowerPoint Presentation Example 2015
This is a root cause analysis ppt powerpoint presentation example 2015. This is a three stage process. The stages in this process are business, strategy, marketing, success, growth strategy, arrow.
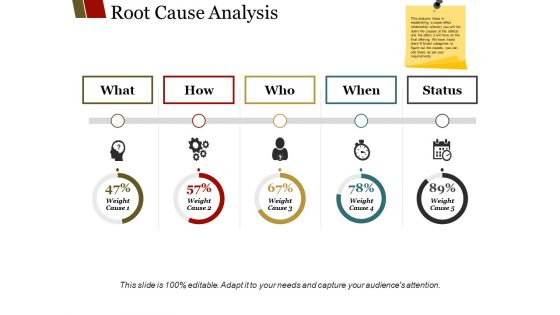
Root Cause Analysis Template 2 Ppt PowerPoint Presentation Outline Pictures
This is a root cause analysis template 2 ppt powerpoint presentation outline pictures. This is a five stage process. The stages in this process are what, how, who, when, status.
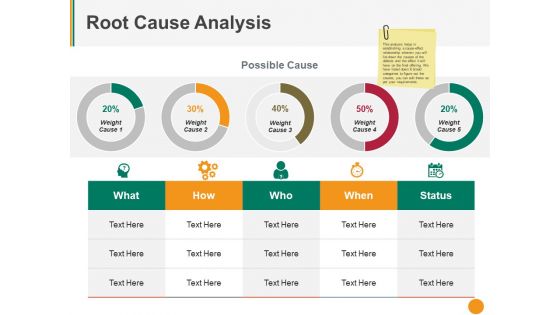
Root Cause Analysis Template 2 Ppt PowerPoint Presentation Outline Slides
This is a root cause analysis template 2 ppt powerpoint presentation outline slides. This is a five stage process. The stages in this process are what, how, who, when, status.
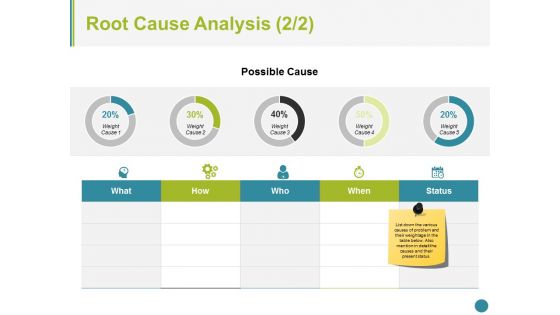
Root Cause Analysis Template 2 Ppt PowerPoint Presentation Styles Graphics
This is a root cause analysis template 2 ppt powerpoint presentation styles graphics. This is a five stage process. The stages in this process are business, icons, marketing, strategy, process.

Quality And Patient Safety Enhancement Strategy For Healthcare Company Portrait PDF
This slide explains about the plan that the healthcare department is going to improve for the betterment of patients and for improving the quality of the work. This can be done through various steps such as defining a problem, data collection and analysis of root cause by doing some test for getting best solutions to implement them for further process and at the end shares the result.Presenting Quality And Patient Safety Enhancement Strategy For Healthcare Company Portrait PDF to dispense important information. This template comprises six stages. It also presents valuable insights into the topics including Evaluate Result, Solution Implementation, Cause Analysis. This is a completely customizable PowerPoint theme that can be put to use immediately. So, download it and address the topic impactfully.

Ppt Pink Animated Text Cycle Cause And Effect Diagram PowerPoint Template Templates
PPT pink animated text cycle cause and effect diagram powerpoint template Templates-This Eight Way Round chart Diagram is an effective way of displaying Interconnected information. You can edit text, color, shade and style as per you need.-PPT pink animated text cycle cause and effect diagram powerpoint template Templates-Abstract, Blank, Business, Chart, Circular, Circulation, Cycle, Design, Diagram, Empty, Executive, Icon, Illustration, Management, Model, Numbers, Organization, Procedure, Process
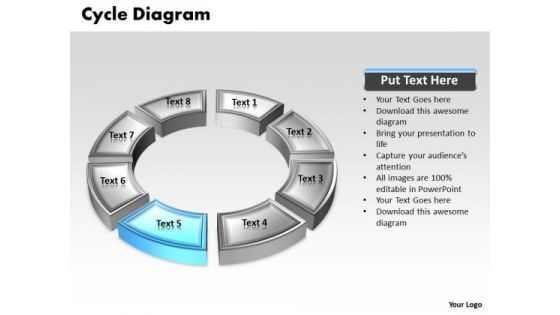
Ppt Blue Animated Multicolor Cycle Cause And Effect Diagram PowerPoint Template Templates
PPT blue animated multicolor cycle cause and effect diagram powerpoint template Templates-This PowerPoint Diagram shows the blue piece out of all connected pieces to describe the part of the process in Linear Flow. It signifies Round, circular, beeline, continuous, even, horizontal, linear, nonstop, right, shortest, though, true, unbroken etc.-PPT blue animated multicolor cycle cause and effect diagram powerpoint template Templates-Abstract, Blank, Business, Chart, Circular, Circulation, Cycle, Design, Diagram, Empty, Executive, Icon, Illustration, Management, Model, Numbers, Organization, Procedure, Process

Company Vulnerability Administration Analyze Root Causes Sample Professional PDF
Presenting company vulnerability administration analyze root causes sample pdf professional pdf to provide visual cues and insights. Share and navigate important information on four stages that need your due attention. This template can be used to pitch topics like perform root cause analysis, develop corrective actions to address root cause, update the vulnerability repository, monitor effect of corrective actions. In addtion, this PPT design contains high resolution images, graphics, etc, that are easily editable and available for immediate download.
Four Steps To Meet Target Relative Cycle Arrow Process PowerPoint Slides
We present our four steps to meet target Relative Cycle Arrow Process PowerPoint Slides.Download and present our Business PowerPoint Templates because Building castles in the sand is a danger and you are aware of. You have taken the precaution of building strong fundamentals. Download our Marketing PowerPoint Templates because The marketplace is the merger of your dreams and your ability. Download our Finance PowerPoint Templates because as a result we often end up with errors. Present our Shapes PowerPoint Templates because our template will illustrate what you want to say. Present our Process and flows PowerPoint Templates because retrace your steps with your team and have a relook at the basic aspects of your work.Use these PowerPoint slides for presentations relating to Business, chart, circle, circular, steps, process, flow, concept, conference, curving, cycle, design, diagram, direction, element, financial, flow, flowchart, formula, future, goal, graphic, idea, management, market, marketing, mind, mind map, motion, movement, organization, organize, plan, presentation, process, product, questions, render, solutions, solve, strategy, success, symbol. The prominent colors used in the PowerPoint template are Green lime, Gray, White. The feedback we get is that our four steps to meet target Relative Cycle Arrow Process PowerPoint Slides are Precious. Customers tell us our flow PowerPoint templates and PPT Slides are Cheerful. Professionals tell us our four steps to meet target Relative Cycle Arrow Process PowerPoint Slides are Striking. Customers tell us our steps PowerPoint templates and PPT Slides are Endearing. Use our four steps to meet target Relative Cycle Arrow Process PowerPoint Slides will help them to explain complicated concepts. Professionals tell us our flow PowerPoint templates and PPT Slides are Pretty.

Fishbone Ishikawa Cause And Effect Analysis How Do I Do It Contd Communication Ppt PowerPoint Presentation Show Layout PDF
Presenting this set of slides with name fishbone ishikawa cause and effect analysis how do i do it contd communication ppt powerpoint presentation show layout pdf. This is a one stage process. The stages in this process are align output cause categories, brainstorming, business situation. This is a completely editable PowerPoint presentation and is available for immediate download. Download now and impress your audience.
Fishbone Ishikawa Cause And Effect Analysis How Do I Do It Contd Ppt PowerPoint Presentation Styles Template PDF
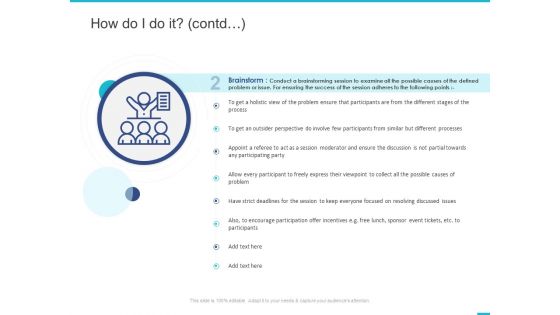
Presenting this set of slides with name fishbone ishikawa cause and effect analysis how do i do it contd ppt powerpoint presentation styles template pdf. This is a one stage process. The stages in this process are brainstorm, brainstorming session, involve, encourage participation. This is a completely editable PowerPoint presentation and is available for immediate download. Download now and impress your audience.
Fishbone Ishikawa Cause And Effect Analysis Sources Of Variation People Ppt PowerPoint Presentation Infographics Designs Download PDF
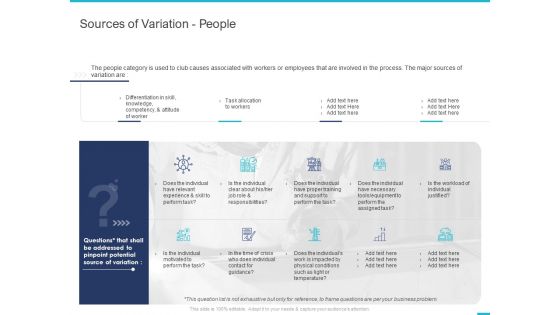
Presenting this set of slides with name fishbone ishikawa cause and effect analysis sources of variation people ppt powerpoint presentation infographics designs download pdf. The topics discussed in these slides are skill, knowledge, attitude worker, individual justified, equipment. This is a completely editable PowerPoint presentation and is available for immediate download. Download now and impress your audience.

Fishbone Ishikawa Cause And Effect Analysis Sources Of Variation Measurement System Ppt PowerPoint Presentation Layouts Graphic Tips PDF
Presenting this set of slides with name fishbone ishikawa cause and effect analysis sources of variation measurement system ppt powerpoint presentation layouts graphic tips pdf. The topics discussed in these slides are multiple measuring, variations due difference, measuring instruments, equipment, knowledge and experience. This is a completely editable PowerPoint presentation and is available for immediate download. Download now and impress your audience.
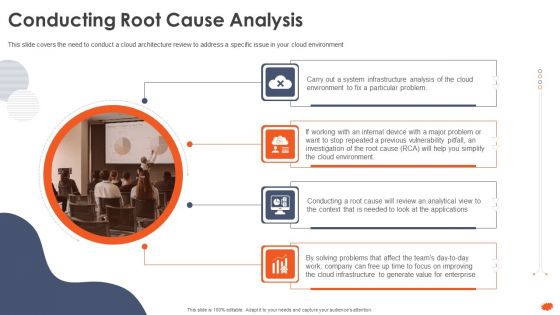
Cloud Architecture At Scale How To Execute A Cloud Infrastructure Evaluation Conducting Root Cause Analysis Mockup PDF
This slide covers the need to conduct a cloud architecture review to address a specific issue in your cloud environment . Presenting cloud architecture at scale how to execute a cloud infrastructure evaluation conducting root cause analysis mockup pdf to provide visual cues and insights. Share and navigate important information on four stages that need your due attention. This template can be used to pitch topics like infrastructure analysis, cloud environment. In addtion, this PPT design contains high resolution images, graphics, etc, that are easily editable and available for immediate download.
Ppt Pink Factor Hexagon Cause And Effect Diagram PowerPoint Template Editable Templates
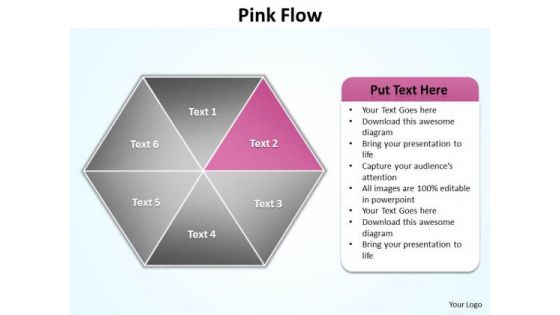
PPT pink factor hexagon cause and effect diagram PowerPoint template editable Templates-The Diagram offers an excellent background to build up the various stages of your business process. This PowerPoint Process Chart shows the seven Different Layers which are to be followed in any business. This Business Diagram can be used in Marketing, Banking, and Management etc. -PPT pink factor hexagon cause and effect diagram PowerPoint template editable Templates-attached, backgrounds, blue, cell, color, component, connect, connection, diagram, elements, geometric, graphic, group, hexagon, honeycomb, icon, illustration, intricacy, lines, link, map, mesh, model, network, science, shape, shiny, strategy, structure, symbol, teamwork, technology
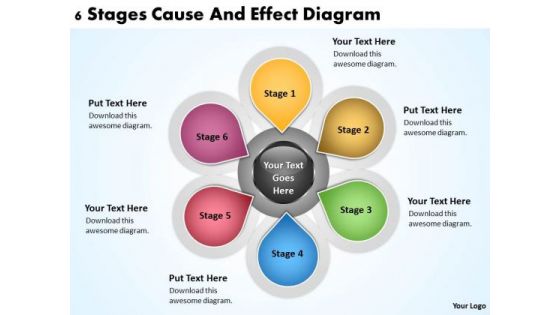
Examples Of Business Processes 6 Stages Cause And Effect Diagram PowerPoint Templates
We present our examples of business processes 6 stages cause and effect diagram PowerPoint templates.Use our Circle Charts PowerPoint Templates because you can Set pulses racing with our PowerPoint Templates and Slides. They will raise the expectations of your team. Use our Ring Charts PowerPoint Templates because Our PowerPoint Templates and Slides have the Brilliant backdrops. Guaranteed to illuminate the minds of your audience. Download our Business PowerPoint Templates because Our PowerPoint Templates and Slides are the chords of your song. String them along and provide the lilt to your views. Present our Process and Flows PowerPoint Templates because You can Bask in the warmth of our PowerPoint Templates and Slides. Enjoy the heartfelt glowing response of your listeners. Use our Flow Charts PowerPoint Templates because Watching this your Audience will Grab their eyeballs, they wont even blink.Use these PowerPoint slides for presentations relating to Abstract, arrows, blank, business, central, centralized, chart, circle, circular, circulation, concept, conceptual, converging, design, diagram, empty, executive, five, icon, idea, illustration, management, map, mapping, model, numbers, organization, outwards, pointing, procedure, process, radial, radiating, relationship, resource, sequence, strategy, template. The prominent colors used in the PowerPoint template are Purple, Gray, Black.

Business Ppt Vertical Stages Illustrated Through Arrow Plan PowerPoint 7 Graphic
We present our Business PPT vertical stages illustrated through arrow plan PowerPoint 7 graphic. Use our Arrows PowerPoint Templates because, it is in your DNA to analyses possible causes to the minutest detail. Use our Business PowerPoint Templates because; Highlight any anticipated problems, shortfalls or weak areas. Use our Metaphor PowerPoint Templates because; emphasize the process of your business/corporate growth. Use our Symbol PowerPoint Templates because, Expound on how you plan to gain their confidence and assure them of continued and consistent excellence in quality of service. Use our Process and Flows PowerPoint Templates because, to your team you always raise a toast. Use these PowerPoint slides for presentations relating to Arrow, Background, Business, Chart, Diagram, Financial, Flow, Graphic, Gray, Icon, Illustration, Linear, Management, Orange, Perspective, Process, Reflection, Spheres, Stage, Text. The prominent colors used in the PowerPoint template are Purple, Gray, and White
Ppt Sphere Cause And Effect Diagram PowerPoint Template 2 State Templates
PPT sphere cause and effect diagram powerpoint template 2 state Templates-This PPT slide can be used to compare two approaches and evaluate the effectiveness. You can easily insert text to this slide as per your requirement.-PPT sphere cause and effect diagram powerpoint template 2 state Templates-Around, Background, Ball, Big, Blue, Business, Circle, Competition, Competitive, Concept, Contrast, Design, Development, Diagram, Group, Icon, Illustration, Individual, Individuality, Isolated, Leadership, Partnership, Ring, Shapes, Sign, Sphere, Success, Symbol, Team, Teamwork, Wheel

Root Cause Assessment Ppt PowerPoint Presentation Complete Deck With Slides
Improve your presentation delivery using this Root Cause Assessment Ppt PowerPoint Presentation Complete Deck With Slides. Support your business vision and objectives using this well-structured PPT deck. This template offers a great starting point for delivering beautifully designed presentations on the topic of your choice. Comprising ninteen this professionally designed template is all you need to host discussion and meetings with collaborators. Each slide is self-explanatory and equipped with high-quality graphics that can be adjusted to your needs. Therefore, you will face no difficulty in portraying your desired content using this PPT slideshow. This PowerPoint slideshow contains every important element that you need for a great pitch. It is not only editable but also available for immediate download and utilization. The color, font size, background, shapes everything can be modified to create your unique presentation layout. Therefore, download it now.
Ppt Linear Abstraction Arrow Cause And Effect Diagram PowerPoint Template Templates
PPT linear abstraction arrow cause and effect diagram powerpoint template Templates-Use this linear diagram to emphasize the process of your business and corporate growth. Highlight your ideas broad based on strong fundamentals and illustrate how they step by step achieve the set growth factor.-PPT linear abstraction arrow cause and effect diagram powerpoint template Templates-analysis, arrow, background, business, chart, communication, concept, construction, delivery, design, development, engineering, fabrication, feasibiliti, generated, growth, idea, industry, making, production, products, science, sequence, shape
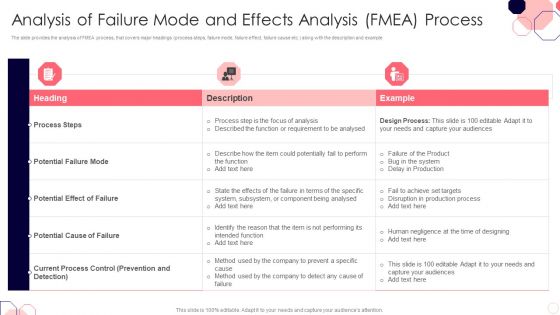
Issues And Impact Of Failure Mode And Effects Of Failure Mode And Effects Analysis FMEA Process Diagrams PDF
The slide provides the analysis of FMEA process, that covers major headings process steps, failure mode, failure effect, failure cause etc.along with the description and example.Deliver and pitch your topic in the best possible manner with this Issues And Impact Of Failure Mode And Effects Of Failure Mode And Effects Analysis FMEA Process Diagrams PDF. Use them to share invaluable insights on Potential Failure, Potential Cause, Current Process and impress your audience. This template can be altered and modified as per your expectations. So, grab it now.
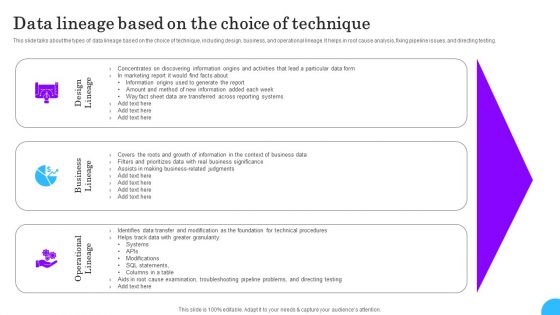
Comprehensive Analysis Of Different Data Lineage Classification Data Lineage Based On The Choice Summary PDF
This slide talks about the types of data lineage based on the choice of technique, including design, business, and operational lineage. It helps in root cause analysis, fixing pipeline issues, and directing testing. Find highly impressive Comprehensive Analysis Of Different Data Lineage Classification Data Lineage Based On The Choice Summary PDF on Slidegeeks to deliver a meaningful presentation. You can save an ample amount of time using these presentation templates. No need to worry to prepare everything from scratch because Slidegeeks experts have already done a huge research and work for you. You need to download Comprehensive Analysis Of Different Data Lineage Classification Data Lineage Based On The Choice Summary PDF for your upcoming presentation. All the presentation templates are 100 percent editable and you can change the color and personalize the content accordingly. Download now
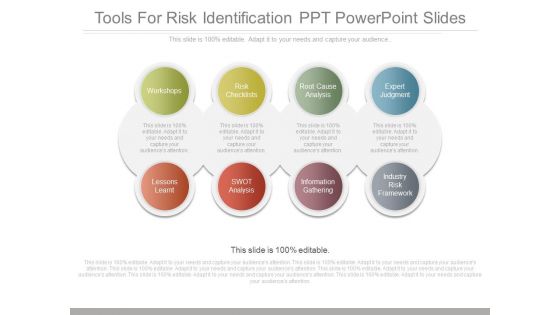
Tools For Risk Identification Ppt Powerpoint Slides
This is a tools for risk identification ppt powerpoint slides. This is a eight stage process. The stages in this process are workshops, risk checklists, root cause analysis, expert judgment, lessons learnt, swot analysis, information gathering, industry risk framework.

Ppt Moving Down Process 7 Steps Ishikawa Diagram PowerPoint Template Templates
PPT moving down process 7 steps ishikawa diagram powerpoint template Templates-Often you have to represent an organization using a simple organizational hierarchy, but by using this PowerPoint Diagram you will give your Presentation a new look and will make it more interesting to watch. It is a useful captivating tool enables you to define your message in your Marketing PPT presentations. You can edit text, color, shade and style as per you need.-PPT moving down process 7 steps ishikawa diagram powerpoint template Templates-Add, Aqua, Arrows, Badges, Bar, Blend, Blue, Bright, Bubbles, Buttons, Caution, Circle, Drop, Elements, Glossy, Glowing, Graphic, Heart, Help, Icons, Idea, Illustration, Navigation, Oblong, Plus, Round, Service, Shadow, Shiny, Sign, Speech, Squares

Ppt Theme 3d Linear Flow Five Steps Cause And Effect Diagram PowerPoint Template Graphic
We present our PPT Theme 3d linear flow five steps cause and effect diagram PowerPoint template Graphic. Use our Arrows PowerPoint Templates because, Signpost your preferred roadmap to your eager co- travelers and demonstrate clearly how you intend to navigate them towards the desired corporate goal. Use our Symbol PowerPoint Templates because; Raise your Company stocks at the Opening Bell. Use our Marketing PowerPoint Templates because, you have the process in your head, our template design showing will illuminate your thoughts. Use our Advertising PowerPoint Templates because, Team Efforts Business Template: - The concept and strategy is your strength. Use our Business PowerPoint Templates because, Marketing Strategy Business Template:- Maximizing sales of your product is the intended destination. Use these PowerPoint slides for presentations relating to Arrow, Background, Business, Chart, Diagram, Financial, Graphic, Gray, Icon, Illustration, Management, Perspective, Planning, Process, Stages, Steps, Text. The prominent colors used in the PowerPoint template are Orange, Gray, and Black
Business Process Diagram Vision 6 Stages Cause And Effect Ppt PowerPoint Templates
We present our business process diagram vision 6 stages cause and effect ppt PowerPoint templates.Download and present our Advertising PowerPoint Templates because You are well armed with penetrative ideas. Our PowerPoint Templates and Slides will provide the gunpowder you need. Use our Arrows PowerPoint Templates because You can Be the star of the show with our PowerPoint Templates and Slides. Rock the stage with your ideas. Download our Circle Charts PowerPoint Templates because You can Hit a home run with our PowerPoint Templates and Slides. See your ideas sail into the minds of your audience. Download our Business PowerPoint Templates because It will get your audience in sync. Download and present our Shapes PowerPoint Templates because Our PowerPoint Templates and Slides will definately Enhance the stature of your presentation. Adorn the beauty of your thoughts with their colourful backgrounds.Use these PowerPoint slides for presentations relating to Arrow, box, brochure, business, button, catalog, chart, circle, company, cross, data, design, diagram, direction, document, financial, glossy, goals, graph, junction, management, market, marketing, model, multiple, navigation, network, options, pie, plan, presentation, process, results, shiny, six, sphere, statistics, stock, structure, template, vector, website. The prominent colors used in the PowerPoint template are Blue, Gray, Black.

Business Process Flow Chart Examples 6 Stages Cause And Effect Diagram Ppt PowerPoint Slides
We present our business process flow chart examples 6 stages cause and effect diagram ppt PowerPoint Slides.Use our Marketing PowerPoint Templates because Our PowerPoint Templates and Slides are designed to help you succeed. They have all the ingredients you need. Present our Business PowerPoint Templates because Our PowerPoint Templates and Slides will embellish your thoughts. See them provide the desired motivation to your team. Download our Shapes PowerPoint Templates because Your audience will believe you are the cats whiskers. Download our Circle Charts PowerPoint Templates because Our PowerPoint Templates and Slides will bullet point your ideas. See them fall into place one by one. Use our Signs PowerPoint Templates because Our PowerPoint Templates and Slides will generate and maintain the level of interest you desire. They will create the impression you want to imprint on your audience.Use these PowerPoint slides for presentations relating to Brochure, business, button, catalog, chart, circle, company, cross, data, design, diagram, direction, document, financial, glossy, goals, graph, junction, management, market, marketing, model, multiple, navigation, network, options, pie, plan, presentation, process, results, shiny, six, sphere, statistics, stock, structure, template, vector, website. The prominent colors used in the PowerPoint template are Yellow, Gray, Black.
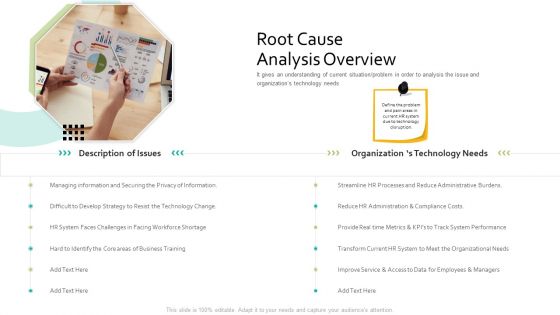
Root Cause Analysis Overview Human Resource Information System For Organizational Effectiveness Summary PDF
This is a Root Cause Analysis Overview Human Resource Information System For Organizational Effectiveness Summary Pdf template with various stages. Focus and dispense information on one stages using this creative set, that comes with editable features. It contains large content boxes to add your information on topics like develop, strategy, business, organizational, performance. You can also showcase facts, figures, and other relevant content using this PPT layout. Grab it now.

Root Cause Analysis Template 1 Ppt PowerPoint Presentation Gallery Graphic Tips
This is a root cause analysis template 1 ppt powerpoint presentation gallery graphic tips. This is a three stage process. The stages in this process are management, cause, man, method, material.

Root Cause Analysis Template 1 Ppt PowerPoint Presentation Styles Graphics Design
This is a root cause analysis template 1 ppt powerpoint presentation styles graphics design. This is a three stage process. The stages in this process are management, man, method, material, measurement.
Root Cause Analysis Template 1 Ppt PowerPoint Presentation Styles Graphic Tips
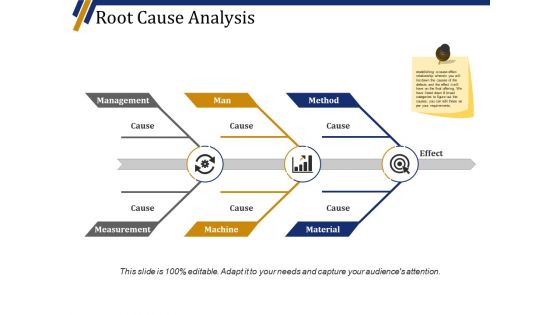
This is a root cause analysis template 1 ppt powerpoint presentation styles graphic tips. This is a three stage process. The stages in this process are management, man, method, material, machine.
The Fishbone Analysis Tool Sources Of Variation Method Rules PDF
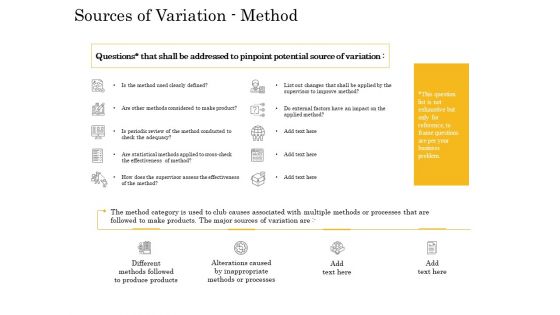
Deliver and pitch your topic in the best possible manner with this the fishbone analysis tool sources of variation method rules pdf. Use them to share invaluable insights on inappropriate methods processes, different methods followed to produce products, statistical methods applied, effectiveness method, external factors, conducted adequacy and impress your audience. This template can be altered and modified as per your expectations. So, grab it now.
Fishbone Model And Method For Gap Analysis Elements PDF
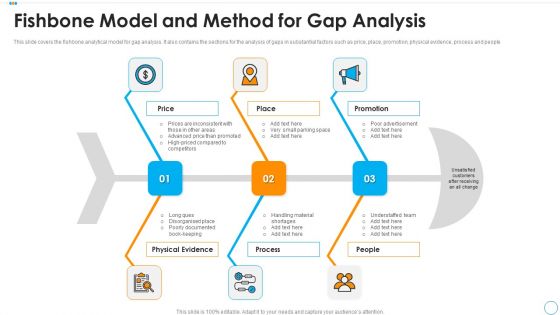
This slide covers the fishbone analytical model for gap analysis. It also contains the sections for the analysis of gaps in substantial factors such as price, place, promotion, physical evidence, process and people. Persuade your audience using this fishbone model and method for gap analysis elements pdf. This PPT design covers three stages, thus making it a great tool to use. It also caters to a variety of topics including physical evidence, process, people. Download this PPT design now to present a convincing pitch that not only emphasizes the topic but also showcases your presentation skills.
Ppt Direct Flow Of Marketing Startegy Ishikawa Diagram PowerPoint Template Templates
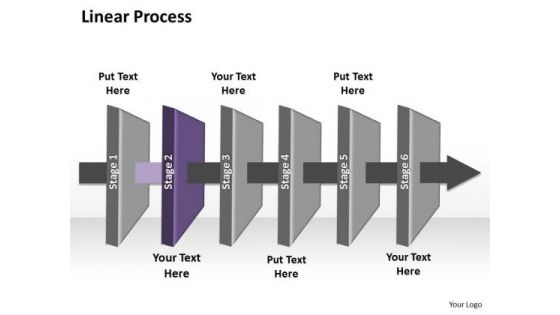
PPT direct flow of marketing startegy ishikawa diagram powerpoint template Templates-Use this graphical approach to represent global business issues such as financial data, stock market Exchange, increase in sales, corporate presentations and more. It Signifies common, comprehensive, extensive, global, international, multinational, omnipresent, planetary, ubiquitous, universal etc.-PPT direct flow of marketing startegy ishikawa diagram powerpoint template Templates-3d, Air, Arrow, Art, Business, Chart, Clip, Clipart, Cooling, Diagram, Drip, Drop, Dry, Energy, Eps10, Evaporate, Evaporating, Evaporation, Graphic, Heat, Icon, Illustration, Isolated, Isometric, Layers, Material, Moisture, Process
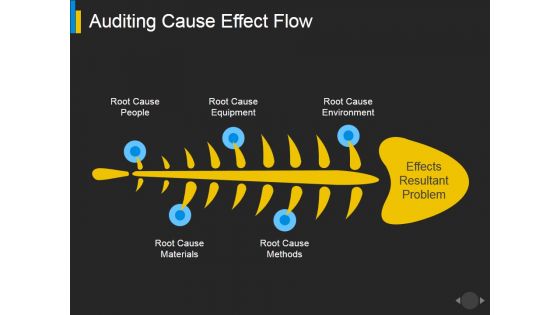
Auditing Cause Effect Flow Ppt PowerPoint Presentation Outline Templates
This is a auditing cause effect flow ppt powerpoint presentation outline templates. This is a five stage process. The stages in this process are root cause people, root cause equipment, root cause methods.
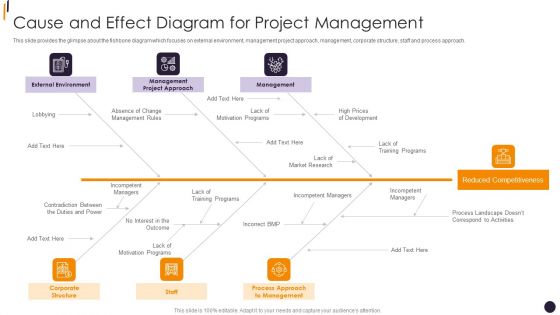
PMP Tools Cause And Effect Diagram For Project Management Introduction PDF
This slide provides the glimpse about the fishbone diagram which focuses on external environment, management project approach, management, corporate structure, staff and process approach.Introducing our well designed PMP Tools Cause And Effect Diagram For Project Management Introduction PDF set of slides. The slide displays editable icons to enhance your visual presentation. The icons can be edited easily. So customize according to your business to achieve a creative edge. Download and share it with your audience.
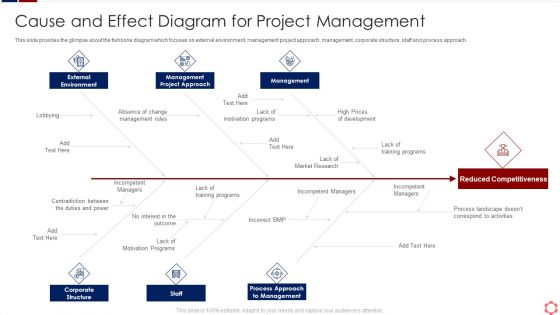
Business Operation Modeling Approaches Cause And Effect Diagram For Project Management Clipart PDF
This slide provides the glimpse about the fishbone diagram which focuses on external environment, management project approach, management, corporate structure, staff and process approach.Deliver an awe inspiring pitch with this creative business operation modeling approaches cause and effect diagram for project management clipart pdf bundle. Topics like external environment, management project approach, corporate structure can be discussed with this completely editable template. It is available for immediate download depending on the needs and requirements of the user.
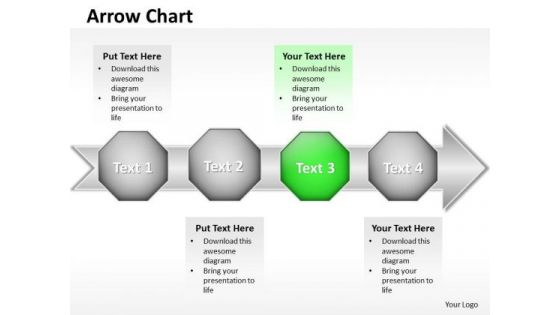
Ppt Organization Flow Free Fishbone Diagram PowerPoint Template Templates
PPT organization flow free fishbone diagram powerpoint template Templates-Our compelling Diagram consists of a design of Hexagonal Boxes on the Arrow representing four different views on the Similar Issue. This Diagram will help you to Explain the Third View out of all four Expressing through Green Hexagonal Box on the Arrow.-PPT organization flow free fishbone diagram powerpoint template Templates-arrow, assurance, background, business, chart, communication, concept, consultation, contract, control, design, determination, economy, expertise, finance, financial, illustration, investment, key, management, marketing, planning, sale, success, table, work
Root Cause Analysis And Preventive Actions Template Ppt PowerPoint Presentation Gallery Icons PDF
Pitch your topic with ease and precision using this root cause analysis and preventive actions template ppt powerpoint presentation gallery icons pdf. This layout presents information on root cause analysis and preventive actions template. It is also available for immediate download and adjustment. So, changes can be made in the color, design, graphics or any other component to create a unique layout.
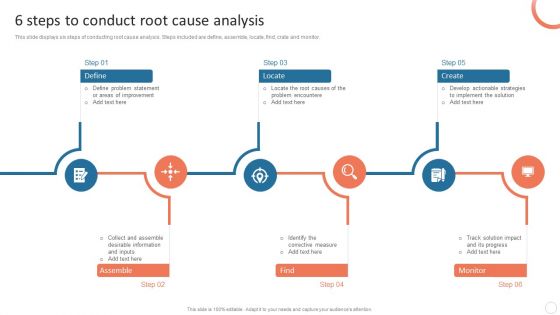
Quality Control Plan 6 Steps To Conduct Root Cause Analysis Download PDF
This slide displays six steps of conducting root cause analysis. Steps included are define, assemble, locate, find, crate and monitor. Boost your pitch with our creative Quality Control Plan 6 Steps To Conduct Root Cause Analysis Download PDF. Deliver an awe-inspiring pitch that will mesmerize everyone. Using these presentation templates you will surely catch everyones attention. You can browse the ppts collection on our website. We have researchers who are experts at creating the right content for the templates. So you dont have to invest time in any additional work. Just grab the template now and use them.

 Home
Home