Private Equity Fund Performance
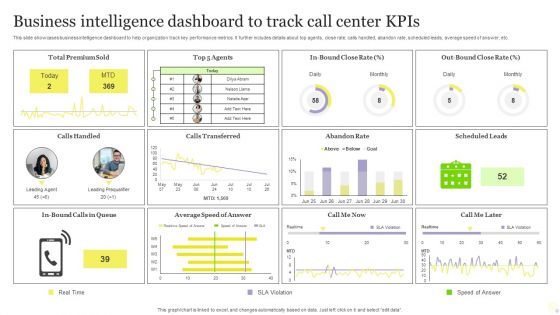
Business Intelligence Dashboard To Track Call Center Kpis Download PDF
This slide showcases business intelligence dashboard to help organization track key performance metrics. It further includes details about top agents, close rate, calls handled, abandon rate, scheduled leads, average speed of answer, etc. Pitch your topic with ease and precision using this Business Intelligence Dashboard To Track Call Center Kpis Download PDF. This layout presents information on Business Intelligence Dashboard, Track Call Center Kpis. It is also available for immediate download and adjustment. So, changes can be made in the color, design, graphics or any other component to create a unique layout.

Information Technology Project Analysis With Kpi Dashboard Portrait PDF
The following slide highlights various key performance indicators to ensure successful information technology IT project completion. It also includes components such as risks, status, budget, deadlines, average task handle time, overdue activities etc. Pitch your topic with ease and precision using this Information Technology Project Analysis With Kpi Dashboard Portrait PDF. This layout presents information on Planning Completed, Design Completed, Development . It is also available for immediate download and adjustment. So, changes can be made in the color, design, graphics or any other component to create a unique layout.

Multi Step Working Process Of Microfinance Institutions Complete Guide To Microfinance Fin SS V
This slide elaborates the four-step working process of microfinance institutions that mentions the operational working of microfinance services. Key steps are identification of clients, credit assessment, fund utilization, and repayment. This Multi Step Working Process Of Microfinance Institutions Complete Guide To Microfinance Fin SS V from Slidegeeks makes it easy to present information on your topic with precision. It provides customization options, so you can make changes to the colors, design, graphics, or any other component to create a unique layout. It is also available for immediate download, so you can begin using it right away. Slidegeeks has done good research to ensure that you have everything you need to make your presentation stand out. Make a name out there for a brilliant performance.

Product Data Insights Analysis Sheet Infographics PDF
The following slide depicts the annual performance of multiple products in terms of profit or loss to track whether they are doing well or not. The analysis sheet includes element such as cost, units, selling price, sales etc. Pitch your topic with ease and precision using this Product Data Insights Analysis Sheet Infographics PDF. This layout presents information on Unit Sold, Selling Price, Total Sales. It is also available for immediate download and adjustment. So, changes can be made in the color, design, graphics or any other component to create a unique layout.

KPI Framework For Measuring Organizational Growth Ppt PowerPoint Presentation Gallery Template PDF
This slide outlines major key performance indicator framework for measuring organization growth. It includes kips such as return on investment, customer churn rate, employee satisfaction index, project efficiency and client retention rate. Pitch your topic with ease and precision using this kpi framework for measuring organizational growth ppt powerpoint presentation gallery template pdf This layout presents information on customer, investment, rate It is also available for immediate download and adjustment. So, changes can be made in the color, design, graphics or any other component to create a unique layout.
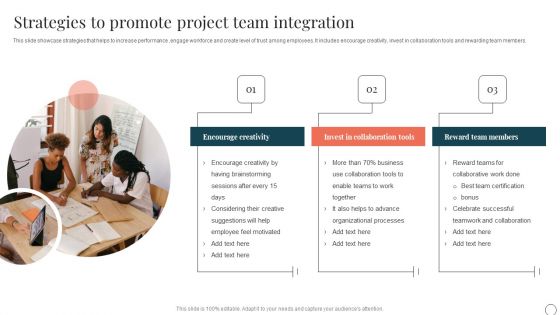
Strategies To Promote Project Team Integration Ppt PowerPoint Presentation File Pictures PDF
This slide showcase strategies that helps to increase performance ,engage workforce and create level of trust among employees. It includes encourage creativity, invest in collaboration tools and rewarding team members. Persuade your audience using this Strategies To Promote Project Team Integration Ppt PowerPoint Presentation File Pictures PDF. This PPT design covers three stages, thus making it a great tool to use. It also caters to a variety of topics including Encourage Creativity, Invest In Collaboration Tools, Reward Team Members. Download this PPT design now to present a convincing pitch that not only emphasizes the topic but also showcases your presentation skills.

Cloud Relocation Strategy Risk Mitigation Microsoft Pdf
The following slide outlines risks involved in cloud migration roadmap to ensure assets on cloud are safe and avoids distorting cloud performance of organization. It covers inappropriate strategy, complex architecture, data loss, wasteful investment, latency with respective mitigation measures.Pitch your topic with ease and precision using this Cloud Relocation Strategy Risk Mitigation Microsoft Pdf. This layout presents information on Inappropriate Strategy, Complex Architecture, Wasteful Investment, Latency Causing Damage. It is also available for immediate download and adjustment. So, changes can be made in the color, design, graphics or any other component to create a unique layout.
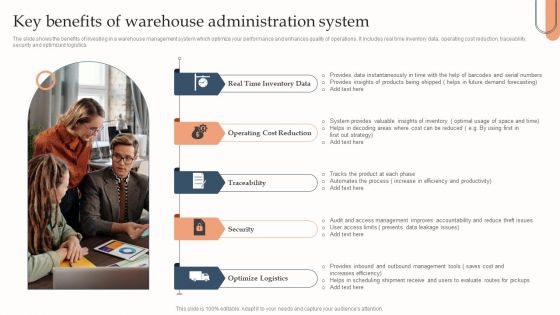
Key Benefits Of Warehouse Administration System Clipart PDF
The slide shows the benefits of investing in a warehouse management system which optimize your performance and enhances quality of operations. It includes real time inventory data, operating cost reduction, traceability,security and optimized logistics.Persuade your audience using this Key Benefits Of Warehouse Administration System Clipart PDF. This PPT design covers five stages, thus making it a great tool to use. It also caters to a variety of topics including Time Inventory Data, Operating Cost Reduction, Optimize Logistics. Download this PPT design now to present a convincing pitch that not only emphasizes the topic but also showcases your presentation skills.

Post COVID Recovery Strategy Oil Gas Industry Annual Returns To Shareholder Of Oil And Gas Industry Pictures PDF
This slide covers the oil and gas industry performance for the shareholders for past 15 years and impact of covid in the year 2020 has been shared in this graph along with the key insights. Deliver and pitch your topic in the best possible manner with this post covid recovery strategy oil gas industry annual returns to shareholder of oil and gas industry pictures pdf. Use them to share invaluable insights on annual returns to shareholder of oil and gas industry and impress your audience. This template can be altered and modified as per your expectations. So, grab it now.
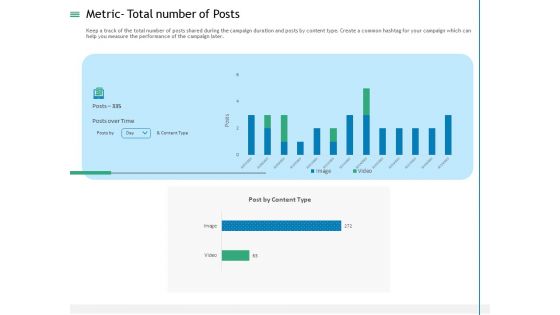
Measuring Influencer Marketing ROI Metric Total Number Of Posts Demonstration PDF
Keep a track of the total number of posts shared during the campaign duration and posts by content type. Create a common hashtag for your campaign which can help you measure the performance of the campaign later. Deliver an awe-inspiring pitch with this creative measuring influencer marketing roi metric total number of posts demonstration pdf bundle. Topics like metric total number of posts can be discussed with this completely editable template. It is available for immediate download depending on the needs and requirements of the user.

Cross Border Integration In Multinational Corporation Global Coordination Dashboard Download PDF
This slide provides information regarding the dashboard that contains indicators to determine the logistics performance to maintain coordination activities in various dispersed facilities in different regions across the globe. Deliver an awe-inspiring pitch with this creative cross border integration in multinational corporation global coordination dashboard download pdf bundle. Topics like loading time and weight, delivery status, avg loading, avg loading time, avg loading weight, time limit can be discussed with this completely editable template. It is available for immediate download depending on the needs and requirements of the user.

SCR For Market Low Correlation Between Rank And Customer Satisfaction Rules PDF
The purpose of this slide is to provide information about how particular brand rank is poorly correlated with the customer satisfaction factor. Deliver and pitch your topic in the best possible manner with this SCR for market low correlation between rank and customer satisfaction rules pdf. Use them to share invaluable insights on low correlation between rank and customer satisfaction, same scores for two customers, different performance relative to competition, very different business results and impress your audience. This template can be altered and modified as per your expectations. So, grab it now.
Work Execution Liability Message From The Chief Financial Officer Ppt Icon Mockup PDF
The following slide provides an overview of the chief financial officers message that briefly introduces the clients to the annual financial performance along with major annual financial highlights. Deliver and pitch your topic in the best possible manner with this work execution liability message from the chief financial officer ppt icon mockup pdf. Use them to share invaluable insights on revenue, operating profit, cash flow, operating activities and impress your audience. This template can be altered and modified as per your expectations. So, grab it now.
Case Competition Inflated Fuel Price In Logistics Firm Logistics Dashboard For XYZ Logistic Company Product Icons PDF
The slide shows the logistic measurement dashboard for measuring order status, total orders, overdue shipments, global financial performance etc. Deliver and pitch your topic in the best possible manner with this case competition inflated fuel price in logistics firm logistics dashboard for xyz logistic company product icons pdf. Use them to share invaluable insights on overdue to ship, overdue shipments, open pos, late vendor shipments and impress your audience. This template can be altered and modified as per your expectations. So, grab it now.
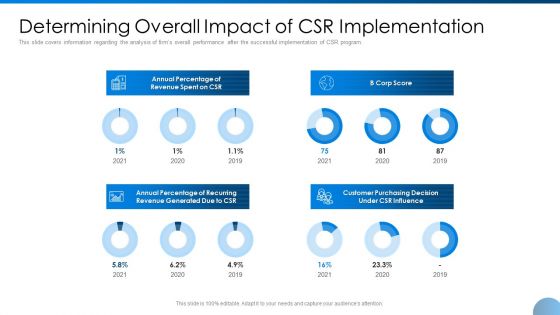
Determining Overall Impact Of CSR Implementation Ppt Pictures Model PDF
This slide covers information regarding the analysis of firms overall performance after the successful implementation of CSR program. Deliver and pitch your topic in the best possible manner with this determining overall impact of csr implementation ppt pictures model pdf. Use them to share invaluable insights on annual percentage of revenue spent on csr, annual percentage of recurring revenue generated due to csr, customer purchasing decision under csr influence, corp score and impress your audience. This template can be altered and modified as per your expectations. So, grab it now.
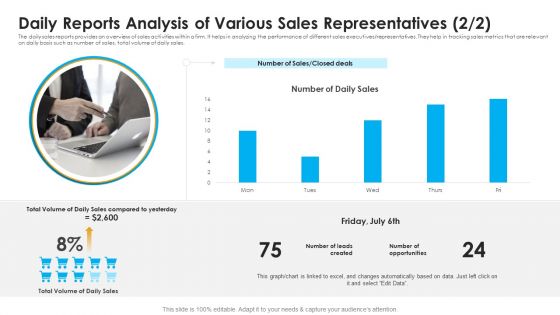
Daily Reports Analysis Of Various Sales Representatives Daily Ppt Gallery Graphic Tips PDF
The daily sales reports provides an overview of sales activities within a firm. It helps in analyzing the performance of different sales executives representatives. They help in tracking sales metrics that are relevant on daily basis such as number of sales, total volume of daily sales. Deliver and pitch your topic in the best possible manner with this daily reports analysis of various sales representatives daily ppt gallery graphic tips pdf. Use them to share invaluable insights on opportunities, sales, analysis and impress your audience. This template can be altered and modified as per your expectations. So, grab it now.

Number Of Customers Projection For Next Five Years Ppt Infographics Format PDF
This slide provides the projections of key performance indicators KPIs related to customer onboarding. KPIs covered in this slide include number of customers, customer churn rate, customer retention rate etc. Deliver and pitch your topic in the best possible manner with this number of customers projection for next five years ppt infographics format pdf. Use them to share invaluable insights on number of customers projection for next five years and impress your audience. This template can be altered and modified as per your expectations. So, grab it now.
Building Efficient Work Environment Impact On Employees Due To Improved Company Cultural Process Icons PDF
This graph focuses on the impact on employees due to improved company culture. Here the evaluation is based on the company process and employees motivational factors. Deliver and pitch your topic in the best possible manner with this building efficient work environment impact on employees due to improved company cultural process icons pdf. Use them to share invaluable insights on organization, process, community, planning, performance and impress your audience. This template can be altered and modified as per your expectations. So, grab it now.

Transforming Organizational Processes And Outcomes Impact On Employees Due To Improved Company Cultural Process Demonstration PDF
This graph focuses on the impact on employees due to improved company culture. Here the evaluation is based on the company process and employees motivational factors. Deliver and pitch your topic in the best possible manner with this transforming organizational processes and outcomes impact on employees due to improved company cultural process demonstration pdf. Use them to share invaluable insights on organization, process, community, planning, performance and impress your audience. This template can be altered and modified as per your expectations. So, grab it now.
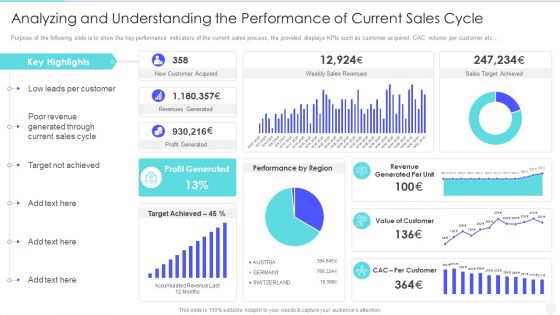
Increase Returns By Examining And Executing New Sales Qualification Procedure Analyzing And Understanding Clipart PDF
Purpose of the following slide is to show the key performance indicators of the current sales process, the provided displays KPIs such as customer acquired, CAC, volume per customer etc. Deliver an awe inspiring pitch with this creative increase returns by examining and executing new sales qualification procedure analyzing and understanding clipart pdf bundle. Topics like sales, target, revenue, profit generated, value can be discussed with this completely editable template. It is available for immediate download depending on the needs and requirements of the user.
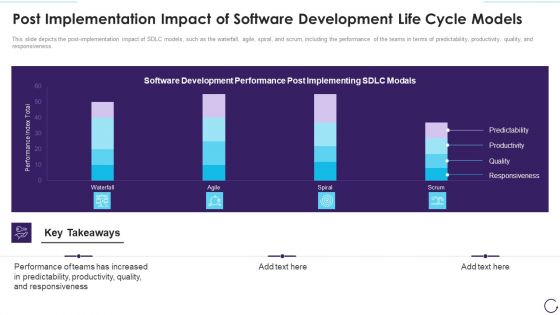
Post Implementation Impact Of Software Development Life Cycle Models Diagrams PDF
This slide depicts the post-implementation impact of SDLC models, such as the waterfall, agile, spiral, and scrum, including the performance of the teams in terms of predictability, productivity, quality, and responsiveness. Deliver an awe inspiring pitch with this creative overview of the software development life cycle company demonstration pdf bundle. Topics like maintenance of the product, requirement gathering and analysis, deployment in the market can be discussed with this completely editable template. It is available for immediate download depending on the needs and requirements of the user.
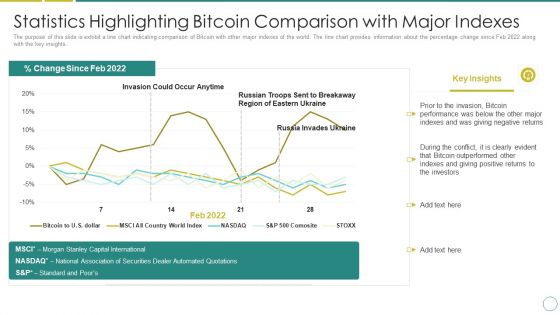
Russia Ukraine Statistics Highlighting Bitcoin Comparison With Major Indexes Mockup PDF
The purpose of this slide is exhibit a line chart indicating comparison of Bitcoin with other major indexes of the world. The line chart provides information about the percentage change since Feb 2022 along with the key insights. Deliver an awe inspiring pitch with this creative russia ukraine statistics highlighting bitcoin comparison with major indexes mockup pdf bundle. Topics like invasion could occur anytime, russia invades ukraine, bitcoin performance can be discussed with this completely editable template. It is available for immediate download depending on the needs and requirements of the user.
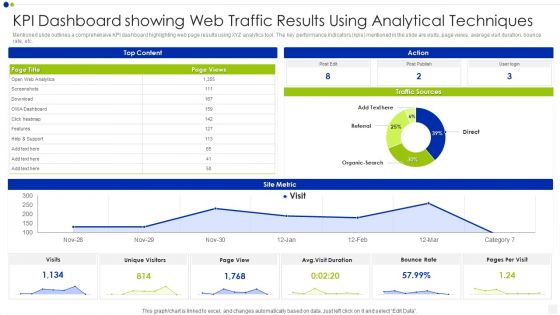
KPI Dashboard Showing Web Traffic Results Using Analytical Techniques Inspiration PDF
Mentioned slide outlines a comprehensive KPI dashboard highlighting web page results using XYZ analytics tool. The key performance indicators kpis mentioned in the slide are visits, page views, average visit duration, bounce rate, etc. Pitch your topic with ease and precision using this kpi dashboard showing web traffic results using analytical techniques inspiration pdf. This layout presents information on bounce rate, traffic sources, analytics. It is also available for immediate download and adjustment. So, changes can be made in the color, design, graphics or any other component to create a unique layout.
Social Media Engagement To Increase Customer Engagement Companys Existing Social Media Engagement Icons PDF
This slide depicts current social media engagement performance of organization. It includes information about organic reach, average shares per post, new likes and followers and leads generated from social media platforms. Deliver an awe inspiring pitch with this creative Social Media Engagement To Increase Customer Engagement Companys Existing Social Media Engagement Icons PDF bundle. Topics like Companys Existing Social Media Engagement Scenario can be discussed with this completely editable template. It is available for immediate download depending on the needs and requirements of the user.
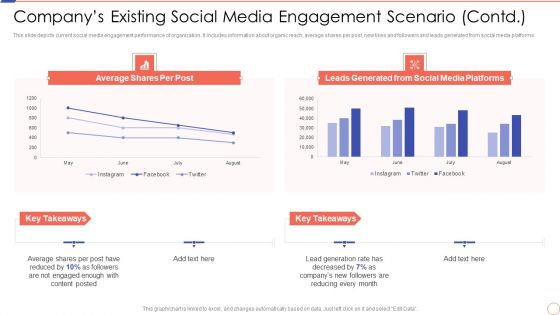
Social Media Engagement To Increase Customer Engagement Companys Existing Social Media Microsoft PDF
This slide depicts current social media engagement performance of organization. It includes information about organic reach, average shares per post, new likes and followers and leads generated from social media platforms. Deliver and pitch your topic in the best possible manner with this Social Media Engagement To Increase Customer Engagement Companys Existing Social Media Microsoft PDF. Use them to share invaluable insights on Companys Existing Social Media Engagement Scenario Contd and impress your audience. This template can be altered and modified as per your expectations. So, grab it now.
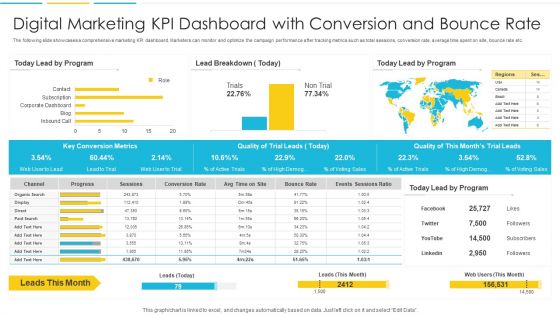
Digital Marketing KPI Dashboard With Conversion And Bounce Rate Introduction PDF
The following slide showcases a comprehensive marketing KPI dashboard. Marketers can monitor and optimize the campaign performance after tracking metrics such as total sessions, conversion rate, average time spent on site, bounce rate etc. Pitch your topic with ease and precision using this Digital Marketing KPI Dashboard With Conversion And Bounce Rate Introduction PDF. This layout presents information on Organic, Progress, Conversion Rate. It is also available for immediate download and adjustment. So, changes can be made in the color, design, graphics or any other component to create a unique layout

Startup Business Financial Dashboard With Key Metrics Sample PDF
This slide represents the financial dashboard for startup company with key performance indicators. It includes details related to current working capital, cash conversion cycle in days and vendor payment error rate. Pitch your topic with ease and precision using this Startup Business Financial Dashboard With Key Metrics Sample PDF. This layout presents information on Cash Conversion Cycle, Current Working Capital, Current Liabilities Debt. It is also available for immediate download and adjustment. So, changes can be made in the color, design, graphics or any other component to create a unique layout.
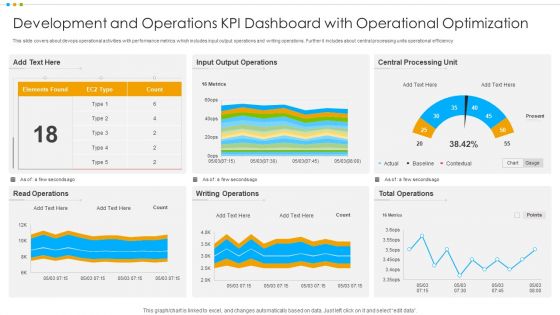
Development And Operations KPI Dashboard With Operational Optimization Pictures PDF
This slide covers about devops operational activities with performance metrics which includes input output operations and writing operations. Further it includes about central processing units operational efficiency.Pitch your topic with ease and precision using this Development And Operations KPI Dashboard With Operational Optimization Pictures PDF This layout presents information on Output Operations, Central Processing, Total Operations It is also available for immediate download and adjustment. So, changes can be made in the color, design, graphics or any other component to create a unique layout.
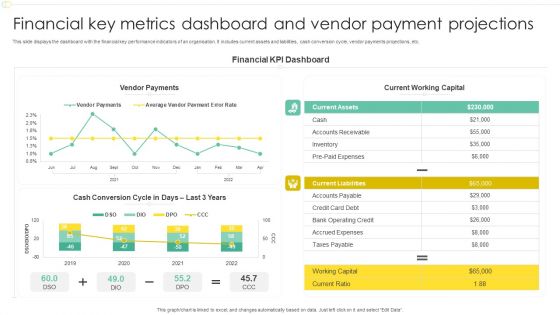
Financial Key Metrics Dashboard And Vendor Payment Projections Professional PDF
This slide displays the dashboard with the financial key performance indicators of an organisation. It includes current assets and liabilities, cash conversion cycle, vendor payments projections, etc. Pitch your topic with ease and precision using this Financial Key Metrics Dashboard And Vendor Payment Projections Professional PDF. This layout presents information on Financial KPI Dashboard, Current Working Capital, Vendor Payments. It is also available for immediate download and adjustment. So, changes can be made in the color, design, graphics or any other component to create a unique layout.

Education Metrics Dashboard With College Details Formats PDF
This slide showcases the education key performance indicator tracker. It also include metrics such as overall admissions, admissions out of state, person of colour, gender, goal achievement rate, admissions by college, number of women by college, etc. Pitch your topic with ease and precision using this Education Metrics Dashboard With College Details Formats PDF. This layout presents information on Overall Admissions, Person Of Color, Percent To Goal. It is also available for immediate download and adjustment. So, changes can be made in the color, design, graphics or any other component to create a unique layout.
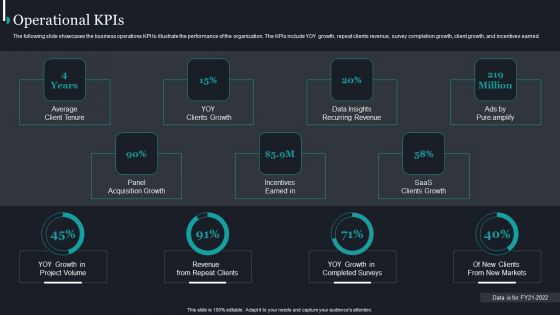
Pureprofile Business Overview Operational Kpis Ppt Summary Introduction PDF
The following slide showcases the business operations KPI to illustrate the performance of the organization. The KPIs include YOY growth, repeat clients revenue, survey completion growth, client growth, and incentives earned. Deliver and pitch your topic in the best possible manner with this Pureprofile Business Overview Operational Kpis Ppt Summary Introduction PDF. Use them to share invaluable insights on Average Client Tenure, Panel Acquisition Growth, SaaS Clients Growth and impress your audience. This template can be altered and modified as per your expectations. So, grab it now.

Commodity Marketing KPI Dashboard For International Business Expansion Formats PDF
This slide signifies the product marketing key performance indicator dashboard for international business expansion. It covers information about sales, target, target achievement, gross profit margin, sales by region, growth and inventory outstanding.Pitch your topic with ease and precision using this Commodity Marketing KPI Dashboard For International Business Expansion Formats PDF. This layout presents information on Target Achievement, Receivale Days, Gross Profit. It is also available for immediate download and adjustment. So, changes can be made in the color, design, graphics or any other component to create a unique layout.
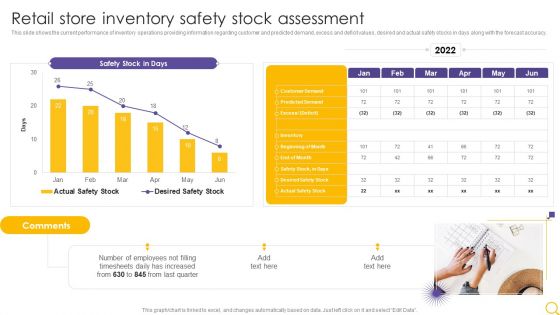
Retail Outlet Operational Efficiency Analytics Retail Store Inventory Safety Stock Assessment Template PDF
This slide shows the current performance of inventory operations providing information regarding customer and predicted demand, excess and deficit values, desired and actual safety stocks in days along with the forecast accuracy. Deliver an awe inspiring pitch with this creative Retail Outlet Operational Efficiency Analytics Retail Store Inventory Safety Stock Assessment Template PDF bundle. Topics like Safety Stock Days, Employees, Timesheets Daily can be discussed with this completely editable template. It is available for immediate download depending on the needs and requirements of the user.

Kpi Dashboard To Track Video Promotion Techniques Ppt Summary Guide PDF
This slide signifies the key performance indicator dashboard to measure video promotion techniques. It covers information regarding to the page visit, post reach, summary, click action on page. Pitch your topic with ease and precision using this Kpi Dashboard To Track Video Promotion Techniques Ppt Summary Guide PDF. This layout presents information on Page Visit, Page Summary, Post Overview. It is also available for immediate download and adjustment. So, changes can be made in the color, design, graphics or any other component to create a unique layout.

Customer Behavior Analytics Dashboard To Improve Satisfaction Ppt File Infographics PDF
The following slide provides an insight of websites performance that includes date parameters. The dashboard includes sessions, users, pageviews, bounce rate and percentage of new sessions. Pitch your topic with ease and precision using this Customer Behavior Analytics Dashboard To Improve Satisfaction Ppt File Infographics PDF. This layout presents information on Session, Avg Session Duration, Bounce Rate. It is also available for immediate download and adjustment. So, changes can be made in the color, design, graphics or any other component to create a unique layout.

Improving Digital Community Engagement Strategy Social Media Platforms Dashboard With Key Metrics Professional PDF
This slide shows KPI dashboard for assessing performance of social media platforms. It provides information about followers, likes, clicks, shares, impressions, engaged users, new followers, etc. Deliver and pitch your topic in the best possible manner with this Improving Digital Community Engagement Strategy Social Media Platforms Dashboard With Key Metrics Professional PDF. Use them to share invaluable insights on Social Media Platforms Engagement, Key Engagement Metrics and impress your audience. This template can be altered and modified as per your expectations. So, grab it now.

Health And Risk KPI Dashboard Ppt Pictures Designs Download PDF
The slide highlights the health and safety key performance indicator dashboard illustrating key headings which includes key objectives, inspections, total reports vs over due reports, injuries by body part and accident trends. Pitch your topic with ease and precision using this Health And Risk KPI Dashboard Ppt Pictures Designs Download PDF. This layout presents information on Key Objectives, Inspections, Accidents Trends. It is also available for immediate download and adjustment. So, changes can be made in the color, design, graphics or any other component to create a unique layout.
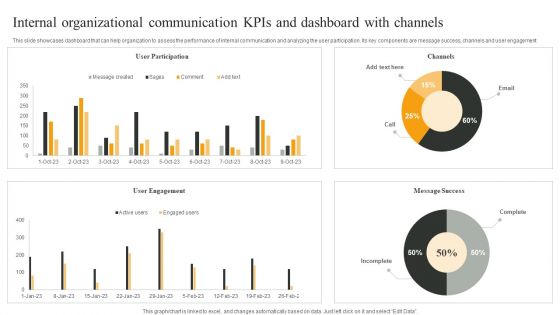
Internal Organizational Communication Kpis And Dashboard With Channels Infographics PDF
This slide showcases dashboard that can help organization to assess the performance of internal communication and analyzing the user participation. Its key components are message success, channels and user engagement. Pitch your topic with ease and precision using this Internal Organizational Communication Kpis And Dashboard With Channels Infographics PDF. This layout presents information on User Participation, User Engagement, Message Success. It is also available for immediate download and adjustment. So, changes can be made in the color, design, graphics or any other component to create a unique layout.
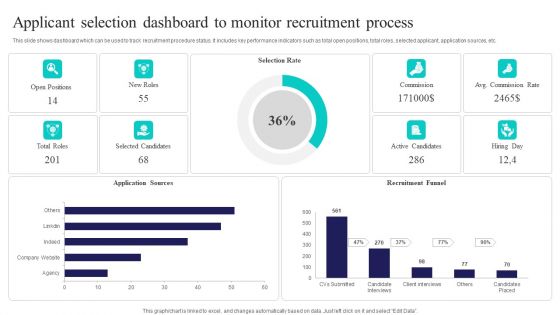
Applicant Selection Dashboard To Monitor Recruitment Process Sample PDF
This slide shows dashboard which can be used to track recruitment procedure status. It includes key performance indicators such as total open positions, total roles, selected applicant, application sources, etc. Pitch your topic with ease and precision using this Applicant Selection Dashboard To Monitor Recruitment Process Sample PDF. This layout presents information on Selection Rate, Recruitment Funnel, Application Sources. It is also available for immediate download and adjustment. So, changes can be made in the color, design, graphics or any other component to create a unique layout.
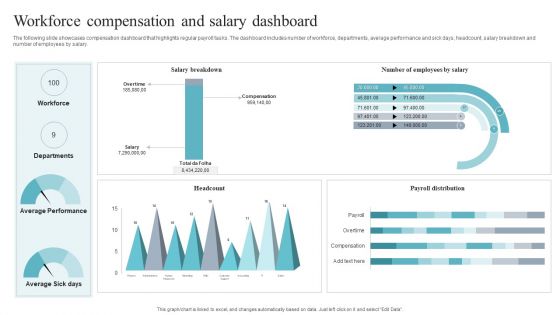
Workforce Compensation And Salary Dashboard Brochure PDF
The following slide showcases compensation dashboard that highlights regular payroll tasks. The dashboard includes number of workforce, departments, average performance and sick days, headcount, salary breakdown and number of employees by salary. Pitch your topic with ease and precision using this Workforce Compensation And Salary Dashboard Brochure PDF. This layout presents information on Workforce Compensation, Salary Dashboard. It is also available for immediate download and adjustment. So, changes can be made in the color, design, graphics or any other component to create a unique layout.
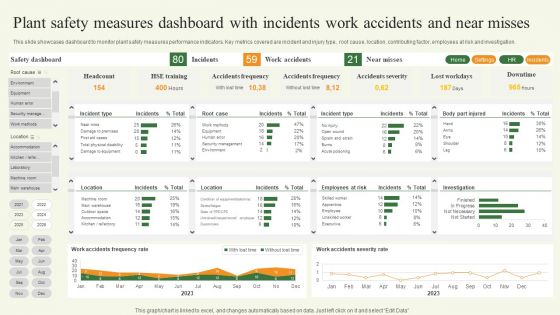
Plant Safety Measures Dashboard With Incidents Work Accidents And Near Misses Template PDF
This slide showcases dashboard to monitor plant safety measures performance indicators. Key metrics covered are incident and injury type, root cause, location, contributing factor, employees at risk and investigation. Pitch your topic with ease and precision using this Plant Safety Measures Dashboard With Incidents Work Accidents And Near Misses Template PDF. This layout presents information on Plant Safety Measures Dashboard, Incidents Work Accidents. It is also available for immediate download and adjustment. So, changes can be made in the color, design, graphics or any other component to create a unique layout.
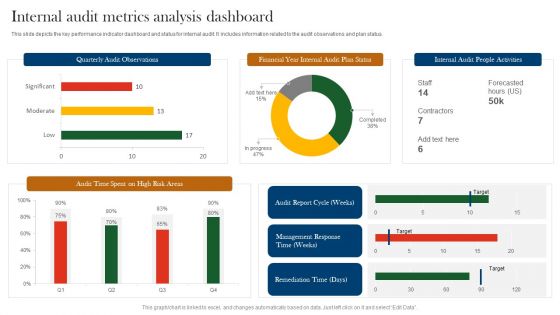
Internal Audit Metrics Analysis Dashboard Ppt Ideas Clipart Images PDF
This slide depicts the key performance indicator dashboard and status for internal audit. It includes information related to the audit observations and plan status. Pitch your topic with ease and precision using this Internal Audit Metrics Analysis Dashboard Ppt Ideas Clipart Images PDF. This layout presents information on Quarterly Audit Observations, Financial Year Internal, Audit Plan Status. It is also available for immediate download and adjustment. So, changes can be made in the color, design, graphics or any other component to create a unique layout.
Executive Dashboards For Tracking Financial Health Of Enterprise Diagrams PDF
This slide represents the CEO dashboard to track the financial health of an organization. It includes key performance indicators such as revenue, expenses, activity ratio, gross profit margin, EBIT etc. Pitch your topic with ease and precision using this Executive Dashboards For Tracking Financial Health Of Enterprise Diagrams PDF. This layout presents information on Revenue, Expense, Activity Ratio. It is also available for immediate download and adjustment. So, changes can be made in the color, design, graphics or any other component to create a unique layout.

Project Data Quality Kpis Metrics Summary Dashboard With Threshold Guidelines PDF
This slide covers different KPIs to measure performance of data quality for project completion. It includes metric such as consistency, completeness, orderliness, timeliness, accuracy, auditability and uniqueness with thresholds. Pitch your topic with ease and precision using this Project Data Quality Kpis Metrics Summary Dashboard With Threshold Guidelines PDF. This layout presents information on Consistency, Completeness, Orderliness. It is also available for immediate download and adjustment. So, changes can be made in the color, design, graphics or any other component to create a unique layout.
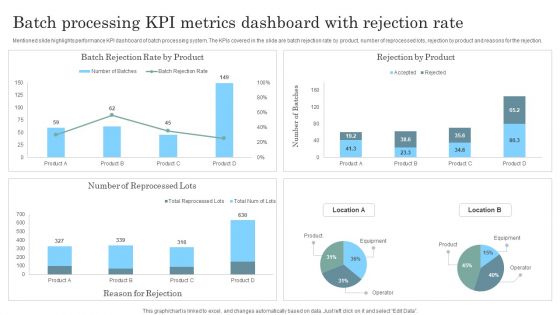
Batch Processing KPI Metrics Dashboard With Rejection Rate Topics PDF
Mentioned slide highlights performance KPI dashboard of batch processing system. The KPIs covered in the slide are batch rejection rate by product, number of reprocessed lots, rejection by product and reasons for the rejection. Pitch your topic with ease and precision using this Batch Processing KPI Metrics Dashboard With Rejection Rate Topics PDF. This layout presents information on Batch Processing KPI Metrics, Dashboard Rejection Rate. It is also available for immediate download and adjustment. So, changes can be made in the color, design, graphics or any other component to create a unique layout.

Employee Survey Analysis Dashboard Post Icebreaker Activities Session Slides PDF
This slide presents an Employee survey analysis dashboard which is used to analyze results post ice breaking session. The key performance indicators are employee engagement score, participation rate, engagement score over time etc. Pitch your topic with ease and precision using this Employee Survey Analysis Dashboard Post Icebreaker Activities Session Slides PDF. This layout presents information on Participation Rate, Employee Engagement Score. It is also available for immediate download and adjustment. So, changes can be made in the color, design, graphics or any other component to create a unique layout.

KPI Dashboard To Measure Work Place Mishap And Workers Safety Inspiration PDF
This slide signifies key performance indicator dashboard to evaluate work accident. It includes information about total incident occurred by role and by department along with leave status. Pitch your topic with ease and precision using this KPI Dashboard To Measure Work Place Mishap And Workers Safety Inspiration PDF. This layout presents information on Accidents Role, Accidents Leave, Accidents Department. It is also available for immediate download and adjustment. So, changes can be made in the color, design, graphics or any other component to create a unique layout.
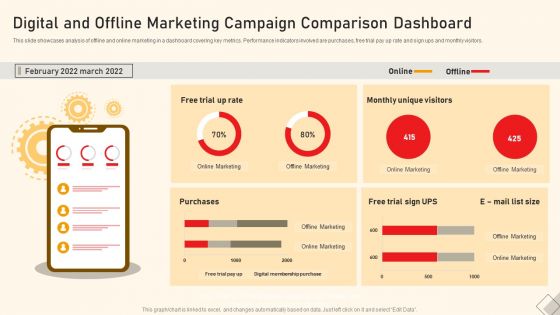
Digital And Offline Marketing Campaign Comparison Dashboard Ppt Inspiration Microsoft PDF
This slide showcases analysis of offline and online marketing in a dashboard covering key metrics. Performance indicators involved are purchases, free trial pay up rate and sign ups and monthly visitors. Pitch your topic with ease and precision using this Digital And Offline Marketing Campaign Comparison Dashboard Ppt Inspiration Microsoft PDF. This layout presents information on Online Marketing, Offline Marketing, Free Trial Sign, UPS. It is also available for immediate download and adjustment. So, changes can be made in the color, design, graphics or any other component to create a unique layout.
Lead Tracking Dashboard With Metric Comparison Brochure PDF
This slide showcases dashboard of lead pipeline that can help to identify total number of leads generated and expenses incurred to acquire the audience. It also showcases other key performance metrics like lead breakdown by status and number of leads per month. Pitch your topic with ease and precision using this Lead Tracking Dashboard With Metric Comparison Brochure PDF. This layout presents information on Metric Comparison, Lead Pipeline, Lead Breakdown Status. It is also available for immediate download and adjustment. So, changes can be made in the color, design, graphics or any other component to create a unique layout.

IT Software Consultancy Service Executive Report Structure PDF
This slide showcase software consultancy service overview highlighting their performance in market. It includes elements such as overview, market share, team members, financial insights, industries serve, technology used etc. Pitch your topic with ease and precision using this IT Software Consultancy Service Executive Report Structure PDF. This layout presents information on Financial Insights, Our Team, Industries We Serve. It is also available for immediate download and adjustment. So, changes can be made in the color, design, graphics or any other component to create a unique layout.

Business Intelligence Dashboard For Food And Beverage Industry Diagrams PDF
This slide showcases BI dashboard to track overall performance of business operations. It further includes elements such as sales, total transactions, non labor margin, expenses by category, etc. Pitch your topic with ease and precision using this Business Intelligence Dashboard For Food And Beverage Industry Diagrams PDF. This layout presents information on Expenses, Sales, Business Intelligence Dashboard. It is also available for immediate download and adjustment. So, changes can be made in the color, design, graphics or any other component to create a unique layout.

Online Enterprise Customer Activity Overview Dashboard Download PDF
The following slide highlights the key performance indicators of online customer activity to create better user experience. It includes KPAs such as website traffic, device breakdown summary, average time spent etc. Pitch your topic with ease and precision using this Online Enterprise Customer Activity Overview Dashboard Download PDF. This layout presents information on Device, Analysis, Summary. It is also available for immediate download and adjustment. So, changes can be made in the color, design, graphics or any other component to create a unique layout.

Manufacturing Kpis Dashboard Showing Process Cycle Time Microsoft PDF
This slide represents the dashboard showing the production manufacturing metrics. It includes key performance indicators such as process cycle time by date, table build, process completion by date, first pass yield, defective components and causes etc. Pitch your topic with ease and precision using this Manufacturing Kpis Dashboard Showing Process Cycle Time Microsoft PDF. This layout presents information on Defective Components Defect Causes, Process Cycle, Time By Date, Process Completions By Date. It is also available for immediate download and adjustment. So, changes can be made in the color, design, graphics or any other component to create a unique layout.

Digital Marketing Kpi Dashboard With Bounce Time Utilization Analysis Graphics PDF
The following slide showcases the key performance indicators of digital marketing to measure progress. It includes KPAs such as no. of visits, bounce rate, converted goals, website traffic etc. Pitch your topic with ease and precision using this Digital Marketing Kpi Dashboard With Bounce Time Utilization Analysis Graphics PDF. This layout presents information on Digital Marketing, KPI Dashboard, Bounce Time Utilization Analysis. It is also available for immediate download and adjustment. So, changes can be made in the color, design, graphics or any other component to create a unique layout.

Chinese Tourists Duration Of Stay In Indonesia Compared To ASEAN Tourists Brochure PDF
This slide showcases the length of stay of chinese tourists in indonesia compared to ASEAN tourists to identify the characteristics and performance of chinese tourists in indonesia. It also includes the length of stay for various reasons such as holiday, education, shopping, etc. Pitch your topic with ease and precision using this Chinese Tourists Duration Of Stay In Indonesia Compared To ASEAN Tourists Brochure PDF. This layout presents information on Chinese Tourists Duration, Indonesia Compared, Asean Tourists. It is also available for immediate download and adjustment. So, changes can be made in the color, design, graphics or any other component to create a unique layout.

Effect And Benefits To Enterprises While Using ABC Managing Complexity Of Multiple Cloud Platforms Information PDF
This slide covers the effect and benefits of using cloud management platform such as less expensive, performance improvement, empowering enterprise and many more.Boost your pitch with our creative Effect And Benefits To Enterprises While Using ABC Managing Complexity Of Multiple Cloud Platforms Information PDF. Deliver an awe-inspiring pitch that will mesmerize everyone. Using these presentation templates you will surely catch everyones attention. You can browse the ppts collection on our website. We have researchers who are experts at creating the right content for the templates. So you do not have to invest time in any additional work. Just grab the template now and use them.

Emotional Marketing Strategy To Nurture Affect Of Consumer Emotions On Brands Kpis Brochure PDF
This slide showcases impact of customer emotions on brands key performance indicators KPIs. It provides details about emotion, action, impact on brand, connect, empathize, encourage, virality, word of mouth marketing, etc. Boost your pitch with our creative Emotional Marketing Strategy To Nurture Affect Of Consumer Emotions On Brands Kpis Brochure PDF. Deliver an awe-inspiring pitch that will mesmerize everyone. Using these presentation templates you will surely catch everyones attention. You can browse the ppts collection on our website. We have researchers who are experts at creating the right content for the templates. So you dont have to invest time in any additional work. Just grab the template now and use them.
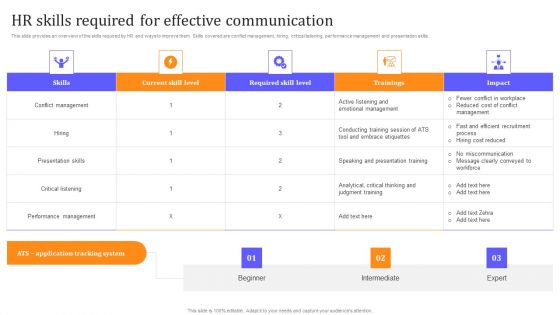
HR Communication Strategy For Workforce Engagement HR Skills Required For Effective Communication Information PDF
This slide provides an overview of the skills required by HR and ways to improve them. Skills covered are conflict management, hiring, critical listening, performance management and presentation skills. Boost your pitch with our creative HR Communication Strategy For Workforce Engagement HR Skills Required For Effective Communication Information PDF. Deliver an awe inspiring pitch that will mesmerize everyone. Using these presentation templates you will surely catch everyones attention. You can browse the ppts collection on our website. We have researchers who are experts at creating the right content for the templates. So you do not have to invest time in any additional work. Just grab the template now and use them.
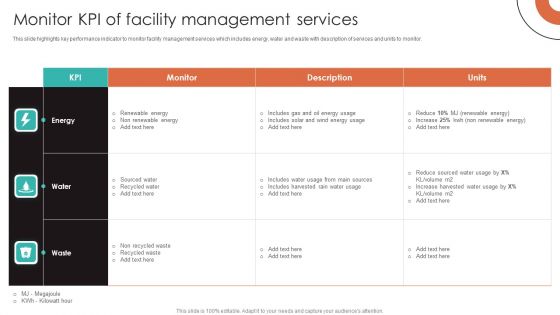
Monitor KPI Of Facility Management Services Mockup PDF
This slide highlights key performance indicator to monitor facility management services which includes energy, water and waste with description of services and units to monitor. Boost your pitch with our creative Monitor KPI Of Facility Management Services Mockup PDF. Deliver an awe-inspiring pitch that will mesmerize everyone. Using these presentation templates you will surely catch everyones attention. You can browse the ppts collection on our website. We have researchers who are experts at creating the right content for the templates. So you do not have to invest time in any additional work. Just grab the template now and use them.

Analysis Of Business Intelligence Requirement In HR Operations Background PDF
This slide represents the need for implementing business intelligence in HR operations. It represents the requirement of prediction of employee performance for which BI is required.Boost your pitch with our creative Analysis Of Business Intelligence Requirement In HR Operations Background PDF. Deliver an awe-inspiring pitch that will mesmerize everyone. Using these presentation templates you will surely catch everyones attention. You can browse the ppts collection on our website. We have researchers who are experts at creating the right content for the templates. So you do not have to invest time in any additional work. Just grab the template now and use them.

 Home
Home