Powerpoint Diagrams
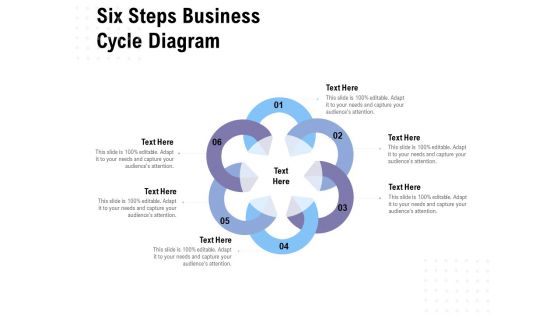
Six Steps Business Cycle Diagram Ppt PowerPoint Presentation Layouts File Formats
Presenting this set of slides with name six steps business cycle diagram ppt powerpoint presentation layouts file formats. This is a six stage process. The stages in this process are six steps, business, cycle diagram. This is a completely editable PowerPoint presentation and is available for immediate download. Download now and impress your audience.

Four Steps Arrow Process Diagram Ppt PowerPoint Presentation Outline Design Ideas
Presenting this set of slides with name four steps arrow process diagram ppt powerpoint presentation outline design ideas. This is a four stage process. The stages in this process are four steps arrow process diagram. This is a completely editable PowerPoint presentation and is available for immediate download. Download now and impress your audience.

Four Numbered List Business Diagram Ppt PowerPoint Presentation Gallery Graphic Images
Presenting this set of slides with name four numbered list business diagram ppt powerpoint presentation gallery graphic images. This is a four stage process. The stages in this process are four numbered list business diagram. This is a completely editable PowerPoint presentation and is available for immediate download. Download now and impress your audience.
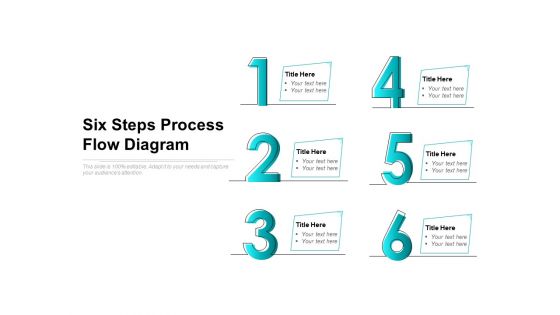
Six Steps Process Flow Diagram Ppt PowerPoint Presentation Infographic Template Example File
Presenting this set of slides with name six steps process flow diagram ppt powerpoint presentation infographic template example file. This is a six stage process. The stages in this process are six steps process flow diagram. This is a completely editable PowerPoint presentation and is available for immediate download. Download now and impress your audience.

Six Steps Business Tree Diagram Ppt PowerPoint Presentation Ideas Background Designs
Presenting this set of slides with name six steps business tree diagram ppt powerpoint presentation ideas background designs. This is a six stage process. The stages in this process are six steps business tree diagram. This is a completely editable PowerPoint presentation and is available for immediate download. Download now and impress your audience.
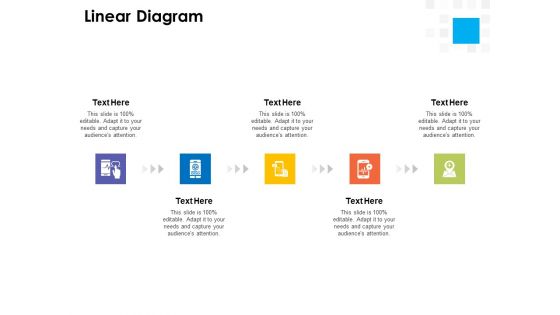
Digital Transformation Strategy Roadmap Linear Diagram Ppt PowerPoint Presentation Professional Elements PDF
Presenting this set of slides with name digital transformation strategy roadmap linear diagram ppt powerpoint presentation professional elements pdf. This is a five stage process. The stages in this process are linear diagram. This is a completely editable PowerPoint presentation and is available for immediate download. Download now and impress your audience.
Fishbone Ishikawa Cause And Effect Analysis Cause And Effect Diagram Ppt PowerPoint Presentation Portfolio Influencers PDF
Presenting this set of slides with name fishbone ishikawa cause and effect analysis cause and effect diagram ppt powerpoint presentation portfolio influencers pdf. The topics discussed in these slides are cause and effect diagram. This is a completely editable PowerPoint presentation and is available for immediate download. Download now and impress your audience.
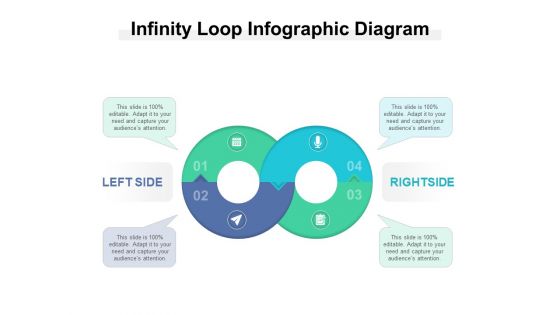
Infinity Loop Infographic Diagram Ppt PowerPoint Presentation Model Graphic Tips PDF
Presenting this set of slides with name infinity loop infographic diagram ppt powerpoint presentation model graphic tips pdf. This is a four stage process. The stages in this process are infinity loop infographic diagram. This is a completely editable PowerPoint presentation and is available for immediate download. Download now and impress your audience.

Implementing Compelling Marketing Channel Circular Diagram Ppt PowerPoint Presentation Outline Objects PDF
Presenting this set of slides with name implementing compelling marketing channel circular diagram ppt powerpoint presentation outline objects pdf. This is a four stage process. The stages in this process are circular diagram. This is a completely editable PowerPoint presentation and is available for immediate download. Download now and impress your audience.
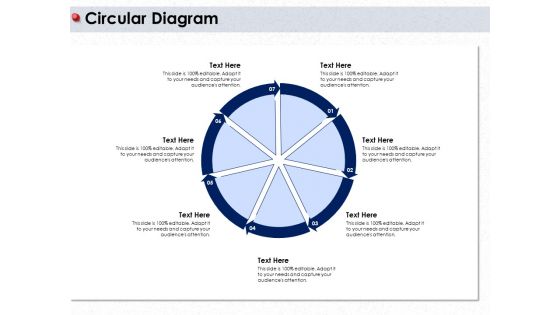
Ways To Design Impactful Trading Solution Circular Diagram Ppt PowerPoint Presentation Portfolio Designs Download PDF
Presenting this set of slides with name ways to design impactful trading solution circular diagram ppt powerpoint presentation portfolio designs download pdf. This is a seven stage process. The stages in this process are circular diagram. This is a completely editable PowerPoint presentation and is available for immediate download. Download now and impress your audience.
Executive Leadership Programs Linear Diagram Ppt PowerPoint Presentation Outline Microsoft PDF
Presenting this set of slides with name executive leadership programs linear diagram ppt powerpoint presentation outline microsoft pdf. This is a three stage process. The stages in this process are linear diagram. This is a completely editable PowerPoint presentation and is available for immediate download. Download now and impress your audience.

Cause And Effect Fish Bone Diagram Ppt PowerPoint Presentation Professional Slide Download PDF
Presenting this set of slides with name cause and effect fish bone diagram ppt powerpoint presentation professional slide download pdf. This is a three stage process. The stages in this process are cause and effect fish bone diagram. This is a completely editable PowerPoint presentation and is available for immediate download. Download now and impress your audience.

5 Stages Interconnected Lego Block Process Work Flow Diagram Ppt PowerPoint Presentation Visuals
This is a 5 stages interconnected lego block process work flow diagram ppt powerpoint presentation visuals. This is a five stage process. The stages in this process are lego blocks, stages, interconnected lego, work flow.
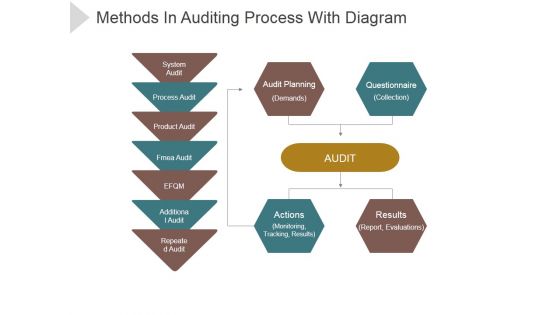
Methods In Auditing Process With Diagram Ppt PowerPoint Presentation Visual Aids
This is a methods in auditing process with diagram ppt powerpoint presentation visual aids. This is a four stage process. The stages in this process are system audit, process audit, product audit, fame audit, additional audit.

Future Of Big Data Analytics Arrow Diagram Ppt PowerPoint Presentation Summary
This is a future of big data analytics arrow diagram ppt powerpoint presentation summary. This is a four stage process. The stages in this process are big data, process, business, marketing, icons.
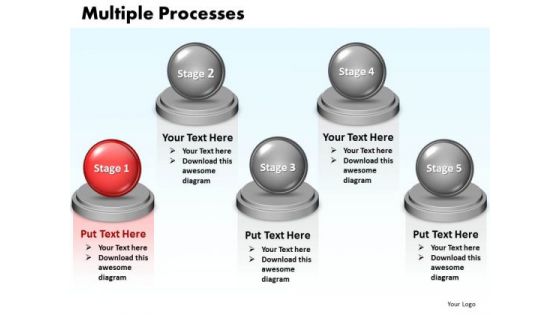
Ppt Multiple Processes Diagram 5 Stages Presentation 0812 PowerPoint Templates
PPT multiple processes diagram 5 stages presentation 0812 PowerPoint Templates-Deliver amazing Presentations with our above Diagram illustrating the five different processes to be explained in one single slide. This Diagram shows the first stage with red color. Clarity of thought has been the key to your growth. Use our Diagram to illustrate your ability.-PPT multiple processes diagram 5 stages presentation 0812 PowerPoint Templates-3d, Abstract, Backgrounds, Ball, Business, Choice, Comparison, Concept, Descriptive, Equilibrium, Grow, Illustrations, Instrument, Measurement, Metallic, Part, Partnership, Pattern, Progress, Reflections, Scales, Several, Sphere, Strategy, Success
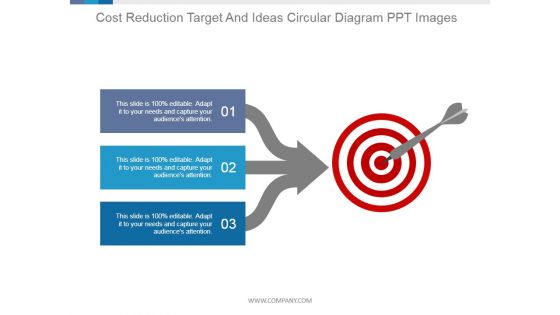
Cost Reduction Target And Ideas Circular Diagram Ppt PowerPoint Presentation Background Image
This is a cost reduction target and ideas circular diagram ppt powerpoint presentation background image. This is a three stage process. The stages in this process are target, achievement, success, arrow, business.

Big Data Life Cycle Impacts Circular Diagram Ppt PowerPoint Presentation Introduction
This is a big data life cycle impacts circular diagram ppt powerpoint presentation introduction. This is a six stage process. The stages in this process are sports predictions, easier commutes, smartphones, personalized advertising, presidential campaigns, advanced healthcare.
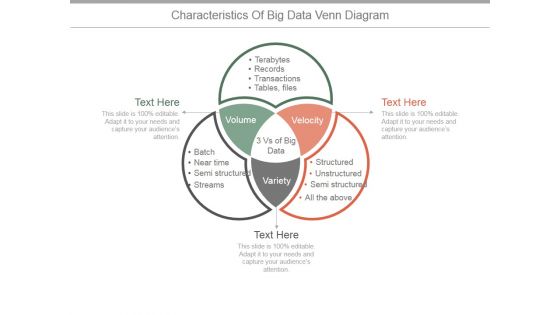
Characteristics Of Big Data Venn Diagram Ppt PowerPoint Presentation Example 2015
This is a characteristics of big data venn diagram ppt powerpoint presentation example 2015. This is a three stage process. The stages in this process are volume, velocity, variety, tables, files, transactions, records, terabytes.

Thank You Customer Support Workflow Diagram Ppt PowerPoint Presentation Infographics File Formats
This is a thank you customer support workflow diagram ppt powerpoint presentation infographics file formats. This is a one stage process. The stages in this process are thank you.

Customer Support Workflow Diagram Ppt PowerPoint Presentation Complete Deck With Slides
This is a customer support workflow diagram ppt powerpoint presentation complete deck with slides. This is a one stage process. The stages in this process are business, management, planning, strategy, marketing.

Ppt Arrow Change Management Process PowerPoint Presentation 3 Phase Diagram Templates
PPT arrow change management process powerpoint presentation 3 phase diagram Templates-This template also allows you to insert your own text to the presentation making it exclusive for you. Bullet Point your ideas and thoughts with this graphics.-PPT arrow change management process powerpoint presentation 3 phase diagram Templates-Arrow, Buttons, Design, Download, Element, Icon, Illustration, Internet, Menu, Modern, Object, Push, Set, Shape, Shiny, Sign, Site, Style, Symbol, Vector, Web

Ppt Arrow Change Management Process PowerPoint Presentation 3 State Diagram Templates
PPT arrow change management process powerpoint presentation 3 state diagram Templates-This Annular Illustration assist you in creating your project roadmap with different ways, interim goals and project steps.-PPT arrow change management process powerpoint presentation 3 state diagram Templates-Arrow Process, Business, Circle, Circular, Collection, Connection, Cursor, Decoration, Design, Dimensional, Direction, Element, Icon, Illustration, Information, Modern, Motion, Paper, Perspective, Plastic, Pointer, Pointing, Recycle, Recycling, Reflective, Set, Shape, Shiny, Sign, Symbol, Technology
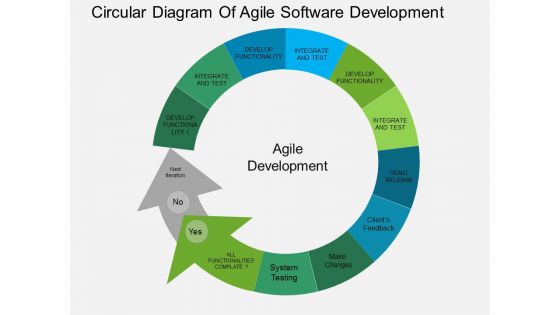
Circular Diagram Of Agile Software Development Powerpoint Templates
This PowerPoint template has been designed with circular diagram This diagram is a data visualization tool that gives you a simple way to present statistical information. This slide helps your audience examine and interpret the data you present.
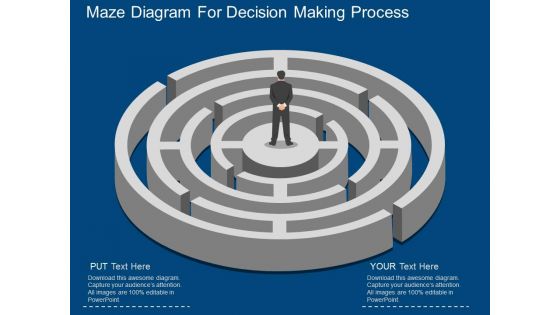
Maze Diagram For Decision Making Process Powerpoint Template
This PowerPoint template has been designed with maze diagram. This maze diagram may be used to display decision making process. Download this slide to build unique and impressive business presentation.
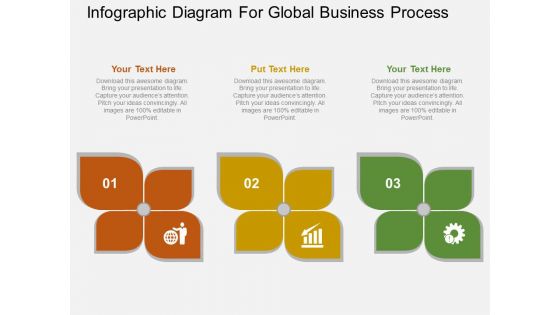
Infographic Diagram For Global Business Process Powerpoint Template
Our above PowerPoint template has been designed with infographic diagram. This PPT slide is suitable to present global business process. Use this business diagram to present your work in a more smart and precise manner.

Venn Diagram For Trade Relationships Ppt PowerPoint Presentation Slide
This is a venn diagram for trade relationships ppt powerpoint presentation slide. This is a three stage process. The stages in this process are venn diagram, business, management, strategy, marketing.
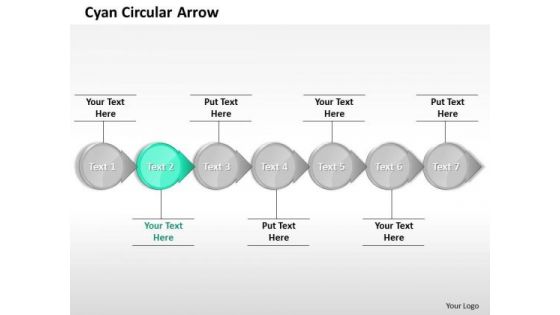
Ppt Correlated Circular Arrows In Straight Line 7 State Diagram Cyan PowerPoint Templates
PPT correlated circular arrows in straight line 7 state diagram cyan PowerPoint Templates-You can insert this circular arrow into flow charts or presentations to help clarify information. Horizontal line helps to shows the relationship -PPT correlated circular arrows in straight line 7 state diagram cyan PowerPoint Templates-Communication, Connection, Diversity, Gather, Generalize, Generalizing, Humanness, Information, Interconnected, International, Internet, Large, Linking, Multinational, Nation, Orbit, Orbital, Orientation, Out-Sized, Peddle, Planetary, Rotation, Satellite, Share
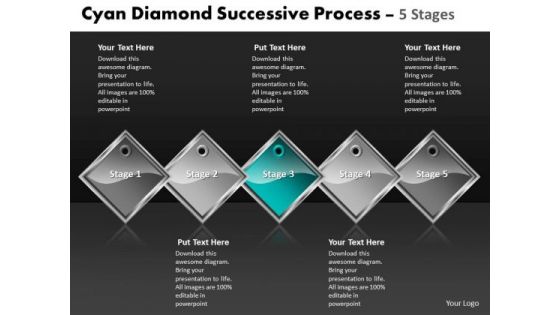
Ppt Cyan Diamond Constant Process 5 Phase Diagram Business PowerPoint Templates
PPT cyan diamond constant process 5 phase diagram Business PowerPoint Templates-Visually support your ideas with our above Diagram which contains a graphic of 3D Diamond Shaped text boxes placed Sequentially. This image has been professionally designed to emphasize the concept of Sequential Process. Add charm and personality to your presentations with our colorful and attractive Diagram. You can change color, size and orientation of any icon to your liking.-PPT cyan diamond constant process 5 phase diagram Business PowerPoint Templates-Advertise, Advertisement, Badge, Box, Business, Card, Collection, Column, Corporate, Costing, Counting, Design, Discount, Element, Featured, Finance, Grid, Hosting, Information, List, Message, Placard, Plan, Price, Pricing, Rectangle, Report, Round

Exercise And Workout Equipment Relationship Diagram Ppt PowerPoint Presentation File Vector PDF
Deliver an awe inspiring pitch with this creative Exercise And Workout Equipment Relationship Diagram Ppt PowerPoint Presentation File Vector PDF bundle. Topics like Relationship Diagram can be discussed with this completely editable template. It is available for immediate download depending on the needs and requirements of the user.
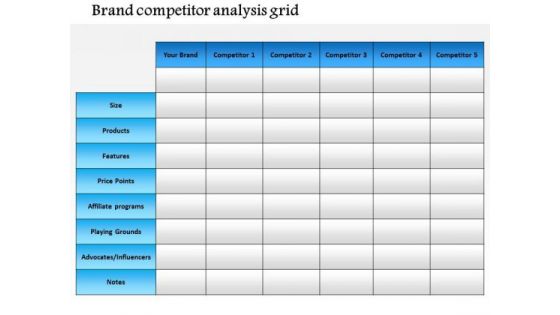
Business Diagram Brand Competitor Analysis Grid PowerPoint Ppt Presentation
This diagram depicts brand competitor analysis grid. It contains graphics of table diagram. This diagram is designed to represent brand analysis with competitors on the basis of size, products, features, price points etc. Use this professional and customized business diagram in your PowerPoint presentations.

Business Diagram A Total Compensation Package PowerPoint Ppt Presentation
Analyze Ailments On Our Business Diagram A Total Compensation Package PowerPoint PPT Presentation PowerPoint Templates. Bring Out The Thinking Doctor In You. Dock Your Thoughts With Our Business PowerPoint Templates. They Will Launch Them Into Orbit.
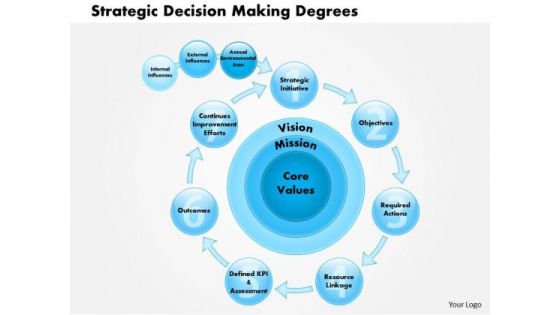
Business Diagram Strategic Decision Making Degrees PowerPoint Ppt Presentation
Analyze Ailments On Our Business Diagram strategic decision making degrees PowerPoint PPT Presentation Powerpoint Templates. Bring Out The Thinking Doctor In You. Dock Your Thoughts With Our Business Powerpoint Templates. They Will Launch Them Into Orbit.

Business Diagram Succession Planning Best Practices PowerPoint Ppt Presentation
Document Your Views On Our Business Diagram succession planning best practices PowerPoint PPT Presentation Powerpoint Templates. They Will Create A Strong Impression. Plan Your Documentary Shot By Shot. Break Them Down On Our Business Powerpoint Templates.
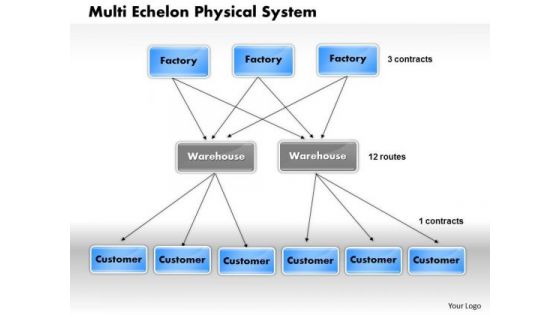
Business Diagram Multi Echelon Physical System PowerPoint Ppt Presentation
Put In A Dollop Of Our Business Diagram Multi Echelon Physical System PowerPoint PPT Presentation Powerpoint Templates. Give Your Thoughts A Distinctive Flavor. Create Your Domain With Our Business Powerpoint Templates. Rule Minds With Your Thoughts.

Business Diagram Npv And Cash Transfer PowerPoint Ppt Presentation
Doll Up Your Thoughts With Our Business Diagram NPV And Cash Transfer PowerPoint PPT Presentation Powerpoint Templates. They Will Make A Pretty Picture. They Say A Dog Is Man's Best Friend. Our Business Powerpoint Templates Come A Close Second.

Business Diagram Inventories And Cash Balances PowerPoint Ppt Presentation
Get The Doers Into Action. Activate Them With Our Business Diagram Inventories And Cash Balances PowerPoint PPT Presentation PowerPoint Templates. Put Your Money On Our Business PowerPoint Templates. Your Ideas Will Rake In The Dollars.

Business Diagram Marketing Technologist Timeline Landscape PowerPoint Ppt Presentation
Open Up Doors That Lead To Success. Our Business Diagram Marketing Technologist Timeline Landscape PowerPoint PPT Presentation PowerPoint Templates Provide The Handles. Opportunity Will Come Knocking At Your Door. Welcome It With Our Business PowerPoint Templates.
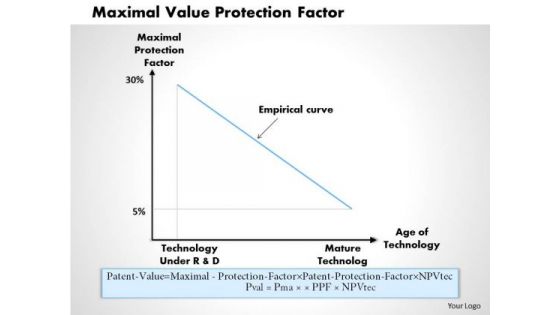
Business Diagram Maximal Value Protection Factor PowerPoint Ppt Presentation
Our Business Diagram Maximal Value Protection Factor PowerPoint PPT Presentation PowerPoint Templates Abhor Doodling. They Never Let The Interest Flag. Our Business PowerPoint Templates Make Good Beasts Of Burden. Place All Your Demands On Them.
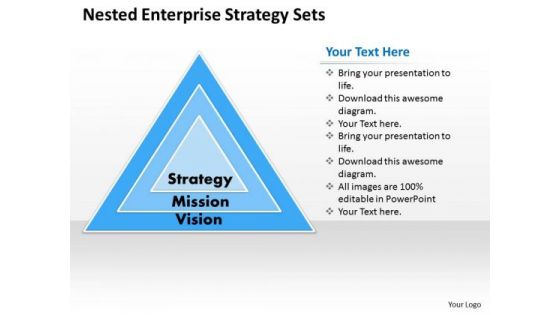
Business Diagram Nested Enterprise Strategy Sets PowerPoint Ppt Presentation
Our Business Diagram Nested Enterprise Strategy Sets PowerPoint PPT Presentation PowerPoint Templates Deliver At Your Doorstep. Let Them In For A Wonderful Experience. Dig Out The Dope With Our Business PowerPoint Templates. Your Thoughts Will Expose The Truth.
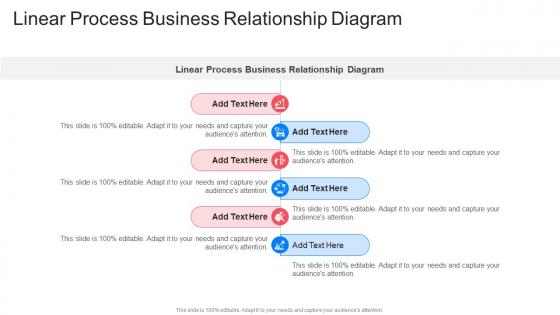
Linear Process Business Relationship Diagram In Powerpoint And Google Slides Cpb
Presenting our innovatively designed set of slides titled Linear Process Business Relationship Diagram In Powerpoint And Google Slides Cpb. This completely editable PowerPoint graphic exhibits Linear Process Business Relationship Diagram that will help you convey the message impactfully. It can be accessed with Google Slides and is available in both standard screen and widescreen aspect ratios. Apart from this, you can download this well structured PowerPoint template design in different formats like PDF, JPG, and PNG. So, click the download button now to gain full access to this PPT design.
Fishbone Diagram Cause Effect Relationship Ppt PowerPoint Presentation Slides Icon
This is a fishbone diagram cause effect relationship ppt powerpoint presentation slides icon. This is a six stage process. The stages in this process are description, cause, problem quality feature, icon, business.
Fishbone Diagram Cause Effective Relationship Ppt PowerPoint Presentation Icon Portrait
This is a fishbone diagram cause effective relationship ppt powerpoint presentation icon portrait. This is a six stage process. The stages in this process are description, cause, problem quality feature.

Circle Diagram For Comparison Of Performance Powerpoint Slides
This PowerPoint template has been designed with circle diagram and employees photos. You may download this PPT slide to depict comparison of performance. Add this slide to your presentation and impress your superiors.
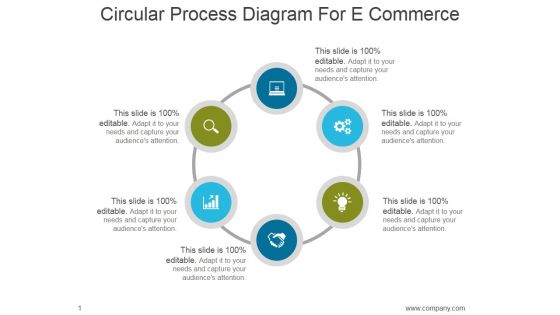
Circular Process Diagram For E Commerce Ppt PowerPoint Presentation Pictures
This is a circular process diagram for e commerce ppt powerpoint presentation pictures. This is a six stage process. The stages in this process are icon, process, circle, flow, business.

Venn Diagram For Venture Capital Funds Powerpoint Slide Information
This is a venn diagram for venture capital funds powerpoint slide information. This is a three stage process. The stages in this process are economy oriented, investor oriented, entrepreneur oriented, venture capital advantages.

Circular Diagram For Business Collaboration Ppt PowerPoint Presentation Summary
This is a circular diagram for business collaboration ppt powerpoint presentation summary. This is a five stage process. The stages in this process are implement, review, solve, analyze, define.

Funnel Diagram Showing Sales Pipeline Ppt PowerPoint Presentation Guidelines
This is a funnel diagram showing sales pipeline ppt powerpoint presentation guidelines. This is a five stage process. The stage in this process are funnel, business, marketing, management, filter.

Funnel Diagram For Product Development Ppt PowerPoint Presentation Design Ideas
This is a funnel diagram for product development ppt powerpoint presentation design ideas. This is a six stage process. The stages in this process are business, marketing, flow, steps, strategy, funnel.
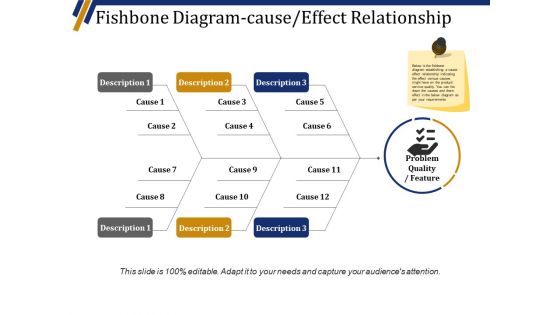
Fishbone Diagram Cause Effect Relationship Ppt PowerPoint Presentation Layouts Maker
This is a fishbone diagram cause effect relationship ppt powerpoint presentation layouts maker. This is a three stage process. The stages in this process are description, cause, problem quality feature, business, management.
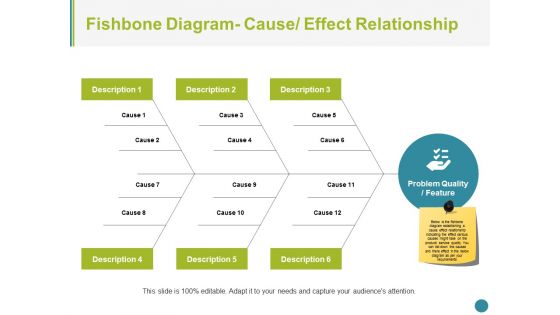
Fishbone Diagram Cause Effect Relationship Ppt PowerPoint Presentation Styles Files
This is a Fishbone Diagram Cause Effect Relationship Ppt PowerPoint Presentation Styles Files. This is a six stage process. The stages in this process are fishbone, management, strategy, analysis, business.
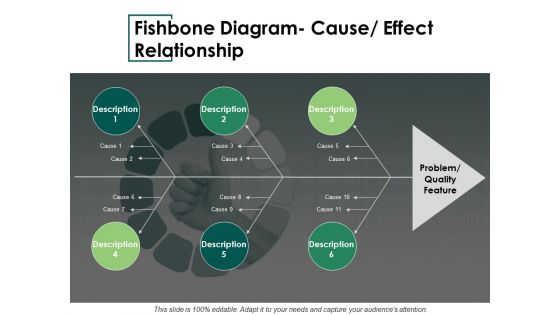
Fishbone Diagram Cause Effect Relationship Ppt PowerPoint Presentation Infographics Slideshow
This is a fishbone diagram cause effect relationship ppt powerpoint presentation infographics slideshow. This is a six stage process. The stages in this process are description, cause, problem quality feature.
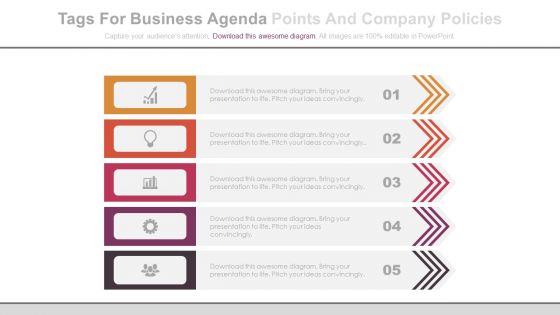
List Diagram Of Business Agenda Points Powerpoint Slides
This PPT slide contains graphics of list diagram. You may download this PowerPoint template to display business agenda points. Make outstanding business presentation with this template.

Arrow Diagram For Seven Options Display Powerpoint Template
This PowerPoint template has been designed with arrow diagram. This infographic template useful for seven options display. Accelerate the impact of your ideas using this template.
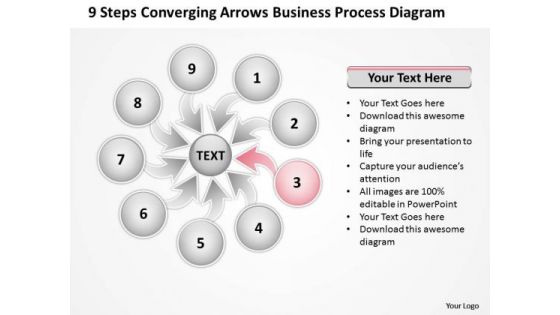
Free Download Process Diagram Relative Circular Flow Arrow PowerPoint Slides
We present our free download process diagram Relative Circular Flow Arrow PowerPoint Slides.Download and present our Leadership PowerPoint Templates because Our PowerPoint Templates and Slides are topically designed to provide an attractive backdrop to any subject. Use our Business PowerPoint Templates because this slide will fire away with all the accuracy at your command. Download and present our Spheres PowerPoint Templates because this diagram depicts the essence of this chain reaction like sequence of events. Use our Arrows PowerPoint Templates because you can Transmit your passion via our creative templates. Download and present our Process and Flows PowerPoint Templates because it helps to churn the mixture to the right degree and pound home your views and expectations in a spectacularly grand and virtuoso fluid performance.Use these PowerPoint slides for presentations relating to Arrows, Business, Central, Centralized, Chart, Circle, Circular, Circulation, Design, Diagram, Executive, Icon, Idea, Illustration, Pointing, Procedure, Process, Resource, Sequence, Sequential, Seven, Square, Strategy, Template. The prominent colors used in the PowerPoint template are Pink, Gray, White. Customers tell us our free download process diagram Relative Circular Flow Arrow PowerPoint Slides are Versatile. Customers tell us our Design PowerPoint templates and PPT Slides are Reminiscent. Presenters tell us our free download process diagram Relative Circular Flow Arrow PowerPoint Slides are Tasteful. PowerPoint presentation experts tell us our Central PowerPoint templates and PPT Slides are Excellent. Customers tell us our free download process diagram Relative Circular Flow Arrow PowerPoint Slides are Elegant. Professionals tell us our Circulation PowerPoint templates and PPT Slides are Fancy.
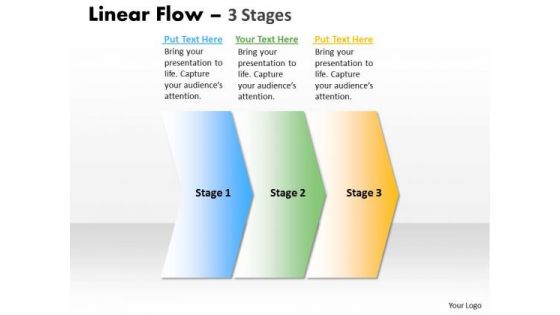
Marketing Ppt Background Non Linear Presentation PowerPoint Flow 3 Phase Diagram Design
We present our marketing PPT Background nonlinear presentation PowerPoint flow 3 phase diagram design. Use our Advertising PowerPoint Templates because, to achieve sure shot success they need to come together at the right time, place and manner. Use our Arrows PowerPoint Templates because, Use our to enthuse your colleagues. Use our Layers PowerPoint Templates because, Core Diagram explore the various hues and layers existing in your in your plans and processes. Use our Shapes PowerPoint Templates because; Demonstrate how they contribute to the larger melting pot. Use our Business PowerPoint Templates because, guaranteed to focus the minds of your team. Use these PowerPoint slides for presentations relating to abstract, algorithm, arrow, block diagram, business, chart, color, connection, design, development, diagram, direction, element, flow, graph, linear, linear diagram, management, organization, plan, process, section, segment, set, sign, solution, strategy, symbol, technology, vector. The prominent colors used in the PowerPoint template are Blue, Green, and Yellow

Diverging Arrow Process Diagram Ppt Relative Circular Flow PowerPoint Template
We present our diverging arrow process diagram ppt Relative Circular Flow PowerPoint template.Download and present our Circle Charts PowerPoint Templates because business ethics is an essential element in your growth. Download and present our Flow Charts PowerPoint Templates because this diagram helps you to show goal also clearly etched in your mind. Download and present our Process and Flows PowerPoint Templates because you can enlighten your skills with the help of our topical templates. Present our Globe PowerPoint Templates because they will Amplify your thoughts via our appropriate templates. Download our Ring Charts PowerPoint Templates because it helps you to get your team in the desired sequence into the bracket.Use these PowerPoint slides for presentations relating to Business,chart, circle, colors, concept,contemporary, corporate, cycle, data,design, detail, development, diagram, engineering, graphic, ideas,illustration, implement, implementation,management, model, modern,organization, phase, plan, process,product, professional, project, quality,schema, set, software, stack, stage, steps, strategy, success, system, tag, team. The prominent colors used in the PowerPoint template are Blue, Gray, White. Professionals tell us our diverging arrow process diagram ppt Relative Circular Flow PowerPoint template are Radiant. People tell us our concept PowerPoint templates and PPT Slides will impress their bosses and teams. The feedback we get is that our diverging arrow process diagram ppt Relative Circular Flow PowerPoint template are Luxurious. Presenters tell us our cycle PowerPoint templates and PPT Slides are No-nonsense. You can be sure our diverging arrow process diagram ppt Relative Circular Flow PowerPoint template are Perfect. PowerPoint presentation experts tell us our data PowerPoint templates and PPT Slides are Lush.

Infographics Diagram For Strategy Planning Process Powerpoint Template
This PowerPoint template has been designed with zigzag steps infographic diagram. This diagram can be used to display strategy planning process. Capture the attention of your audience with this slide.

Balloons Diagram For Financial Goal Planning Powerpoint Slides
This PowerPoint template has been designed with graphics of balloons diagram. You may download this diagram slide to depict balance between demand and supply. Add this slide to your presentation and impress your superiors.
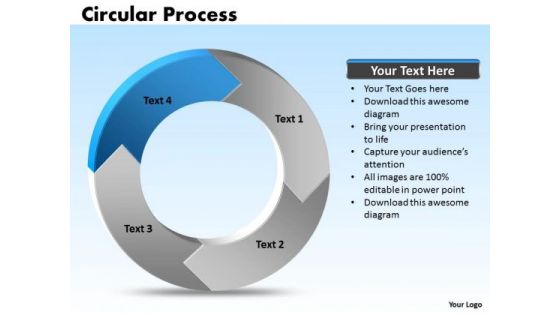
Ppt Edit Data PowerPoint Chart Processing Cycle Diagram 4 State Templates
PPT edit data powerpoint chart processing cycle diagram 4 state Templates-The above template has the theme of circular process Diagram. This image refers the concept of Act Cycle. Adjust the above image in your PPT presentations to visually support your content in your business meetings. This PPT images is so perfectly designed that it make your clients understand the business idea quickly and visually.-PPT edit data powerpoint chart processing cycle diagram 4 state Templates-Arrow, Chart, Circular, Color, Colorful, Connect, Connection, Design, Diagram, Finance, Graphic, Group, Growth, Icon, Illustration, Marketing, Pieces, Process, Recycle, Recycling, Round, Set, Strategy, Symbol, Wheel

 Home
Home